the Creative Commons Attribution 4.0 License.
the Creative Commons Attribution 4.0 License.
 | 15 May 2024
Molecular composition of clouds: a comparison between samples collected at tropical (Réunion Island, France) and mid-north (Puy de Dôme, France) latitudes
Lucas Pailler
Laurent Deguillaume
Hélène Lavanant
Isabelle Schmitz
Marie Hubert
Edith Nicol
Mickaël Ribeiro
Jean-Marc Pichon
Mickaël Vaïtilingom
Pamela Dominutti
Frédéric Burnet
Pierre Tulet
Maud Leriche
The composition of dissolved organic matter of cloud water has been investigated through non-targeted high-resolution mass spectrometry on only a few samples that were mostly collected in the Northern Hemisphere in the USA, Europe and China. There remains, therefore, a lack of measurements for clouds located in the Southern Hemisphere, under tropical conditions and influenced by forest emissions. As a matter of fact, the comparison of the composition of clouds collected in different locations is challenging since the methodology for the analysis and data treatment is not standardized.
In this work, the chemical composition of three samples collected at Réunion Island (REU) during the BIO-MAÏDO field campaign, in the Indian Ocean, with influences from marine, anthropogenic and biogenic (tropical) emissions, is investigated and compared to the chemical composition of samples collected at the Puy de Dôme (PUY) observatory in France. The same methodology of analysis and data treatment was employed, producing a unique dataset for the investigation of the molecular composition of organic matter in cloud water. Besides the analysis of elemental composition, we investigated the carbon oxidation state (OSC) of dissolved organic matter, finding that overall samples collected at PUY are more oxidized than those collected at REU. Molecular formulas were also classified based on stoichiometric elemental ratios, showing the high frequency and abundance of reduced organic compounds, classified as lipids (LipidC), in this matrix, which led to a search for terpene oxidation products in cloud water samples.
To better discriminate between samples collected at PUY and REU, statistical analysis (principal component analysis and agglomerative hierarchical clustering) was performed on the ensemble of molecular formulas and their intensities. Samples collected at REU have a different composition from samples collected at PUY, which is mainly linked to different primary sources, the processing of organic matter in cloud water and the influence of different primary emissions at the two locations.
- Article
(1884 KB) - Full-text XML
-
Supplement
(3023 KB) - BibTeX
- EndNote


Clouds are an important missing piece in the atmospheric chemistry puzzle, affecting the composition of gas and aerosol phases. Soluble gases and a soluble fraction of aerosol particles can dissolve in the cloud droplets, which represent an aqueous chemical reactor where chemical and biological transformations can occur. Transformations in cloud droplets consume chemical compounds and produce new ones, impacting their distribution among the various atmospheric phases (Herrmann et al., 2015). After cloud evaporation, these processes modify (1) the physicochemical properties of the aerosol produced, such as the oxidation state, chemical composition and hygroscopicity (Isokääntä et al., 2022; Crumeyrolle et al., 2008), and (2) the gas-phase chemical composition. Thus, cloud processes are known to play a role in the air quality and climate.
In the past, the attention was focused on the composition and concentration of the inorganic fraction of cloud water. In recent years, an increasing number of studies have approached the characterization of dissolved organic matter (DOM) and its processing by fogs and clouds. Fogs and clouds can contain up to 200 mg C L−1 depending on the environmental conditions (Herckes et al., 2013): the values are lower for clouds collected in remote and marine environments and tend to be higher for fogs due to their proximity to the emission sources and their microphysical properties (smaller droplet size). The highest values were observed near urban areas and in clouds impacted by biomass burning (Ervens et al., 2013). The composition of DOM has been analysed in the past with targeted analytical approaches that enabled the quantification of certain classes of compounds, such as short-chain carboxylic acids, dicarboxylic acids, carbonyls and amino acids (Triesch et al., 2021; Dominutti et al., 2022; Zhao et al., 2019). These classes are selected as they are, for example, soluble, markers of cloud chemical processing, tracers of the sources from the surface or known to participate in the formation of aqueous secondary organic aerosol (“aqSOA”). However, their concentration accounts for only, on average, 10 %–30 % of the composition of DOM, and an important fraction remains not characterized (Herckes et al., 2013). A non-targeted analysis using high-resolution mass spectrometry represents a new approach, which allows for the exploration of the composition of cloud water (Bianco et al., 2018; Cook et al., 2017; Mazzoleni et al., 2010; Zhao et al., 2013). It has already highlighted the complexity of the matrices, with a contrasted level of chemical ageing, with thousands of different detected compounds resulting from biogenic or anthropogenic sources and secondary products from atmospheric reactivity (Wozniak et al., 2008).
A large fraction of the works on cloud and fog chemical composition has been performed on samples collected in the Northern Hemisphere; a lack of measurements is observed in the Southern Hemisphere, especially at tropical latitudes and/or in remote marine environments. These regions present highly different environmental condition (temperature and sun irradiation) emissions and sources which could impact the distribution and transformations of the DOM in cloud water.
Réunion Island (REU), located in the Indian Ocean, is used as a natural laboratory to analyse the photochemical and microbiological processes occurring in clouds forming under tropical conditions (Duflot et al., 2019). In the framework of the BIO-MAÏDO project, an intensive field campaign was conducted in 2019 in the Saint Paul region of Réunion Island. During this campaign, cloud samples were collected on the slope of the Maïdo where state-of-the-art instrumentation was deployed in order to study the role of clouds in atmospheric chemistry (Leriche et al., 2023). In this framework, Dominutti et al. (2022) reported the chemical composition and physical properties of 14 cloud events collected at REU in March–April 2019. A highly comprehensive chemical screening has been performed in cloud water samples including ions, metals, oxidants and organic matter (organic acids, sugars, amino acids, carbonyls and volatile organic compounds). In particular, this work highlights the high molecular complexity with elevated DOM content.
Cloud collection is performed routinely at the Puy de Dôme (PUY) observatory, located in the Massif Central region of France at 1465 m a.s.l. (above sea level). The PUY station is a remote sampling site which allows for the collection of air masses mostly influenced by marine emissions that are transported over a long distance. Physicochemical measurements are performed for each sample and reported in the free available database called Puycloud (Deguillaume and Bianco, 2017). Several cloud water samples collected at PUY have already been analysed by FT-ICR MS (Fourier-transform ion cyclotron resonance mass spectrometry) (Bianco et al., 2018, 2019a, b), but the analytical methodology adopted (analysis and data treatment) was slightly different from the one used in this study. Recently, we developed a new methodology for the noise removal, the data assignment and the blank correction described in detail in the study by Pailler et al. (2022), which facilitate the comparison of the samples.
In this work, we present the analysis by high-resolution mass spectrometry using FT-ICR MS (Fourier-transform ion cyclotron resonance mass spectrometry) of three cloud water samples collected at Réunion Island (REU) and of seven cloud water samples collected at Puy de Dôme (PUY) in spring (two samples), summer (one sample), and autumn (four samples) between 2019 and 2021 (Table 1). Only three samples collected at REU had enough volume to perform the FT-ICR MS analysis. For sampling at PUY and REU, the same cloud water collectors were used (Vaïtilingom et al., 2024), and two instruments with different magnetic fields (12 T and 9.4 T FT-ICR MS, from Bruker, with the same ionization source) were used to perform the analysis; the same data treatment was applied to each sample. Our work provides a unique dataset for an improved comparison of the composition of cloud samples. Despite the limitation produced by the analysis with two different FT-ICR MS, we decided to compare the composition of the samples to highlight the differences and similarities of cloud water DOM collected in different environmental conditions but with the same analytical procedure.
2.1 Sampling at REU
The BIO-MAÏDO field campaign was conducted between 14 March and 4 April 2019 at Réunion Island (REU) and is described in detail in the study by Dominutti et al. (2022) and Leriche et al. (2023). Five sampling sites were instrumented during the campaign along the slope of the Maïdo between 965 and 2165 m a.s.l. During the campaign, clouds were forming quasi-daily along the slope by the end of the morning (El Gdachi et al., 2024).
Cloud sampling was performed at Piste Omega ( S, E), located at 1760 m a.s.l. The sampling site is located in the western part of the island, along the road to the Maïdo peak, around 5 km away from the Maïdo observatory (Baray et al., 2013). This site, corresponding to the forest between 1500 and 1900 m a.s.l., was chosen for the formation of clouds on a daily basis. It is mainly surrounded by biogenic sources such as tropical forests characterized by the endemic tree species Acacia heterophylla (Fabaceae), locally called “tamarinaie”, and plantations of the coniferous species Cryptomeria japonica (Taxodiaceae). Below 1400 m a.s.l. the vegetation is characterized by scattered trees, and below 600–700 m a.s.l. it is characterized by the cultivation of sugarcane. Cloud samples were obtained using a cloud collector (Deguillaume et al., 2014; Renard et al., 2020; Vaïtilingom et al., 2024), which collects cloud droplets larger than 7 µm (estimated cut-off diameter) by impaction onto rectangular aluminium plates. The cloud collector was installed at the top of a 10 m mast, and cloud water samples were collected on an event basis. Before sampling, the cloud collector was rinsed thoroughly with ultrapure Milli-Q water, and the aluminium plates, the funnel and the container were autoclaved to avoid biological contamination. At the beginning of the campaign, sterilized Milli-Q water was spread on the clean cloud collector and analysed with different approaches to detect any chemical or biological contamination. The samples were immediately filtered after collection on a 0.20 µm nylon filter to eliminate microorganisms and micrometric particle residues. For three samples, named R8, R9 and R10B following the numbering of clouds proposed by Dominutti et al. (2022), the volume was large enough to perform a FT-ICR MS analysis: aliquots of 50 mL were frozen in a polypropylene vial and kept at −18 °C until the analysis.
Back-trajectory plots of the air masses were computed with the Meso-CAT model (Rocco et al., 2022), resulting from the coupling between the high-resolution and Meso-NH simulations, and the Lagrangian tool, CAT (Computing Advection-interpolation of atmospheric parameters and trajectory tool; Baray et al., 2020).
2.2 Sampling at PUY
The PUY observatory belongs to the atmospheric survey networks EMEP (European Monitoring and Evaluation Programme), GAW (Global Atmosphere Watch) and ACTRIS (Aerosols, Clouds, and Trace Gases Research Infrastructure); the observatory is part of the fully instrumented platform for atmospheric research, Cezeaux-Opme-Puy de Dôme (CO-PDD; Baray et al., 2020).
Cloud water sampling was performed with the same cloud collector deployed at REU but installed on the roof of the observatory (1465 m a.s.l.). The aluminium impactor was cleaned and sterilized by autoclaving before each cloud collection. Samples were collected in sterilized bottles, and the cloud water was filtered using a 0.20 µm nylon filter. The pH was measured immediately after sampling. The concentration of oxidants, the concentration of main inorganic and organic ions, and dissolved organic carbon were measured on frozen aliquots. An aliquot of each sample was frozen on site and stored in appropriate vessels at −20 °C until these samples were analysed by mass spectrometry (FT-ICR MS). More details about the physicochemical analysis are reported in Bianco et al. (2015).
The air mass origins for each event were calculated using a 72 h back trajectory obtained using the CAT model (Baray et al., 2020) at an interception height of 1465 m a.s.l., corresponding to the PUY summit.
2.3 Sample treatment, FT-ICR MS analysis and data treatment
The cloud water samples were thawed at an ambient temperature (≈ 20 °C) in a bench hood. Solid-phase extraction (SPE) was used to concentrate the cloud DOM and remove inorganic salts before the FT-ICR MS analysis. Strata-X (Phenomenex) cartridges (1 g of sorbent contained in Teflon® tubes) were used for SPE following the procedure already described in the study by Pailler et al. (2022). SPE extracts were stocked at 4 °C in brown glass vials with a Teflon® cap until the analysis. The sample blank was extracted by the SPE using the same procedure used for the cloud water sample.
A high-resolution mass spectrometry analysis was performed using a FT-ICR solariX XR 12T (Bruker, Germany; Cobra Laboratory, INSA Rouen, France) for REU samples and a FT-ICR solariX XR 9.4T (Bruker, Germany; LCM Laboratory, Ecole Polytechnique de Massy Palaiseau, France) for PUY samples, both equipped with an electrospray ionization (ESI; Bruker) source set in the negative ionization mode. The instruments were externally calibrated with sodium trifluoroacetate (NaTFA). Samples were infused directly into the ESI source. The parameters were optimized to obtain a stable ion current with a minimum ion injecting time into the mass analyser. The infusion flow rate was 2.0 µL min−1, the drying gas temperature was 200 °C, and the drying and nebulizing gas flow rates were 4.0 L min−1 and 1 bar, respectively. The ESI capillary voltage was 3.6 kV in the negative ion mode. A total of 100 scans were accumulated for each spectrum. Methanol was injected prior to the injection of each sample, and the acquisition was performed to evaluate the potential presence of residual pollutants. The acquisition size was set to 8 M, resulting in a mass resolving power of (11.8 ± 2.1) × 105 for REU samples at 200 and (4.4 ± 0.6) × 105 for REU samples at 600 . PUY samples were acquired with a slightly lower resolution of (7.5 ± 0.3) × 105 at 200 and (2.6 ± 0.3) × 105 at 600 .
Each spectrum was preliminarily treated after acquisition with Bruker Data Analysis software. Spectra were internally recalibrated using the recalibration list reported in Pailler et al. (2022), and the peak lists were extracted with a signal-to-noise () ratio higher than 7. The noise was determined by considering the whole mass range of the spectrum. Formula assignment was performed with molecular formula assignment software (MFAssignR) using the procedure detailed in the study by Pailler et al. (2022). For clarity, recalibration and a ratio correction were not applied to the peak list since they were already performed with Bruker Data Analysis software. Nevertheless, we decided to apply isotope filtering, which is a crucial step to avoid an incorrect monoisotopic assignment. This feature allows a tentative filtering of masses with 13C and 34S from the mass list and creates a separate mass list containing the monoisotopic masses along with the polyisotopic masses and their types (13C or 34S isotopes). Those lists were used as separate inputs in the MFAssignR molecular formula (MF) assignment (Schum et al., 2020). For the MF assignment, we searched for even-number electron deprotonated molecules [M–H]− with a single negative charge in the range of 100–1000 Da; no radicals were allowed. The double bond equivalent (DBE) was set to be in the range of 0–25 in accordance with Giannopoulos et al. (2021) and Koch et al. (2005), and the elemental composition was in the range (Bianco et al., 2018). Phosphorous assignment is tricky in mass spectrometry as it has one single stable isotope. In order to avoid incorrect assignment of P, only C, H, N, O and S atoms are considered in the first assignment. Then, the unassigned masses are used to perform a second assignment considering P. It is a more reliable method to assign MFs without excluding P atoms that are significantly present in the environmental samples (Rivas-Ubach et al., 2018). The tolerance for the assignment was set to 0.1 ppm, and the DOM–NOM (dissolved organic matter and natural organic matter) rules were chosen for the attribution (Koch et al., 2005; Koch and Dittmar, 2006). The assignment relies on a de novo calculation (where de novo stands for the first of a series) based on the value set at 300 Da, the matching tolerance and the elemental range constraint. CH2 and H2 MF extensions were used to extrapolate from a de novo calculation to find target peaks related by these natural patterns. The output of the function gives a list of ambiguous (multiple MFs that have been assigned to the same mass) and unambiguous (MFs that have been assigned to a unique mass) MFs. Only MFs in the unambiguous list were considered for further data comparison because the list of ambiguous MFs was empty in most cases. Seven criteria were applied to exclude formulas that do not occur abundantly in natural organic matter: DBE must be an integer value, 0.2 ≤ ≤ 2.4, ≤ 1.5, ≤ 0.5, ≤ 0.2, 2 ≤ H ≤ (2C + 2) and O ≤ (C + 2). In the case of the assignment of multiple isotopes, only the monoisotope was considered. The peak list of the blank sample was assigned with the same procedure used for the sample. MFs obtained for the blank were excluded from the samples without considering the intensity of the peaks.
The instrument with a higher resolving power was expected to enable the assignment of a larger number of assigned molecular formulas within the chosen margin of tolerance, as more isobaric species were separated. Using a similar tuning for 12 T and 9.4 T FT-ICR MS, and similar formula assignment routines, the number of assigned molecular formulas were found to be different depending on the sample and not only on the resolving power of the instrument. In fact, depending on the chemical composition of the sample and the SPE step, ion suppression effects could occur with ESI, thus decreasing the overall number of interpretable signals. To account for this difference in total numbers of assigned molecular formulas, we chose to use a conservative approach by working with a relative number of occurrence (or relative weighted occurrence) of molecular formulas within a class (Eqs. S1 and S2 in the Supplement).
In order to classify MFs, the methodology proposed by Rivas-Ubach et al. (2018) was used in this work. The authors proposed a multidimensional stoichiometric constraint classification (MSCC) based on C, H, N, O, P and S stoichiometric ratios in six main categories (hereafter RUCs for Rivas-Ubach classes): LipidC, PeptideC, Amino-sugarC, CarbohydrateC, NucleotideC and Oxy-aromaticC (Rivas-Ubach et al., 2018). This classification was already adopted for samples collected at PUY and described in the study by Renard et al. (2022).
2.4 Statistical analysis
The analysis of variance (ANOVA) test, used to determine differences between parameters measured for different samples, such as the OSC (carbon oxidation state), was performed using the ANOVA One-Way package of OriginPro. Principal component analysis (PCA) and agglomerative hierarchical clustering (AHC) were performed using OriginPro on the matrix containing the intensity of each MF for the samples collected at REU and PUY. Unluckily, samples were analysed with two different FT-ICR MS instruments, which could potentially introduce a bias in the statistical analysis. In this matrix, MFs represented the scores (9251 MFs) and samples represented the loadings (10 in total: 3 for REU and 7 for PUY). For samples from REU and PUY, the intensity of each MF was normalized by the sum of the intensity of the assigned MF for each sample, adopting the procedure described in the study by Gurganus et al. (2015). The PCA was performed using the Pearson correlation. The two principal components covered 50.7 % of the variance of the matrix. For AHC, the same matrix was analysed using Ward's method, which analyses the variance of clusters and is the most suitable method for quantitative variables. The number of clusters was defined (two).
3.1 The characterization of cloud samples: chemical composition and air mass history
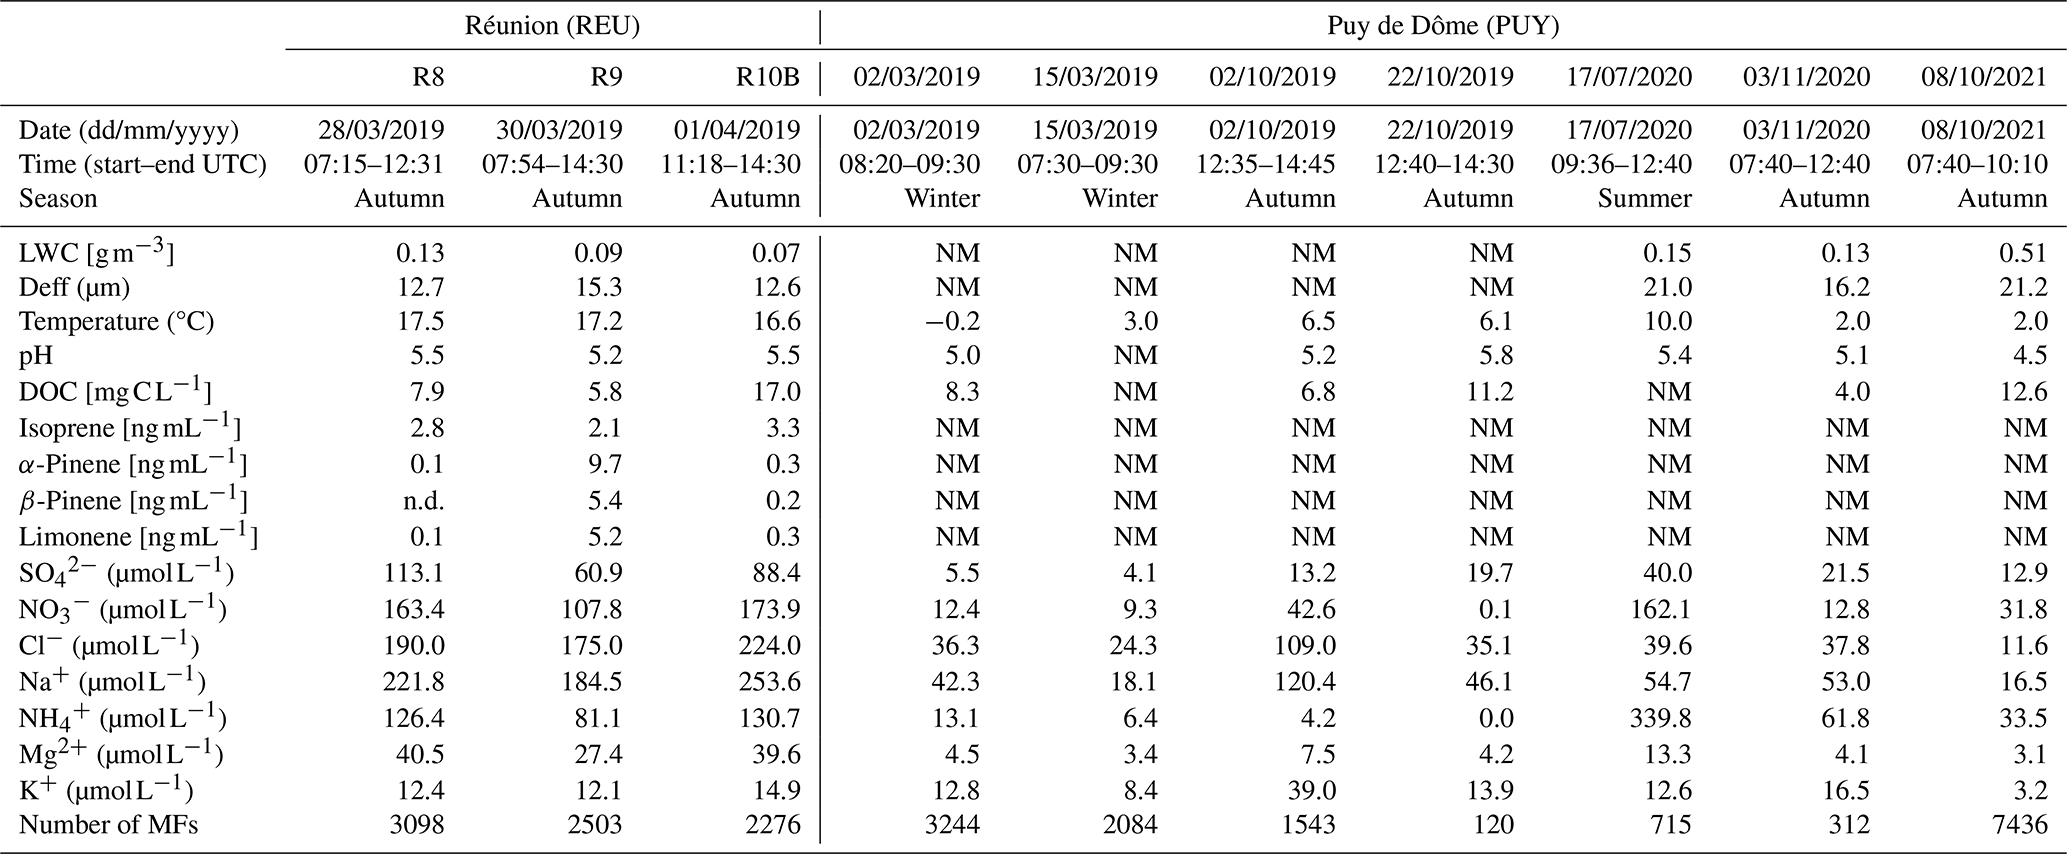
The concentrations of inorganic ions and the analysis of the back trajectory of the air masses give useful information on the anthropogenic and biogenic influence of the cloudy air. Clouds have been collected and physicochemical measurements have been performed at PUY since 2001. Using a multicomponent statistical analysis of the concentrations of main inorganic ions and pH, clouds are classified into four different categories: polluted, continental, marine and highly marine, as described in the studies by Deguillaume et al. (2014) and Renard et al. (2020). In parallel, this chemical classification is confronted to air mass history, which is assessed with the back-trajectory CAT model. In this work, based on their chemical compositions, all the studied PUY samples are classified as marine. This class is mainly characterized by its low content of ions. Only the sample from 17 July 2020, with a concentration of 339.8 µmol L−1, could present influences from continental sources. The analysis of the back trajectory shows that the air mass corresponding to this sample effectively has a marine origin, but it has travelled at low altitude (below 2 km) on the continental north sector before reaching the PUY summit (Fig. S1 in the Supplement). Similarly, the sample from 8 October 2021 presents a low ionic content but a high dissolved organic content (DOC) value: the back-trajectory plot shows the intrusion of air masses of continental and marine origins in the free troposphere, with an up-drift of the air masses at an altitude of 5 km and a consequent descent of the air mass before reaching the PUY summit. The liquid water content (LWC) of the cloud samples presented in this work is comparable with values measured in the marine stratus and stratocumulus clouds.
The correlation between ion content and air mass history has been fully highlighted for the PUY situation. For samples collected at REU, this is much less obvious since the circulation of air masses reaching the sampling site is completely different and highly variable in time and space. The Maïdo region located to the northwest of the island is conditioned by the lifting of the trade winds over the relief of the island and the circumvention of the trade winds around the relief (El Gdachi et al., 2024). This low- and medium-altitude flow leads to a return flow generally located in the west and northwest sector. All of these circulations lead almost daily to cloud formation on the slopes of Maïdo in the morning and beginning of the afternoon and evaporation of the clouds at the end of the daytime (e.g. Duflot et al., 2019; Rocco et al., 2022; Leriche et al., 2023). During the BIO-MAÏDO campaign, 14 cloud samples were collected and characterized by physicochemical analysis. Samples R8, R9 and R10B are in the average of the samples collected during the campaign and present LWC values mainly below 0.1 g m−3, similarly to the values reported for fog (Gonser et al., 2012; Mazoyer et al., 2022). The ionic content in the three samples is elevated due to the contribution of sea salt to the cloud formation (Na+: 220 ± 35 µmol L−1; Cl−: 196 ± 25 µmol L−1). Nitrates show concentrations of 148 ± 36 µmol L−1, probably linked to local anthropogenic sources, mainly located in the coastal zone. Anthropogenic compounds are then transported by anabatic breezes during the day, as confirmed by the high concentration of sulfate (87 ± 26 µmol L−1). The pH of the cloud samples does not vary a lot, with values ranging from 5.2 to 5.5. Values are reported in Table 1.
The average concentration of DOC is equal to 10.2 ± 6.0 mg C L−1, which is much higher than values reported in marine environments (Gioda et al., 2011) or at the PUY station (Deguillaume et al., 2014). R10B shows a particularly high value of DOC of 17.0 mg C L−1. As for inorganics, this indicates additional inputs of DOC other than sea-related ones.
Table 1 reports the physical and chemical characteristics of the cloud events, such as dates, sampling period, liquid water content (LWC), mean effective diameter (Deff), temperature, pH, and concentrations of total organic carbon (TOC) and terpenes in water. Ancillary measurements extracted from Dominutti et al. (2022) of carboxylic acids and carbonyls are reported in Table S1 in the Supplement.
Table 1Date, sampling time, and microphysical and physicochemical characteristics of samples presented in this work. NM stands for not measured.
3.2 Molecular characterization
The numbers of assigned MFs for R8, R9 and R10B were 3098, 2503 and 2276, respectively, after blank exclusion (Table 1). The MFs were grouped into the following groups, based on elemental composition: CHO, CHNO, CHOS, CHNOS, CHOP, CHNOP, CHOSP, CHNOSP, CHP, CHS, CHNP, CHSP, CHNSP and CHNS. Since the abundance of the groups CHP, CHS, CHNP, CHSP, CHNSP and CHNS was always below 0.2 %, they will not be considered for the further analysis. The relative contribution of each group was calculated taking into account only the number of MFs (percentage in number) or the number and the intensity of the MFs (weighted percentage), as reported in Fig. 1.
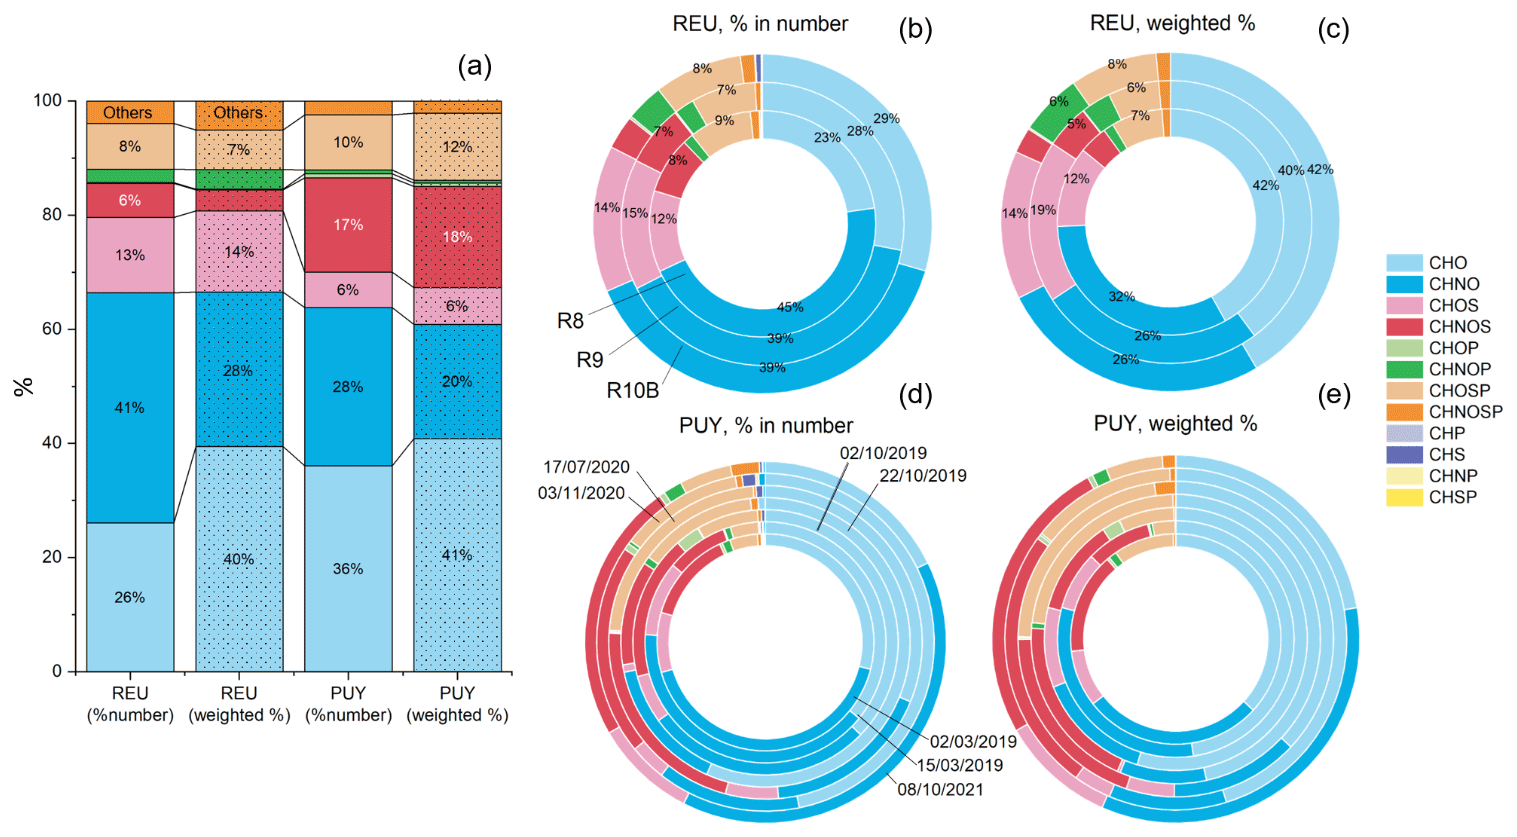
Figure 1(a) Average elemental composition in percentage of samples collected at REU and PUY. Plain histograms represent the percentage in the number of MFs (% in number), while dotted histograms depict the percentage weighted for the intensity of the MFs (weighted %). The “Others” category represents the CHNOSP, CHP, CHS, CHNP and CHSP groups. (b, c) Pie plots depict the elemental composition, in number of MFs and weighted for the intensity of the MFs, for R8 (inner circle), R9 (middle circle) and R10B (outer circle). Labels are reported only if the % is higher than 5 %. (d, e) Similarly to (b) and (c), these panels represent pie plots of the elemental composition of samples collected at PUY. The order of representation, from the inner to the outer circle, is 2 March 2019, 15 March 2019, 2 October 2019, 22 October 2019, 17 July 2020, 3 November 2020 and 8 October 2021. The legend is the same for all the plots.
Considering the percentage in number, CHO accounted, on average, for 26.7 % ± 3.5 %, with higher values for R9 and R10B (28.0 % and 29.5 %, respectively) than R8 (22.8 %). The CHNO contribution was 45.5 %, 39.4 % and 39.0 % for R8, R9 and R10B, respectively. Similarly, CHOS was more abundant in number in R9 and R10B (14.0 % and 14.9 %, respectively) than in R8 (11.6 %), while CHNOS showed a different trend, with a contribution in number of 8.1 %, 7.0 % and 3.2 % for R8, R9 and R10B, respectively. The most abundant group containing phosphorus in number of MFs was CHOSP, with an abundance up to 9 % for R8. The other groups always contained less than 3 % of MFs. Overall, the relative percentage of CHOP, CHNOP, CHOSP, CHNOSP, CHP, CHS, CHNP, CHSP, CHNSP and CHNS groups, in number of MFs, never overtakes 14 % and will be considered as “Others” in the following discussion.
The weighted percentages showed a slightly different trend: the CHO group was predominant for the three samples, with a weighted average percentage of 40.9 % ± 1.1 %, while the CHNO group accounted for 28.0 % ± 3.8 %, reaching 32.3 % for R8. The CHOS and CHNOS groups accounted for 14.7 % ± 3.5 % and 3.8 % ± 1.3 %, respectively. In general, the contribution of each group was homogeneous for all the samples, with negligible differences between the groups. Interestingly, CHNO compounds presented a higher number of compounds than CHO but with a lower intensity; this result reflects the complex composition of the CHNO subgroup.
The number of assigned MFs after blank exclusion for samples collected at PUY is highly variable, ranging from only 120 MFs for the sample from 22 October 2019 to 7436 MFs for the sample from 8 October 2021 (Table 1). This variability is due to the influence of primary emissions and to the atmospheric reactivity: a similar variability in the number of MFs has already been observed in previous works (Zhao et al., 2013; Cook et al., 2017; Sun et al., 2021; Bianco et al., 2018, 2019b). In addition, the DOC concentration and the number of MFs show no correlation in this work and in published data (Fig. S2). The statistical analysis t test was used to compare the averages of the PUY and REU samples and to determine if the differences are significant (p<0.05) or not (p≥0.05). Interestingly, the PUY samples presented a lower abundance of CHNO compounds (27.9 ± 12.6 percentage in number and 20.1 ± 10.5 weighted percentage), as reported in Fig. 1. Consequently, the CHO contribution was 36.4 ± 12.6 in percentage in number, higher than the value observed for REU samples, while the weighted percentage, of 41.1 ± 10.4, was not different. Nevertheless, these differences are not significant for CHO (p≥0.05) and may be significant for CHNO (p=0.058). A larger dataset is needed to draw conclusions on this point. Conversely, the contribution of CHOS was significantly higher (p<0.01) in REU samples (13.5 % in number, 14.7 % in weight) than in PUY samples (6.3 % in number, 6.5 % in weight). One explanation is the possible influence of fresh marine emissions at REU that can be responsible for the emission of organosulfate compounds (Wang et al., 2023). Similarly, the number of CHNOS compounds was significantly lower in samples collected at REU (p<0.01).
To go further, Fig. S3 reports the comparison of the number of carbons (no. of C), of hydrogen (no. of H), of oxygen (no. of O), of nitrogen (no. of N) and of sulfur (no. of S); the DBE, the elemental ratios (oxygen to carbon–O/C, hydrogen to carbon–H/C, nitrogen to carbon–N/C and sulfur to carbon–S/C), the carbon oxidation state (OSC), the aromaticity index (AI) and the CHO index. The last three parameters, calculated as reported in Sect. S2 in the Supplement, are currently used in high-resolution mass spectrometry to investigate, respectively, the oxidation state of organic matter (Dzepina et al., 2015), the presence of aliphatic and aromatic compounds (Melendez-Perez et al., 2016), and the relative H, O and C content in organic molecules (Mann et al., 2015). Figure 2a depicts the OSC for samples collected at REU (in yellow) and at PUY (in blue). The OSC is a parameter that always increases with oxidation and was studied to investigate the oxidation of DOM in aerosols, rains and fogs. Commonly, reported measurements by ESI of water-soluble organic carbon (WSOC) indicate OSC values lower than −0.9 for aerosol (in red in Fig. 2a), between −0.9 and −0.7 for rainwater (in green), and higher than −0.7 for fog water (in purple; Kroll et al., 2011). This increase in the OSC suggests additional oxidation of WSOC in the aqueous phase. The ANOVA test, a statistical tool for the analysis of the difference between the means of more than two datasets, was used to investigate the differences in OSC between PUY and REU samples, as reported in Fig. S4. R8 and R9 are similar since they are significantly different from R10B. Nevertheless, the three samples collected at REU are not significantly different from the autumn samples collected at PUY (22 October 2019, 3 November 2020 and 8 October 2021), with the exception of 2 October 2019. Two t tests were used to confirm these results using the average and standard deviation of OSC. The PUY dataset presents more heterogeneous values than the REU sample set, with a clear seasonal variation: winter samples have a lower OSC than summer and autumn samples of −0.97 ± 0.56 (winter), −0.75 ± 0.65 (autumn) and −0.60 ± 0.58 (summer). The t tests showed that the PUY samples collected in winter and summer are statistically different from those collected at REU in winter and summer (Table S2). This can be explained by the lower photoreactivity and the lower temperature during winter that decreases the efficiency of oxidation processes. The measured OSC for the PUY autumn samples is not significantly different from the one measured at REU −0.77 ± 0.55 (p>0.05); nevertheless, the environmental conditions are not comparable. This similarity could be due, on one side, to the presence of compounds freshly emitted in REU samples that start to be processed in cloud water, with a high temperature and oxidant concentration, and, on the other side, to the presence of moderately aged DOM from atmospheric processes at a lower temperature at PUY. Temperature plays a key role in the processing of DOM; this is confirmed by the fact that samples collected at PUY during winter, with the temperature below 3 °C, have a lower OSC. For each season and location, the OSC values correspond to those observed for rainwater and fog water, which contain more oxidized DOM than aerosols due to aqueous-phase transformations. This trend is confirmed for all the subgroups, but the values vary: for CHO compounds, OSC is −0.48 ± 0.17 at PUY and −0.56 ± 0.08 at REU, while for CHNO, it is −0.91 ± 0.26 at PUY and −0.98 ± 0.08 at REU, attesting to the fact that CHO compounds are generally more oxidized than CHNO. CHOS compounds, as reported in Fig. S5, show an OSC value around −0.66 at PUY and −0.49 at REU, while CHNOS compounds have OSC of −1.35 at PUY and −0.91 at REU, confirming the trend observed for CHNO.
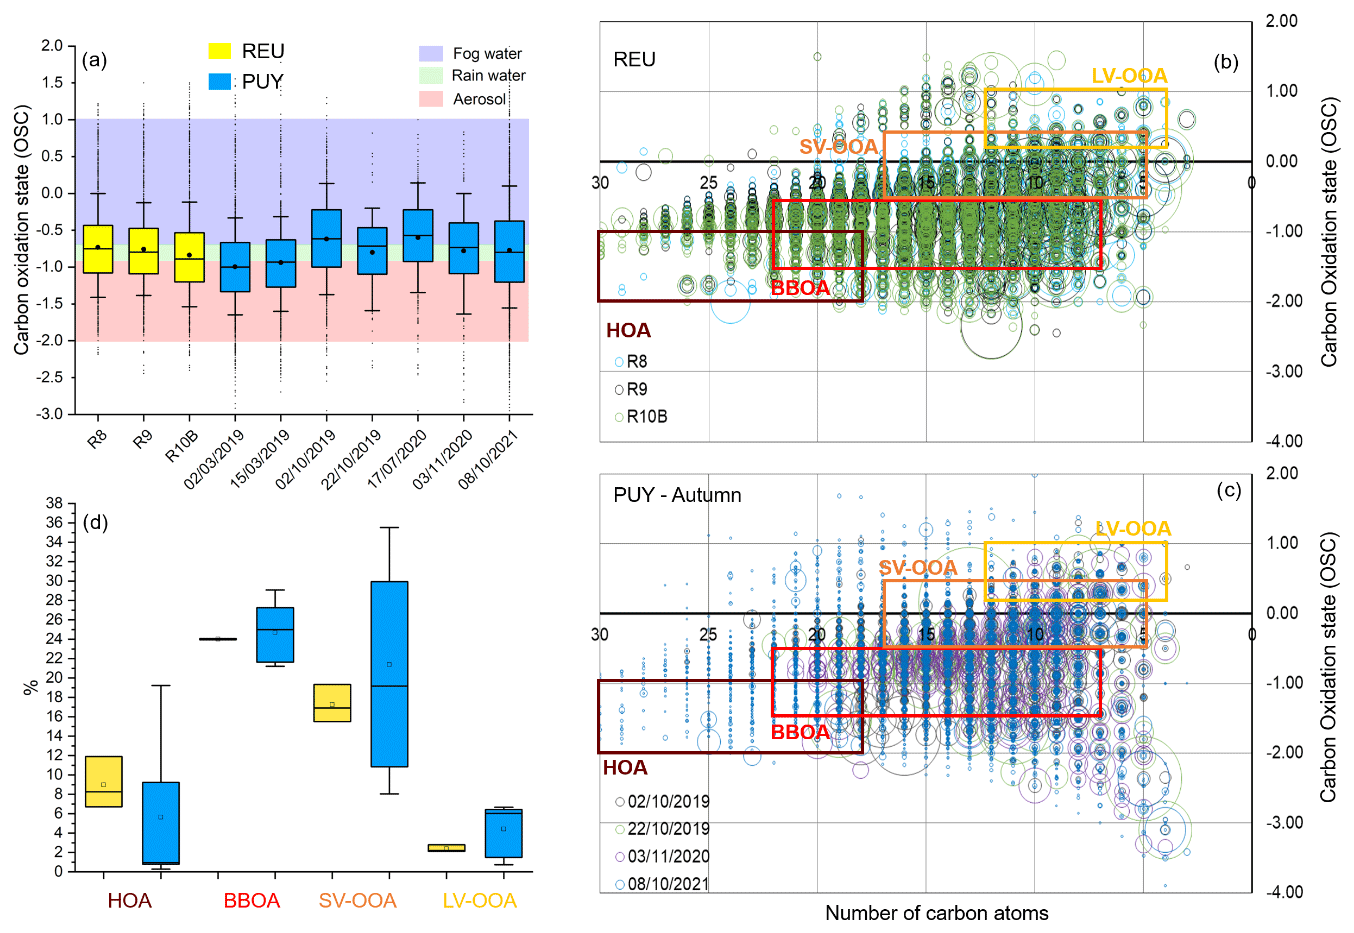
Figure 2(a) Box plot of the carbon oxidation state (OSC) for samples collected at REU (yellow) and at PUY (blue). The box represents the 1st–3rd quartile, the continuous line is the median, the dot is the mean, and the whiskers are the 10th and 90th percentiles. Outliers are depicted with dots. OSC ranges for aerosol, rainwater and fog water are in red, green and purple, respectively (Kroll et al., 2011). (b) Bubble plot of the OSC–nC space for samples collected at REU. The intensity of the bubble is proportional to the intensity of the mass signal for all the formulas with the same OSC. The dark red square indicates hydrocarbon-like organic aerosol (HOA), the red square indicates biomass burning organic aerosol (BBOA), the orange square indicates semivolatile oxidized organic aerosol (SV-OOA) and the yellow square indicates low-volatility oxidized organic aerosol (LV-OOA). (c) Similar to (b) but with a bubble plot of the OSC–nC space for samples collected at PUY. (d) Box plot of the abundance (in percentage) of the HOA, BBOA, SV-OOA and LV-OOA for samples collected at REU (yellow) and PUY (blue). The box represents the 1st–3rd quartile, the continuous line is the median, the square is the mean, and the whiskers are the 10th and 90th percentiles.
Based on the study of Kroll et al. (2011), the plot reporting OSC as a function of the number of carbon atoms (nC), presented in Fig. 2b and c, gives additional insights into DOM composition and atmospheric chemical processes such as oligomerization, functionalization and fragmentation of molecules. For more clarity, only the four autumn samples collected at PUY are reported in Fig. 2c; winter and summer samples are reported in Fig. S6. REU samples present a very homogeneous signal, with the OSC between −2 and 1 and the nC higher than 5. Autumn samples from PUY are often dominated by a few signals with a high intensity, as in the case of the sample from 2 October 2019, which shows an intense signal at the nC range of 5–10. Less signal is present for the nC higher than 25, except for 8 October 2021. Winter and summer samples collected at PUY show different characteristics, with a high number of signals with a high intensity at an nC higher than 20 for winter samples and a more intense signal for an nC lower than 10 for the summer samples. Based on the same study from Kroll et al. (2011), four classes were defined according to the nC and OSC values reported in Table S3. Hydrocarbon-like organic aerosol (HOA; dark red circles) and biomass burning organic aerosol (BBOA; red circles) correspond to the primary particulate matter directly emitted into the atmosphere. Semivolatile and low-volatility oxidized organic aerosols (SV-OOA and LV-OOA; orange and yellow squares, respectively) correspond to “fresh” and “aged” secondary aerosol produced by multistep oxidation reactions. The difference between samples collected at REU and PUY is blatant: the dispersion of the formula in the OSC–nC space is similar, but the highest abundance for samples collected at REU is in the lower part of the diagram. DOM in samples collected at REU is less oxidized and comparable to HOA and BBOA, linked to primary emissions. The contribution to each class can be evaluated through the box plot shown in Fig. 2d, calculated using the seven samples from PUY and the three from REU. It shows that PUY samples have a lower fraction of HOA and a higher contribution of SV-OOA and LV-OOA than REU samples. This result is in line with those previously presented regarding OSC for CHO compounds. The lower-right part of the OSC–nC space, corresponding to compounds with an OSC below 1.5 and fewer than 10 carbon atoms, is different for PUY and REU samples. A more detailed analysis of this region of the plot shows that 120 different formula were found, mainly composed of CHNOS (80 %) and CHNO (8.4 %). All the formulas have at least one nitrogen atom. The average and ratios are 0.65 ± 0.35 and 1.89 ± 0.38, respectively. One formula occurred in all the samples, C5H7N3O3S, while two occurred in six (out of seven) samples, C8H17N3O4S and C8H17N3O5S.
3.3 The classification of molecular formulas on stoichiometric ratios – Rivas-Ubach classification
The MFs are difficult to associate with specific molecular structures, as each represents many possible isomeric arrangements, but the MFs rather allow categorizing molecules according to elemental composition, like CHO or CHNO. The elemental composition is usually represented graphically using van Krevelen diagrams ( vs. ). This graphical representation enables the study of the chemical composition of a sample, the visualization of structural classes of organic compounds (e.g. lipid, protein) (Kew et al., 2017; Kim et al., 2003), and the description of chemical reactions in terms of additions and losses in elementary compound categories (Heald et al., 2010). Nevertheless, it does not take into account the presence of heteroatoms, such as nitrogen, sulfur and phosphorus, leading to a significant overlap between the categories (Brockman et al., 2018; Rivas-Ubach et al., 2018). In our previous work (Renard et al., 2022), we used the multidimensional classification proposed by Rivas-Ubach et al. (2018) into six main categories: LipidC, PeptideC, Amino-sugarC, CarbohydrateC, NucleotideC and Oxy-aromaticC (Rivas-Ubach et al., 2018). The molecular composition of cloud water samples collected at REU and PUY was investigated using the MSCC, which is presented for sample R8 in Fig. 3a. Relative contributions in number of MFs (Fig. 3b) are slightly different from relative contributions weighted by the intensity of the mass signal (Fig. S7).
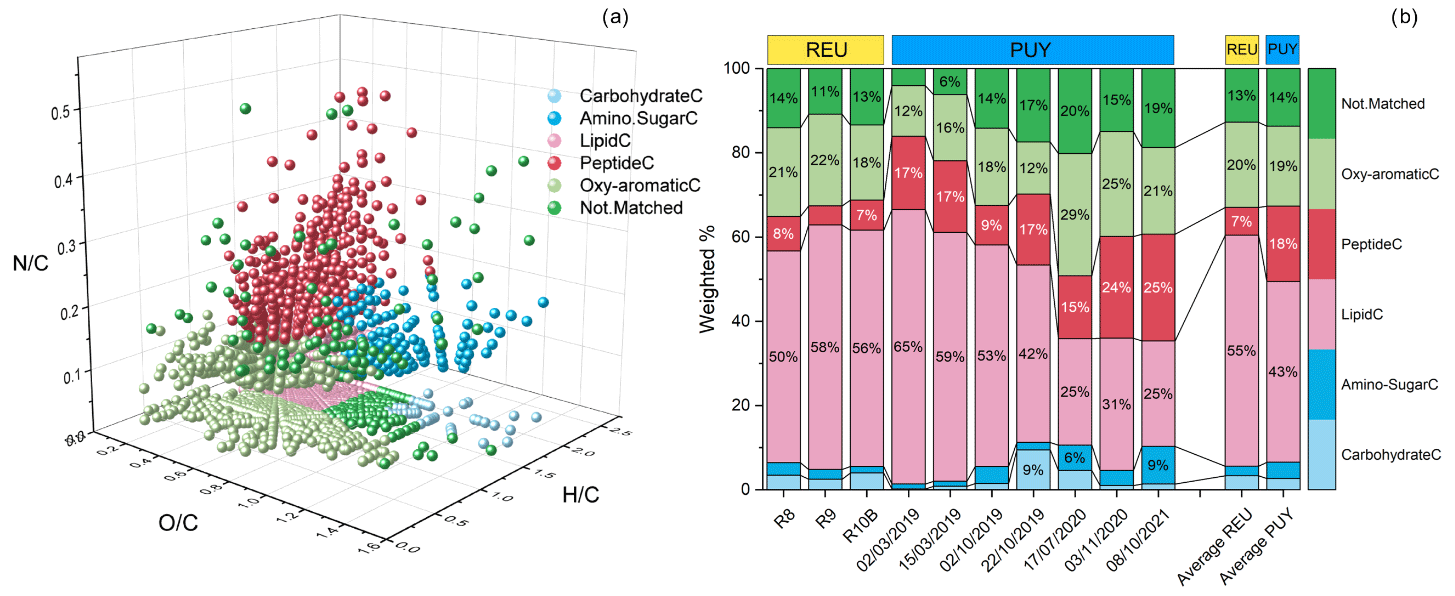
Figure 3(a) Three-dimensional representation of the Rivas-Ubach classification for sample R8. The ratio is reported on the x axis, the ratio on the y axis and the ratio on the z axis. Dots represent MFs, and the classification in the Rivas-Ubach categories is depicted with the colours reported in the legend. (b) Stacked histogram of the relative contribution (in %) weighted for the intensity of the Rivas-Ubach categories for samples collected at REU and PUY.
Regarding REU samples, the weighted proportion of the classes is homogeneous between samples, with 50 %–58 % attributed to LipidC, 18 %–22 % to Oxy-aromaticC, 4 %–8 % to PeptideC, and less than 5 % to CarbohydrateC and Amino-sugarC. Up to 10 % of the MFs were not assigned to any class (not matched), and no MF was assigned to NucleotideC (Fig. S6). In MF number percentage, LipidC accounts for 50.3 ± 5.8, Oxy-aromaticC for 24.6 ± 2.4, PeptideC for 9.9 ± 2.7, CarbohydrateC for 1.7 ± 0.2 and Amino-sugarC for 4.0 ± 1.1. MFs corresponding to lipids are generally more intense than MFs in the other categories. The same MF number distribution was observed for samples collected at PUY: 40.2 % ± 14.1 % to LipidC, 22.6 % ± 6.9 % to Oxy-aromaticC, 18.9 % ± 5.9 % to PeptideC, and less than 5 % to CarbohydrateC and Amino-sugarC. Up to 12 % of the MFs did not match to any class. The weighted values are similar, as reported in Fig. 3b. Although LipidC represents more than half of the MFs in REU and PUY samples, only four MFs of this class are common between all the samples. Interestingly, the Rivas-Ubach classification highlights the fact that samples collected at REU and PUY are similar in terms of relative distribution between classes, with the only exception being PeptideC (p<0.05).
Nevertheless, the issue about the high frequency and abundance of LipidC raises many questions, especially because Renard et al. (2022) found almost the same abundance of LipidC for clouds collected under different environmental conditions (PUY) and analysed using a different FT-ICR MS ionization source (i.e. atmospheric pressure photoionization; APPI).
LipidC contains a broad variety of organic compounds, from long-chain carboxylic acids to sterols. Intuitively, there is more chance to detect long-chain carboxylic acids than sterols in cloud water, but it is difficult to set up a more systematic approach to investigate a LipidC category only studying MFs. To discriminate lipids into categories, we used the LIPID MAPS® database. This lipid classification system comprises eight lipid categories: fatty acyls, glycerolipids, glycerophospholipids, sphingolipids, sterol lipids, prenol lipids, saccharolipids and polyketides (Liebisch et al., 2020). The category “fatty acyls” contains some subcategories, such as fatty acids and conjugates, fatty alcohols and fatty aldehydes, which can be present in cloud samples since they are produced from the atmospheric oxidation of organic matter, and oxygenated hydrocarbons, mainly linked to the oxidation of anthropogenic compounds (Wang et al., 2020). The category prenol lipids contains a subcategory, “isoprenoids”, which can be issued from oxidation of terpenes..
The MFs corresponding to the compounds listed in these subcategories were searched in the samples collected at REU and PUY. In total, 1071 compounds were selected; however, many of the selected compounds have a different structural formula but identical MF. Thus, a lower number of MFs was searched in PUY and REU samples. This research resulted in 500 MFs with at least one occurrence in PUY or REU samples: 194 MFs corresponded uniquely to fatty acids, 11 to fatty alcohols, 3 to fatty aldehydes, 3 to oxygenated hydrocarbons, 124 to prenol lipids and 165 were in common between these categories. Working with MFs largely limited this approach, since most of the MFs of fatty acids were also contained in fatty aldehydes, fatty alcohols and oxygenated hydrocarbons due to the different chemical function with the same type and number of atoms. However, most of the MFs attributed to prenol lipids were not shared with the other classes. This approach enabled calculation of fatty acyls by grouping fatty acids, alcohols, aldehydes and oxygenated hydrocarbons to contribute to PUY and REU samples from 0.6 % to 8.3 % in weight of the total detected ion intensity and constitute a significant fraction of LipidC (from 11 % to 46 % in weight). Samples collected at REU have an occurrence of MFs attributed uniquely to fatty acids (12.7 %), which are significantly higher than PUY samples (6.7 %) (p<0.05). This is probably due to the contribution of sea salt, which is rich in surface-active molecules, also called acid–soap complexes (Milsom et al., 2021). The contribution of the other categories is not significantly different between REU and PUY. Isoprenoids represent from 1.3 % to 4.0 % in weight of the total abundance. One important outcome of this study is that a significant fraction of the LipidC category (25.8 ± 10.2, in weight) is composed of fatty acids, alcohols, aldehydes, oxygenated hydrocarbons and prenol lipids.
3.4 Secondary organic aerosol tracers
An approach analogous to the one reported in Bianco et al. (2019b) was additionally used in this study to detect secondary organic aerosol (SOA) tracers, produced through volatile organic compound (VOC) oxidation. MFs and their intensity for samples collected at PUY and REU are reported in Table S4. Although the list of SOAs is not exhaustive, it includes oxidation products from isoprene (Surratt et al., 2008; Riva et al., 2016a, b), alpha and beta pinene (Surratt et al., 2008; Kourtchev et al., 2013; Kristensen et al., 2016; Finessi et al., 2014), limonene (Surratt et al., 2008; Kourtchev et al., 2014), alpha and gamma terpinene and terpinolene (Surratt et al., 2008), and beta caryophyllene (Chan et al., 2011). In addition, we searched for MFs corresponding to nitroaromatic compounds (Zhang et al., 2013) and brown carbon (Lin et al., 2018; Budisulistiorini et al., 2017). The table also reports MFs corresponding to amino acids and sugars, particularly interesting for the evaluation of the presence of biogenic DOM.
The products of isoprene ozonolysis in the presence of sulfate (compounds C5H8O7S, C8H14O10S, C10H20O10S, C5H8O5S, C5H10O5S, C5H10O6S, C8H10O4S, C6H12O7S, C9H14O6S, C9H16O7S and C10H20O9S) are present with a very low occurrence both in PUY and REU samples. Similarly, isoprene epoxydiols (IEPOX) present few occurrences, with a low signal at the two sites. C10H18O7S, C10H18O8S and C10H20O8S are present in REU and PUY samples with low intensity, except for 8 October 2021 that shows a higher intensity for these MFs. Regarding other organosulfates produced from isoprene, only few MFs were observed in all the cloud water samples (REU and PUY).
The concentration of alpha and beta pinene in cloud water is always higher than the one predicted by Henry's law (Wang et al., 2020; Dominutti et al., 2022; van Pinxteren et al., 2016). However, it was always very low in samples collected at PUY for alpha pinene (0.07–0.7 nM), while it varied over 1 order of magnitude for samples collected at REU. In particular, alpha pinene concentrations were 0.5, 71.5 and 2.0 nmol L−1, and beta pinene concentrations were below the detection limit for R8 as well as 39.9 and 1.3 nmol L−1 for R9 and R10B, respectively. This difference between REU samples can be explained analysing the back-trajectory plots of the air masses before arriving at the sampling site, as reported in Table S2. The air mass corresponding to R8 travelled at an altitude of 2.5–3.0 km a.s.l. and was surely less impacted by surface emissions than air masses corresponding to R9 and R10B, which travelled closer to the ground surface. The same trend was observed for other terpenes. Oxidation of alpha and beta pinene produces several identical MFs, corresponding to different chemical structures, which cannot be discerned by FT-ICR MS. Although different concentrations were detected in cloud water samples at REU, a similar number of MFs corresponding to organosulfates was detected in R8, R9 and R10B, with an overall low intensity, which can be explained by the proximity of the sources of emission. Alpha and beta pinene oxidation products are present in samples collected at REU and PUY during winter, while they were not found in the summer and autumn samples at PUY, with the exception of 8 October 2021. As evidenced by the back-trajectory plots, the summer and autumn samples at PUY underwent a long-range transport in the free troposphere that could be responsible for the degradation of organosulfates. The alpha pinene ozonolysis also leads to the formation of high-molecular-weight compounds such as alpha pinene dimer esters (Kristensen et al., 2016), which were detected with high signal in samples collected at PUY. Few MFs were detected in REU samples, with a low signal and comparable frequency between the three samples. Once more, the lower occurrence and the low signal of oxidation products in the samples collected at REU may be explained by the proximity of the biogenic sources, since the clouds were collected on a 10 m mast on the slope of the Maïdo, just above the canopy. The forest near the collection site was mainly composed of the conifer Cryptomeria japonica (Dominutti et al., 2022). This would also explain the higher concentration of alpha and beta pinene in comparison to the PUY samples. Kourtchev et al. (2013) identified two MFs produced by the alpha pinene oxidation in aerosol samples. C8H12O5 (2-hydroxyterpenylic acid), which is one of the first oxidation products of alpha pinene, is detected in REU samples, with a high intensity (108), but not in PUY samples, except those from 2 October 2019. In contrast, C8H12O6, 3-methyl-1,2,3-butanetricarboxylic acid (MBTCA), which is a product of the further oxidation of 2-hydroxyterpenylic acid, is not present in REU samples, confirming that the reactivity of alpha pinene in the atmosphere is still at its beginning. MBTCA is not present in PUY samples, except for those from 2 October 2019, where it is found with a high intensity.
Similar to other terpenes, limonene concentrations in cloud water have been shown to be 2–3 orders of magnitude higher than the values predicted by Henry's law constant, resulting in concentrations of 0.5, 38.5 and 2.3 ng L−1 in R8, R9 and R10B (Dominutti et al., 2022). We observed that the MF C9H14O4, identified as an oxidation product from limonene of beta caryophyllene, was present with a high intensity in samples collected at REU and PUY on 2 October 2019 (intensity of 108), with a similar intensity and trend to that of 2-hydroxyterpenylic acid. Organosulfates from limonene oxidation showed a higher occurrence in samples collected at REU than at PUY, mainly due to the higher emission of limonene in REU compared to PUY. Nevertheless, the intensity of the FT-ICR MS signal was very low, apart from the PUY sample from 8 October 2021. Oxidation products of other terpenes, such as alpha-terpinene, gamma terpinene and terpinolene, showed similar occurrence in samples collected at REU and PUY.
Similar to what is observed in PUY, samples collected at REU present a low abundance of MFs corresponding to nitroaromatic compounds and brown carbon.
3.5 Statistical analysis
The previous paragraphs highlighted the complexity of the DOM in samples collected at REU and PUY in order to highlight the differences and similarities of the samples for specific chemical parameters. However, it is difficult to find which of these parameters is the most relevant to point out the differences between cloud samples collected at the two sampling sites. Although some contrasting characteristics can be found through the description of the molecular composition of clouds, we cannot conclude that cloud water DOM is different. To go beyond these limits, we used statistical tools to evaluate the differences between cloud water samples. We performed a principal component analysis (PCA) and agglomerative hierarchical clustering (AHC) to explore the similarities and hidden patterns among samples. The matrix is composed of 9251 scores (molecular formulas) and 10 loadings (three samples from REU and seven for PUY). Unfortunately, the small dataset does not help to find groups of MFs typical of PUY or REU; a larger number of samples is needed for this analysis.
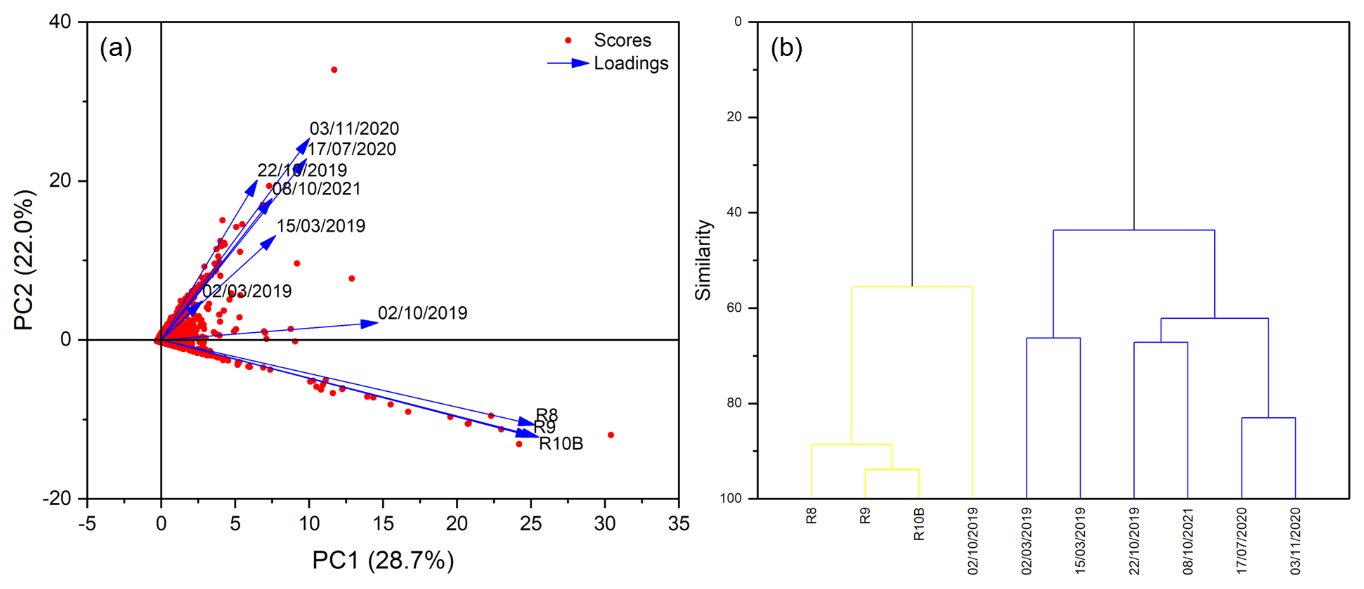
Figure 4(a) Bi-plot of the principal component analysis (PCA) performed on samples collected at PUY and REU. Loadings are the samples, while scores are the molecular formulas represented by red dots. (b) Dendrogram obtained for the agglomerative hierarchical clustering (AHC) of the same matrix used in the PCA.
We chose the representation of the results in a 2-D plot, although two principal components (PCs) are not enough to explain more than 48.7 % of the variance of the dataset. In fact, to have a complete description of the variance (> 85 %), we need to extract at least six PCs (86.2 %). The table of loadings, in Table S5, shows the correlation between the first six PCs and the samples (loadings). Samples collected at REU are mainly correlated with PC1, with values higher than 0.5, uncorrelated with PC2 (−0.2) and mostly not correlated with the other PCs. Samples collected at PUY are more heterogeneous: all the samples, except those from 2 October 2019 and 2 March 2019, are correlated with PC2, with values higher than 0.25, but are also correlated significantly with the other PCs. PC3 could be identified as a “winter PC”, since it is correlated with samples from 2 and 15 March 2019 and with no others, while it is more difficult to discriminate between summer and autumn samples collected at PUY. However, the colour code of the table highlights the fact that clouds collected at REU are statistically different than those collected at PUY, and it indicates a similarity of the DOM of samples collected at PUY that goes beyond the air mass origin and the seasonality. Figure S8 shows the contribution of the different PCs to the representation of each sample: the difference between REU samples, samples collected at PUY in winter and other samples collected at PUY are clearly visible.
The bi-plot presented in Fig. 4a shows a good correlation between the samples collected at the same location, confirming that the DOM for samples collected at REU is different from the DOM in cloud water collected at PUY. The sample corresponding to 2 October 2019 is not well represented in the 2-D plot and would benefit from a five-dimensional representation, since it is more represented by the fourth and fifth PCs (0.64 and 0.61, respectively, for PC4 and PC5).
The AHC, reported in Fig. 4b, confirms the PCA results. Two classes can be clearly distinguished: samples collected at REU and samples collected at PUY, with the exception of 2 October 2019, which is more similar to samples collected at REU. In samples collected at REU, R9 and R10B have a similar composition, slightly different from R8. This could be due, as discussed in Sect. 3.3, to the trajectory of the air masses before collection, which are quite similar for R9 and R10B and different for R8, with an intrusion of air from the upper troposphere. They are largely different from the sample collected on 2 October 2019, although they are part of the same cluster. The sample collected at PUY on 2 October 2019 is characterized by an air mass coming from the north and mainly travelling in the boundary layer. Regarding samples collected at PUY, there is a clear separation between winter samples, collected in March, and summer–autumn samples.
In this study, we present for the first time the molecular characterization of three cloud samples collected in the Southern Hemisphere during the BIO-MAÏDO field campaign, at Réunion Island (REU; Indian Ocean). Cloud water samples were pre-concentrated by solid-phase extraction and analysed by FT-ICR MS in electrospray negative ionization mode. Mass spectra were treated with the Bruker data analysis and the assignment was performed with MFAssignR software. The composition of samples collected at Réunion Island was compared to those of samples collected at Puy de Dôme (PUY) in the Massif Central region of France. The same methodology was used for sampling, analysis and data treatment (assignment) in order to obtain a unique database of highly comparable samples. The average elemental composition is similar for the dataset of the two samples; nevertheless, the REU samples present a higher occurrence of CHOS and a lower occurrence of CHNOS compared to PUY samples. This may be due to the marine emission around the island. Other differences, mainly related to cloud processing, are evidenced by the carbon oxidation state (OSC). This parameter shows similar values for samples collected at REU and PUY during autumn, but the values for winter and summer samples are significantly different. We hypothesized that, for the autumn samples, strong emissions are rapidly processed at REU due to the high temperature, and aged air masses are collected at PUY, leading to similar values of average OSC but produced by different causes. The Rivas-Ubach classification shows that 50 % of the dissolved organic matter in cloud water accounts for reduced molecules, grouped into the LipidC class. These compounds are probably linked to emissions from vegetation and urban areas. We calculated that fatty acyls constitute a significant fraction of LipidC (from 11 % to 46 % in weight). Samples collected at REU have an occurrence of molecular formulas attributed uniquely to fatty acids (12.7 %) significantly higher than PUY samples (6.7 %). This is probably due to the contribution of sea salt, which is rich in surface-active molecules, also called acid–soap complexes. The contribution of the other categories is not significantly different between REU and PUY. In weight of the total abundance, 1.3 % to 4.0 % is represented by isoprenoids, which contain secondary organic aerosols (SOAs) and aqueous SOA derivatives. These formulas were identified in the molecular formula lists of each sample. The statistical tools of the principal component analysis and agglomerative hierarchical clustering were used to confirm the different composition of samples collected at REU and PUY. The statistical study evidenced that R8 has a slightly different composition from R9 and R10B, probably due to the trajectory of the air masses before collection, with an intrusion of air from the upper troposphere. For samples collected at PUY, there is a clear separation between the winter and summer–autumn samples, with the exclusion of the sample collected at PUY on 2 October 2019. It is characterized by an air mass coming from the north and mainly travelling in the boundary layer, making it more similar to those collected at REU and charged with fresh emissions. FT-ICR MS is a powerful tool to investigate cloud water composition; in contrast to the methodology previously used for cloud water study, it provides a global detailed overview of the DOM. Combined with classification methodologies, such as the Rivas-Ubach classification (Renard et al., 2022), it may highlight which families of compounds are preferentially transformed.
Data are available in the Supplement, but further information can be obtained on request.
The supplement related to this article is available online at: https://doi.org/10.5194/acp-24-5567-2024-supplement.
ML and PT, the principal investigators of the BIO-MAÏDO project, designed the field campaign and contributed to the scientific discussion. LD, MR, JMP, MV and FB collected the samples at Réunion Island and at Puy de Dôme. LP, HL, IS, EN, MH and AB performed the analysis by FT-ICR MS. PD and AB did the physicochemical characterization of the samples. LP, AB and LD treated and analysed the data. LP, AB and LD wrote the paper. All the authors reviewed the paper and approved the final version.
The contact author has declared that none of the authors has any competing interests.
Publisher's note: Copernicus Publications remains neutral with regard to jurisdictional claims made in the text, published maps, institutional affiliations, or any other geographical representation in this paper. While Copernicus Publications makes every effort to include appropriate place names, the final responsibility lies with the authors.
Access to the CNRS research infrastructure Infranalytics (FR2054) is gratefully acknowledged. The authors gratefully acknowledge the team working on the BIO-MAÏDO field campaign. The authors also are also grateful for the technical and logistical support provided by the Observatoire des Sciences de l'Univers de la Réunion and the Laboratoire de l'Atmosphère et des Cyclones. ACTRIS France is also acknowledged for facilitating the access to national facilities, such as the Maïdo observatory.
This work was funded by the French National Research Agency (ANR; grant no. ANR18-CE0-0013-01), which also performed in the framework of the CAP20-25 Clermont Auvergne Project. The “Observatoire de la Physique du Globe de Clermont-Ferrand” and the instrumented site Cezeaux-OPME-Puy de Dôme (COPDD) funded the sampling and physicochemical characterization of samples collected at the Puy de Dôme observatory. CEA (contract no. CEA CAJ_18-100/C34067 – CNRS 217485) funded the PhD contract of Lucas Pailler.
This paper was edited by Markus Ammann and reviewed by two anonymous referees.
Baray, J.-L., Courcoux, Y., Keckhut, P., Portafaix, T., Tulet, P., Cammas, J.-P., Hauchecorne, A., Godin Beekmann, S., De Mazière, M., Hermans, C., Desmet, F., Sellegri, K., Colomb, A., Ramonet, M., Sciare, J., Vuillemin, C., Hoareau, C., Dionisi, D., Duflot, V., Vérèmes, H., Porteneuve, J., Gabarrot, F., Gaudo, T., Metzger, J.-M., Payen, G., Leclair de Bellevue, J., Barthe, C., Posny, F., Ricaud, P., Abchiche, A., and Delmas, R.: Maïdo observatory: a new high-altitude station facility at Reunion Island (21° S, 55° E) for long-term atmospheric remote sensing and in situ measurements, Atmos. Meas. Tech., 6, 2865–2877, https://doi.org/10.5194/amt-6-2865-2013, 2013.
Baray, J.-L., Deguillaume, L., Colomb, A., Sellegri, K., Freney, E., Rose, C., Van Baelen, J., Pichon, J.-M., Picard, D., Fréville, P., Bouvier, L., Ribeiro, M., Amato, P., Banson, S., Bianco, A., Borbon, A., Bourcier, L., Bras, Y., Brigante, M., Cacault, P., Chauvigné, A., Charbouillot, T., Chaumerliac, N., Delort, A.-M., Delmotte, M., Dupuy, R., Farah, A., Febvre, G., Flossmann, A., Gourbeyre, C., Hervier, C., Hervo, M., Huret, N., Joly, M., Kazan, V., Lopez, M., Mailhot, G., Marinoni, A., Masson, O., Montoux, N., Parazols, M., Peyrin, F., Pointin, Y., Ramonet, M., Rocco, M., Sancelme, M., Sauvage, S., Schmidt, M., Tison, E., Vaïtilingom, M., Villani, P., Wang, M., Yver-Kwok, C., and Laj, P.: Cézeaux-Aulnat-Opme-Puy De Dôme: a multi-site for the long-term survey of the tropospheric composition and climate change, Atmos. Meas. Tech., 13, 3413–3445, https://doi.org/10.5194/amt-13-3413-2020, 2020.
Bianco, A., Passananti, M., Perroux, H., Voyard, G., Mouchel-Vallon, C., Chaumerliac, N., Mailhot, G., Deguillaume, L., and Brigante, M.: A better understanding of hydroxyl radical photochemical sources in cloud waters collected at the puy de Dôme station – experimental versus modelled formation rates, Atmos. Chem. Phys., 15, 9191–9202, https://doi.org/10.5194/acp-15-9191-2015, 2015.
Bianco, A., Deguillaume, L., Vaïtilingom, M., Nicol, E., Baray, J.-L., Chaumerliac, N., and Bridoux, M. C.: Molecular Characterization of Cloud Water Samples Collected at the puy de Dôme (France) by Fourier Transform Ion Cyclotron Resonance Mass Spectrometry, Environ. Sci. Technol., 52, 10275–10285, https://doi.org/10.1021/acs.est.8b01964, 2018.
Bianco, A., Deguillaume, L., Chaumerliac, N., Vaïtilingom, M., Wang, M., Delort, A.-M., and Bridoux, M. C.: Effect of endogenous microbiota on the molecular composition of cloud water: a study by Fourier-transform ion cyclotron resonance mass spectrometry (FT-ICR MS), Sci. Rep., 9, 7663, https://doi.org/10.1038/s41598-019-44149-8, 2019a.
Bianco, A., Riva, M., Baray, J.-L., Ribeiro, M., Chaumerliac, N., George, C., Bridoux, M., and Deguillaume, L.: Chemical Characterization of Cloudwater Collected at Puy de Dôme by FT-ICR MS Reveals the Presence of SOA Components, ACS Earth Space Chem., 3, 2076–2087, https://doi.org/10.1021/acsearthspacechem.9b00153, 2019b.
Brockman, S. A., Roden, E. V., and Hegeman, A. D.: Van Krevelen diagram visualization of high resolution-mass spectrometry metabolomics data with OpenVanKrevelen, Metabolomics, 14, 48, https://doi.org/10.1007/s11306-018-1343-y, 2018.
Budisulistiorini, S. H., Riva, M., Williams, M., Chen, J., Itoh, M., Surratt, J. D., and Kuwata, M.: Light-Absorbing Brown Carbon Aerosol Constituents from Combustion of Indonesian Peat and Biomass, Environ. Sci. Technol., 51, 4415–4423, https://doi.org/10.1021/acs.est.7b00397, 2017.
Chan, M. N., Surratt, J. D., Chan, A. W. H., Schilling, K., Offenberg, J. H., Lewandowski, M., Edney, E. O., Kleindienst, T. E., Jaoui, M., Edgerton, E. S., Tanner, R. L., Shaw, S. L., Zheng, M., Knipping, E. M., and Seinfeld, J. H.: Influence of aerosol acidity on the chemical composition of secondary organic aerosol from β-caryophyllene, Atmos. Chem. Phys., 11, 1735–1751, https://doi.org/10.5194/acp-11-1735-2011, 2011.
Cook, R. D., Lin, Y.-H., Peng, Z., Boone, E., Chu, R. K., Dukett, J. E., Gunsch, M. J., Zhang, W., Tolic, N., Laskin, A., and Pratt, K. A.: Biogenic, urban, and wildfire influences on the molecular composition of dissolved organic compounds in cloud water, Atmos. Chem. Phys., 17, 15167–15180, https://doi.org/10.5194/acp-17-15167-2017, 2017.
Crumeyrolle, S., Gomes, L., Tulet, P., Matsuki, A., Schwarzenboeck, A., and Crahan, K.: Increase of the aerosol hygroscopicity by cloud processing in a mesoscale convective system: a case study from the AMMA campaign, Atmos. Chem. Phys., 8, 6907–6924, https://doi.org/10.5194/acp-8-6907-2008, 2008.
Deguillaume, L. and Bianco, A.: PuyCloud Database: Physico-chemical and microbiological characterisation of cloud water samples, https://doi.org/10.25519/PUYCLOUD-DATABASE-2017, 2017.
Deguillaume, L., Charbouillot, T., Joly, M., Vaïtilingom, M., Parazols, M., Marinoni, A., Amato, P., Delort, A.-M., Vinatier, V., Flossmann, A., Chaumerliac, N., Pichon, J. M., Houdier, S., Laj, P., Sellegri, K., Colomb, A., Brigante, M., and Mailhot, G.: Classification of clouds sampled at the puy de Dôme (France) based on 10 yr of monitoring of their physicochemical properties, Atmos. Chem. Phys., 14, 1485–1506, https://doi.org/10.5194/acp-14-1485-2014, 2014.
Dominutti, P. A., Renard, P., Vaïtilingom, M., Bianco, A., Baray, J.-L., Borbon, A., Bourianne, T., Burnet, F., Colomb, A., Delort, A.-M., Duflot, V., Houdier, S., Jaffrezo, J.-L., Joly, M., Leremboure, M., Metzger, J.-M., Pichon, J.-M., Ribeiro, M., Rocco, M., Tulet, P., Vella, A., Leriche, M., and Deguillaume, L.: Insights into tropical cloud chemistry in Réunion (Indian Ocean): results from the BIO-MAÏDO campaign, Atmos. Chem. Phys., 22, 505–533, https://doi.org/10.5194/acp-22-505-2022, 2022.
Duflot, V., Tulet, P., Flores, O., Barthe, C., Colomb, A., Deguillaume, L., Vaïtilingom, M., Perring, A., Huffman, A., Hernandez, M. T., Sellegri, K., Robinson, E., O'Connor, D. J., Gomez, O. M., Burnet, F., Bourrianne, T., Strasberg, D., Rocco, M., Bertram, A. K., Chazette, P., Totems, J., Fournel, J., Stamenoff, P., Metzger, J.-M., Chabasset, M., Rousseau, C., Bourrianne, E., Sancelme, M., Delort, A.-M., Wegener, R. E., Chou, C., and Elizondo, P.: Preliminary results from the FARCE 2015 campaign: multidisciplinary study of the forest–gas–aerosol–cloud system on the tropical island of La Réunion, Atmos. Chem. Phys., 19, 10591–10618, https://doi.org/10.5194/acp-19-10591-2019, 2019.
Dzepina, K., Mazzoleni, C., Fialho, P., China, S., Zhang, B., Owen, R. C., Helmig, D., Hueber, J., Kumar, S., Perlinger, J. A., Kramer, L. J., Dziobak, M. P., Ampadu, M. T., Olsen, S., Wuebbles, D. J., and Mazzoleni, L. R.: Molecular characterization of free tropospheric aerosol collected at the Pico Mountain Observatory: a case study with a long-range transported biomass burning plume, Atmos. Chem. Phys., 15, 5047–5068, https://doi.org/10.5194/acp-15-5047-2015, 2015.
El Gdachi, S., Tulet, P., Rechou, A., Burnet, F., and Leriche, M.: Investigating Cloud Microphysical Properties: A Comprehensive Study Using High-Resolution Numerical Simulations and Observations in the Indian Ocean Region, EGU General Assembly 2024, Vienna, Austria, 14–19 April 2024, EGU24-7283, https://doi.org/10.5194/egusphere-egu24-7283, 2024.
Ervens, B., Wang, Y., Eagar, J., Leaitch, W. R., Macdonald, A. M., Valsaraj, K. T., and Herckes, P.: Dissolved organic carbon (DOC) and select aldehydes in cloud and fog water: the role of the aqueous phase in impacting trace gas budgets, Atmos. Chem. Phys., 13, 5117–5135, https://doi.org/10.5194/acp-13-5117-2013, 2013.
Finessi, E., Lidster, R. T., Whiting, F., Elliott, T., Alfarra, M. R., McFiggans, G. B., and Hamilton, J. F.: Improving the Quantification of Secondary Organic Aerosol Using a Microflow Reactor Coupled to HPLC-MS and NMR to Manufacture Ad Hoc Calibration Standards, Anal. Chem., 86, 11238–11245, https://doi.org/10.1021/ac5028512, 2014.
Giannopoulos, K., Benettoni, P., Holbrook, T. R., Reemtsma, T., Wagner, S., and Lechtenfeld, O. J.: Direct analysis of fulvic acids adsorbed onto capped gold nanoparticles by laser desorption ionization Fourier-transform ion cyclotron resonance mass spectrometry, Environ. Sci.-Nano, 8, 2336–2346, https://doi.org/10.1039/D0EN01253J, 2021.
Gioda, A., Reyes-Rodríguez, G. J., Santos-Figueroa, G., Collett, J. L., Decesari, S., Ramos, M. D. C. K. V., Bezerra Netto, H. J. C., De Aquino Neto, F. R., and Mayol-Bracero, O. L.: Speciation of water-soluble inorganic, organic, and total nitrogen in a background marine environment: Cloud water, rainwater, and aerosol particles, J. Geophys. Res., 116, D05203, https://doi.org/10.1029/2010JD015010, 2011.
Gonser, S. G., Klemm, O., Griessbaum, F., Chang, S.-C., Chu, H.-S., and Hsia, Y.-J.: The Relation Between Humidity and Liquid Water Content in Fog: An Experimental Approach, Pure Appl. Geophys., 169, 821–833, https://doi.org/10.1007/s00024-011-0270-x, 2012.
Gurganus, S. C., Wozniak, A. S., and Hatcher, P. G.: Molecular characteristics of the water soluble organic matter in size-fractionated aerosols collected over the North Atlantic Ocean, Mar. Chem., 170, 37–48, https://doi.org/10.1016/j.marchem.2015.01.007, 2015.
Heald, C., Kroll, J., Jimenez, J., Docherty, K., DeCarlo, P., Aiken, A., Chen, Q., Martin, S., Farmer, D., and Artaxo, P.: A simplified description of the evolution of organic aerosol composition in the atmosphere, Geophys. Res. Lett., 37, L08803, https://doi.org/10.1029/2010GL042737, 2010.
Herckes, P., Valsaraj, K. T., and Collett, J. L.: A review of observations of organic matter in fogs and clouds: Origin, processing and fate, Atmos. Res., 132–133, 434–449, https://doi.org/10.1016/j.atmosres.2013.06.005, 2013.
Herrmann, H., Schaefer, T., Tilgner, A., Styler, S. A., Weller, C., Teich, M., and Otto, T.: Tropospheric Aqueous-Phase Chemistry: Kinetics, Mechanisms, and Its Coupling to a Changing Gas Phase, Chem. Rev., 115, 4259–4334, https://doi.org/10.1021/cr500447k, 2015.
Isokääntä, S., Kim, P., Mikkonen, S., Kühn, T., Kokkola, H., Yli-Juuti, T., Heikkinen, L., Luoma, K., Petäjä, T., Kipling, Z., Partridge, D., and Virtanen, A.: The effect of clouds and precipitation on the aerosol concentrations and composition in a boreal forest environment, Atmos. Chem. Phys., 22, 11823–11843, https://doi.org/10.5194/acp-22-11823-2022, 2022.
Kew, W., Blackburn, J. W. T., Clarke, D. J., and Uhrín, D.: Interactive van Krevelen diagrams – Advanced visualisation of mass spectrometry data of complex mixtures: Interactive van Krevelen Diagrams, Rapid Commun. Mass Sp., 31, 658–662, https://doi.org/10.1002/rcm.7823, 2017.
Kim, S., Kramer, R. W., and Hatcher, P. G.: Graphical Method for Analysis of Ultrahigh-Resolution Broadband Mass Spectra of Natural Organic Matter, the Van Krevelen Diagram, Anal. Chem., 75, 5336–5344, https://doi.org/10.1021/ac034415p, 2003.
Koch, B. P. and Dittmar, T.: From mass to structure: an aromaticity index for high-resolution mass data of natural organic matter, Rapid Commun. Mass Sp., 20, 926–932, https://doi.org/10.1002/rcm.2386, 2006.
Koch, B. P., Witt, M., Engbrodt, R., Dittmar, T., and Kattner, G.: Molecular formulae of marine and terrigenous dissolved organic matter detected by electrospray ionization Fourier transform ion cyclotron resonance mass spectrometry, Geochim. Cosmochim. Ac., 69, 3299–3308, https://doi.org/10.1016/j.gca.2005.02.027, 2005.
Kourtchev, I., Fuller, S., Aalto, J., Ruuskanen, T. M., McLeod, M. W., Maenhaut, W., Jones, R., Kulmala, M., and Kalberer, M.: Molecular Composition of Boreal Forest Aerosol from Hyytiälä, Finland, Using Ultrahigh Resolution Mass Spectrometry, Environ. Sci. Technol., 47, 4069–4079, https://doi.org/10.1021/es3051636, 2013.
Kourtchev, I., Fuller, S. J., Giorio, C., Healy, R. M., Wilson, E., O'Connor, I., Wenger, J. C., McLeod, M., Aalto, J., Ruuskanen, T. M., Maenhaut, W., Jones, R., Venables, D. S., Sodeau, J. R., Kulmala, M., and Kalberer, M.: Molecular composition of biogenic secondary organic aerosols using ultrahigh-resolution mass spectrometry: comparing laboratory and field studies, Atmos. Chem. Phys., 14, 2155–2167, https://doi.org/10.5194/acp-14-2155-2014, 2014.
Kristensen, K., Watne, Å. K., Hammes, J., Lutz, A., Petäjä, T., Hallquist, M., Bilde, M., and Glasius, M.: High-Molecular Weight Dimer Esters Are Major Products in Aerosols from α-Pinene Ozonolysis and the Boreal Forest, Environ. Sci. Tech. Let., 3, 280–285, https://doi.org/10.1021/acs.estlett.6b00152, 2016.
Kroll, J. H., Donahue, N. M., Jimenez, J. L., Kessler, S. H., Canagaratna, M. R., Wilson, K. R., Altieri, K. E., Mazzoleni, L. R., Wozniak, A. S., Bluhm, H., Mysak, E. R., Smith, J. D., Kolb, C. E., and Worsnop, D. R.: Carbon oxidation state as a metric for describing the chemistry of atmospheric organic aerosol, Nat. Chem., 3, 133–139, https://doi.org/10.1038/nchem.948, 2011.
Leriche, M., Tulet, P., Deguillaume, L., Burnet, F., Colomb, A., Borbon, A., Jambert, C., Duflot, V., Houdier, S., Jaffrezo, J.-L., Vaïtilingom, M., Dominutti, P., Rocco, M., Mouchel-Vallon, C., El Gdachi, S., Brissy, M., Fathalli, M., Maury, N., Verreyken, B., Amelynck, C., Schoon, N., Gros, V., Pichon, J.-M., Ribeiro, M., Pique, E., Leclerc, E., Bourrianne, T., Roy, A., Moulin, E., Barrie, J., Metzger, J.-M., Péris, G., Guadagno, C., Bhugwant, C., Tibere, J.-M., Tournigand, A., Freney, E., Sellegri, K., Delort, A.-M., Amato, P., Joly, M., Baray, J.-L., Renard, P., Bianco, A., Réchou, A., and Payen, G.: Measurement Report: Bio-physicochemistry of tropical clouds at Maïdo (Réunion Island, Indian Ocean): overview of results from the BIO-MAÏDO campaign, EGUsphere [preprint], https://doi.org/10.5194/egusphere-2023-1362, 2023.
Liebisch, G., Fahy, E., Aoki, J., Dennis, E. A., Durand, T., Ejsing, C. S., Fedorova, M., Feussner, I., Griffiths, W. J., Köfeler, H., Merrill, A. H., Murphy, R. C., O'Donnell, V. B., Oskolkova, O., Subramaniam, S., Wakelam, M. J. O., and Spener, F.: Update on LIPID MAPS classification, nomenclature, and shorthand notation for MS-derived lipid structures, J. Lipid Res., 61, 1539–1555, https://doi.org/10.1194/jlr.S120001025, 2020.
Lin, P., Fleming, L. T., Nizkorodov, S. A., Laskin, J., and Laskin, A.: Comprehensive Molecular Characterization of Atmospheric Brown Carbon by High Resolution Mass Spectrometry with Electrospray and Atmospheric Pressure Photoionization, Anal. Chem., 90, 12493–12502, https://doi.org/10.1021/acs.analchem.8b02177, 2018.
Mann, B. F., Chen, H., Herndon, E. M., Chu, R. K., Tolic, N., Portier, E. F., Roy Chowdhury, T., Robinson, E. W., Callister, S. J., Wullschleger, S. D., Graham, D. E., Liang, L., and Gu, B.: Indexing Permafrost Soil Organic Matter Degradation Using High-Resolution Mass Spectrometry, PLoS ONE, 10, e0130557, https://doi.org/10.1371/journal.pone.0130557, 2015.
Mazoyer, M., Burnet, F., and Denjean, C.: Experimental study on the evolution of droplet size distribution during the fog life cycle, Atmos. Chem. Phys., 22, 11305–11321, https://doi.org/10.5194/acp-22-11305-2022, 2022.
Mazzoleni, L. R., Ehrmann, B. M., Shen, X., Marshall, A. G., and Collett, J. L.: Water-Soluble Atmospheric Organic Matter in Fog: Exact Masses and Chemical Formula Identification by Ultrahigh-Resolution Fourier Transform Ion Cyclotron Resonance Mass Spectrometry, Environ. Sci. Technol., 44, 3690–3697, https://doi.org/10.1021/es903409k, 2010.
Melendez-Perez, J. J., Martínez-Mejia, M. J., and Eberlin, M. N.: A reformulated aromaticity index equation under consideration for non-aromatic and non-condensed aromatic cyclic carbonyl compounds, Org. Geochem., 95, 29–33, https://doi.org/10.1016/j.orggeochem.2016.02.002, 2016.
Milsom, A., Squires, A. M., Boswell, J. A., Terrill, N. J., Ward, A. D., and Pfrang, C.: An organic crystalline state in ageing atmospheric aerosol proxies: spatially resolved structural changes in levitated fatty acid particles, Atmos. Chem. Phys., 21, 15003–15021, https://doi.org/10.5194/acp-21-15003-2021, 2021.
Pailler, L., Renard, P., Nicol, E., Deguillaume, L., and Bianco, A.: How Well Do We Handle the Sample Preparation, FT-ICR Mass Spectrometry Analysis, and Data Treatment of Atmospheric Waters?, Molecules, 27, 7796, https://doi.org/10.3390/molecules27227796, 2022.
Renard, P., Bianco, A., Baray, J.-L., Bridoux, M., Delort, A.-M., and Deguillaume, L.: Classification of Clouds Sampled at the Puy de Dôme Station (France) Based on Chemical Measurements and Air Mass History Matrices, Atmosphere, 11, 732, https://doi.org/10.3390/atmos11070732, 2020.
Renard, P., Bianco, A., Jänis, J., Kekäläinen, T., Bridoux, M., and Deguillaume, L.: Puy de Dôme Station (France): A stoichiometric approach to compound classification in clouds, J. Geophys. Res.-Atmos., 127, 16, https://doi.org/10.1029/2022JD036635, 2022.
Riva, M., Budisulistiorini, S. H., Chen, Y., Zhang, Z., D'Ambro, E. L., Zhang, X., Gold, A., Turpin, B. J., Thornton, J. A., Canagaratna, M. R., and Surratt, J. D.: Chemical Characterization of Secondary Organic Aerosol from Oxidation of Isoprene Hydroxyhydroperoxides, Environ. Sci. Technol., 50, 9889–9899, https://doi.org/10.1021/acs.est.6b02511, 2016a.
Riva, M., Budisulistiorini, S. H., Zhang, Z., Gold, A., and Surratt, J. D.: Chemical characterization of secondary organic aerosol constituents from isoprene ozonolysis in the presence of acidic aerosol, Atmos. Environ., 130, 5–13, https://doi.org/10.1016/j.atmosenv.2015.06.027, 2016b.
Rivas-Ubach, A., Liu, Y., Bianchi, T. S., Tolić, N., Jansson, C., and Paša-Tolić, L.: Moving beyond the van Krevelen Diagram: A New Stoichiometric Approach for Compound Classification in Organisms, Anal. Chem., 90, 6152–6160, https://doi.org/10.1021/acs.analchem.8b00529, 2018.
Rocco, M., Baray, J.-L., Colomb, A., Borbon, A., Dominutti, P., Tulet, P., Amelynck, C., Schoon, N., Verreyken, B., Duflot, V., Gros, V., Sarda-Estève, R., Péris, G., Guadagno, C., and Leriche, M.: High Resolution Dynamical Analysis of Volatile Organic Compounds (VOC) Measurements During the BIO-MAÏDO Field Campaign (Réunion Island, Indian Ocean), J. Geophys. Res.-Atmos., 127, e2021JD035570, https://doi.org/10.1029/2021JD035570, 2022.
Schum, S. K., Brown, L. E., and Mazzoleni, L. R.: MFAssignR: Molecular formula assignment software for ultrahigh resolution mass spectrometry analysis of environmental complex mixtures, Environ. Res., 191, 110114, https://doi.org/10.1016/j.envres.2020.110114, 2020.
Sun, W., Fu, Y., Zhang, G., Yang, Y., Jiang, F., Lian, X., Jiang, B., Liao, Y., Bi, X., Chen, D., Chen, J., Wang, X., Ou, J., Peng, P., and Sheng, G.: Measurement report: Molecular characteristics of cloud water in southern China and insights into aqueous-phase processes from Fourier transform ion cyclotron resonance mass spectrometry, Atmos. Chem. Phys., 21, 16631–16644, https://doi.org/10.5194/acp-21-16631-2021, 2021.
Surratt, J. D., Gómez-González, Y., Chan, A. W. H., Vermeylen, R., Shahgholi, M., Kleindienst, T. E., Edney, E. O., Offenberg, J. H., Lewandowski, M., Jaoui, M., Maenhaut, W., Claeys, M., Flagan, R. C., and Seinfeld, J. H.: Organosulfate Formation in Biogenic Secondary Organic Aerosol, J. Phys. Chem. A, 112, 8345–8378, https://doi.org/10.1021/jp802310p, 2008.
Triesch, N., van Pinxteren, M., Engel, A., and Herrmann, H.: Concerted measurements of free amino acids at the Cabo Verde islands: high enrichments in submicron sea spray aerosol particles and cloud droplets, Atmos. Chem. Phys., 21, 163–181, https://doi.org/10.5194/acp-21-163-2021, 2021.
Vaïtilingom, M., Bernard, C., Berthod, C., Ribeiro, M., Bianco, A., and Deguillaume, L.: BOOGIE: A new collector for the analysis of cloud Biological and chemical content and processes: Organics, Oxidants, soluble Gases, inorganic Ions and metal Elements, in preparation, 2024.
van Pinxteren, D., Fomba, K. W., Mertes, S., Müller, K., Spindler, G., Schneider, J., Lee, T., Collett, J. L., and Herrmann, H.: Cloud water composition during HCCT-2010: Scavenging efficiencies, solute concentrations, and droplet size dependence of inorganic ions and dissolved organic carbon, Atmos. Chem. Phys., 16, 3185–3205, https://doi.org/10.5194/acp-16-3185-2016, 2016.
Wang, M., Perroux, H., Fleuret, J., Bianco, A., Bouvier, L., Colomb, A., Borbon, A., and Deguillaume, L.: Anthropogenic and biogenic hydrophobic VOCs detected in clouds at the puy de Dôme station using Stir Bar Sorptive Extraction: Deviation from the Henry's law prediction, Atmos. Res., 237, 104844, https://doi.org/10.1016/j.atmosres.2020.104844, 2020.
Wang, Y., Zhang, Y., Li, W., Wu, G., Qi, Y., Li, S., Zhu, W., Yu, J. Z., Yu, X., Zhang, H.-H., Sun, J., Wang, W., Sheng, L., Yao, X., Gao, H., Huang, C., Ma, Y., and Zhou, Y.: Important Roles and Formation of Atmospheric Organosulfates in Marine Organic Aerosols: Influence of Phytoplankton Emissions and Anthropogenic Pollutants, Environ. Sci. Technol., 57, 10284–10294, https://doi.org/10.1021/acs.est.3c01422, 2023.
Wozniak, A. S., Bauer, J. E., Sleighter, R. L., Dickhut, R. M., and Hatcher, P. G.: Technical Note: Molecular characterization of aerosol-derived water soluble organic carbon using ultrahigh resolution electrospray ionization Fourier transform ion cyclotron resonance mass spectrometry, Atmos. Chem. Phys., 8, 5099–5111, https://doi.org/10.5194/acp-8-5099-2008, 2008.
Zhang, X., Lin, Y.-H., Surratt, J. D., and Weber, R. J.: Sources, Composition and Absorption Ångström Exponent of Light-absorbing Organic Components in Aerosol Extracts from the Los Angeles Basin, Environ. Sci. Technol., 47, 3685–3693, https://doi.org/10.1021/es305047b, 2013.
Zhao, W., Fu, P., Yue, S., Li, L., Xie, Q., Zhu, C., Wei, L., Ren, H., Li, P., Li, W., Sun, Y., Wang, Z., Kawamura, K., and Chen, J.: Excitation-emission matrix fluorescence, molecular characterization and compound-specific stable carbon isotopic composition of dissolved organic matter in cloud water over Mt. Tai, Atmos. Environ., 213, 608–619, https://doi.org/10.1016/j.atmosenv.2019.06.034, 2019.
Zhao, Y., Hallar, A. G., and Mazzoleni, L. R.: Atmospheric organic matter in clouds: exact masses and molecular formula identification using ultrahigh-resolution FT-ICR mass spectrometry, Atmos. Chem. Phys., 13, 12343–12362, https://doi.org/10.5194/acp-13-12343-2013, 2013.