the Creative Commons Attribution 4.0 License.
the Creative Commons Attribution 4.0 License.
The role of ascent timescales for warm conveyor belt (WCB) moisture transport into the upper troposphere and lower stratosphere (UTLS)
Cornelis Schwenk
Annette Miltenberger
Warm conveyor belts (WCBs) are coherent ascending airstreams in extratropical cyclones. They are a major source of moisture for the extratropical upper troposphere and lower stratosphere (UTLS), where moisture acts as a potent greenhouse gas and WCB-associated cirrus clouds contribute to cloud radiative forcing. However, the processes controlling WCB moisture transport and cloud properties are poorly characterised. Furthermore, recent studies have revealed (embedded) convection as a ubiquitous feature of WCBs, highlighting the importance of understanding their updraught and microphysical structure. We present a Lagrangian investigation of WCB moisture transport for a case from the WISE (Wave-driven ISentropic Exchange) campaign based on a convection-permitting simulation. Lagrangian non-dimensional metrics of the moisture budget suggest that the ascent timescale (τ600) strongly controls the end-of-ascent total moisture content, which is largest for slowly ascending trajectories (τ600≥20 h, 30 % of all WCB trajectories). This is due to relatively warm end-of-ascent temperatures and the strong temperature control on transported water vapour. Deviations from equilibrium water vapour condensate partitioning are largest for slow trajectories due to faster glaciation and lower ice crystal numbers. A local moisture transport minimum at intermediate τ600 results from a shift towards a riming-dominated precipitation formation pathway and decreasing outflow temperatures with decreasing τ600. The fastest trajectories (τ600≤5 h, 5 % of all WCB trajectories) transport the largest condensate mass to the UTLS due to less efficient condensate loss and produce the longest-lived outflow cirrus clouds. Models that parameterise convection may under-represent these processes, potentially impacting weather forecasts and climate predictions.
- Article
(16585 KB) - Full-text XML
-
Supplement
(370 KB) - BibTeX
- EndNote
Warm conveyor belts (WCBs) are regions of large-scale, coherent, ascending airflow in the vicinity of extratropical cyclones (ETCs), which produce the elongated cloud band typically associated with ETCs. WCBs usually transport moist boundary layer air poleward and into the upper troposphere over a span of 2 d, during which a host of complex physical processes occur that make WCBs important across planetary scales for Earth's weather, climate and radiative budget (Madonna et al., 2014).
As a common weather phenomenon, WCBs occur frequently and are major drivers of mid-latitude weather, influencing large-scale weather conditions for weeks after their dissipation (Joos et al., 2023; Madonna et al., 2014; Rodwell et al., 2018). The ascending air masses undergo diabatic heating, which can produce potential vorticity (PV) anomalies. These anomalies affect cyclone strength and lifetime (Binder et al., 2016; Rossa et al., 2000), modify the upper-level wave guide and jet stream (Pickl et al., 2023; Grams et al., 2011; Joos and Wernli, 2011; Wernli, 1997), and have been linked to atmospheric blocking (Pfahl et al., 2015; Wandel et al., 2024). Additionally, WCBs contribute to over 80 % of the total precipitation in Northern Hemisphere storm tracks (Pfahl et al., 2014; Eckhardt et al., 2004). WCBs are therefore crucial for predicting extreme weather events such as heat waves and storms (Oertel et al., 2022; Flaounas et al., 2017), and the incorrect representation of WCBs has been identified as a key factor in amplifying forecast uncertainties (Pickl et al., 2023; Berman and Torn, 2019).
As a large-scale climatological phenomenon, WCBs significantly influence Earth's climate. When the warm, planetary boundary layer (PBL) air ascends into the upper troposphere and lower stratosphere (UTLS), a multitude of warm-phase, mixed-phase and cold-phase microphysical processes occur, producing various cloud types. Each of these cloud types has distinct microphysical properties and affects Earth's radiative budget through cloud radiative forcing (CRF) differently (Joos, 2019). Determining the net contribution to CRF is complex and has been investigated in several studies (Joos, 2019; Gehring et al., 2020; Stewart et al., 1998). The long-lived cirrus cloud shield that accompanies a WCB in the later stages of its life cycle is optically thin and has low cloud-top temperatures, resulting in positive CRF (Spichtinger et al., 2005; Binder et al., 2020; Joos, 2019). Conversely, the warm-phase, low-altitude clouds that form in the early stages of a WCB's life cycle at lower latitudes are optically thick and have high cloud-top temperatures, resulting in negative CRF (Joos, 2019). Mixed-phase clouds, with varying optical thickness and temperature, have an uncertain CRF sign. Therefore, the net CRF of WCBs and their impact on Earth's radiative budget are sensitive to the microphysical representation of clouds produced in WCBs (Joos, 2019).
In addition to CRF, WCBs influence Earth's radiative budget because they transport water vapour into the UTLS. This happens even though the moisture content of ascending air in a WCB is greatly reduced by the formation of precipitation (Madonna et al., 2014; Sprenger and Wernli, 2003). Water vapour is the most dominant greenhouse gas, and studies have shown that UTLS water vapour, in particular, is the most significant positive feedback factor in climate change (Li et al., 2024; Held and Soden, 2000). Even minor changes in UTLS specific humidity can have a substantial impact on the greenhouse effect (Wang et al., 2001; Hansen et al., 1984). WCBs have generally been associated with significant troposphere–stratosphere exchange (Gettelman et al., 2011), but so far, no studies have quantified the amount of vapour transported into the UTLS by WCBs. Only Zahn et al. (2014), who investigated the origins of measured UTLS water vapour using backwards trajectories, determined that WCBs are one of four dominant transport pathways for water into the UTLS. It also remains unclear how much moisture during the WCB ascent is converted into precipitation, which microphysical processes are responsible for this conversion and to what extent each process contributes.
Given the importance of WCBs, it is essential that weather and climate models accurately represent them. However, it remains unclear what uncertainties are introduced by the parameterisation of microphysical processes when modelling WCBs. These parameterisations are known to introduce significant uncertainties when modelling storms and convective systems (Barthlott et al., 2022; Khain et al., 2015; Dearden et al., 2016; Hieronymus et al., 2022), and sensitivity experiments have shown that the choice of microphysical parameterisation scheme impacts the evolution of WCBs (Mazoyer et al., 2021, 2023). However, the uncertainties introduced by these parameterisations regarding WCB vapour transport into the UTLS and cloud formation, for example, have not been quantified. Consequently, the uncertainty of the CRF induced by WCBs remains largely unknown. Oertel et al. (2023) investigated which microphysical processes produce diabatic heating in a WCB and how these differ for quickly and slowly ascending WCB air parcels. However, it has not yet been studied which microphysical processes modify vapour and hydrometeor content in ascending WCB air, meaning that the uncertainties introduced for the transport of vapour are also unknown.
Another crucial aspect of WCBs that remains poorly understood is the role of deep and embedded convection for the transport of vapour and the production of clouds. Traditionally, WCBs are viewed as consisting of a coherent, slowly ascending and slantwise-ascending airstream. However, recent studies using observations and high-resolution simulations suggest that convection is a common phenomenon in WCBs (Binder et al., 2016; Oertel et al., 2019, 2020, 2021; Rasp et al., 2016). This has several important implications: (i) WCBs may produce extreme precipitation in regions of deep convection (Flaounas et al., 2017), (ii) deep convection could be a significant source of stratospheric ice clouds (Zou et al., 2021) and has been shown to transport more tracers into the upper atmosphere than large-scale advection (Purvis et al., 2003), and (iii) forecast errors tend to grow more rapidly in areas of convective activity (Rasp et al., 2016). Consequently, studies have examined the differences between convective and non-convective WCB air parcels. For example, Oertel et al. (2020) found that hydrometeor compositions are different for trajectories with differing ascent times, while Oertel et al. (2023) show that the microphysical processes contributing to adiabatic heating also differ across ascent timescales. These findings suggest that different microphysical processes govern the evolution of WCB air parcels during their ascent, depending on their convective characteristics. However, the extent to which convective regions within a WCB differ from areas of slantwise ascent with respect to water vapour and hydrometeor transport to the UTLS remains unclear.
Recent studies indicate that high-resolution simulations, which explicitly resolve convection, produce different outcomes compared to models that parameterise convection. Specifically, simulations suggest that Lagrangian WCB air parcels ascend more rapidly, reach higher altitudes and experience enhanced latent heating when resolution is increased (Choudhary and Voigt, 2022). The presence of rapid-ascent regions, as confirmed by observations (e.g. Blanchard et al., 2020), raises questions about how accurately commonly used coarse-resolution models with parameterised convection capture the effects of these convective elements regarding WCB dynamics, water transport and outflow cirrus properties. Potential biases in the simulated water vapour transport and cirrus properties have implications for projections of future UTLS moisture and thermodynamic structure. Consequently, to accurately investigate the role of convection in the transport of moisture by WCBs, it is essential to use high-resolution, convection-permitting simulations that can capture these processes in detail.
This paper aims to address these knowledge gaps by (i) investigating the microphysical processes that control WCB moisture transport into the UTLS and (ii) quantifying how these processes differ between regions of convective and non-convective activity. To this end, we conduct a case study of a North Atlantic WCB using a convection-permitting Icosahedral Nonhydrostatic (ICON) simulation (using the two-moment microphysics scheme from Seifert and Beheng, 2005) and investigate both Eulerian and Lagrangian output fields.
The paper is structured as follows. First, we describe our ICON model setup and the online trajectory module it utilises. Next, we present our novel Lagrangian methods for investigating microphysical processes during WCB ascent of air parcels. This section introduces and derives Lagrangian formulations for common diagnostics, such as the drying ratio and precipitation efficiency. We then present our case study and describe the WCB in question. In our results, we first examine ascent diagnostics to quantify the prevalence of convection in the WCB and then focus on moisture transport. We analyse several diagnostics (i) at the beginning of the ascent, (ii) at the end and in the hours following the ascent, and (iii) during the ascent to provide a comprehensive picture of the moisture transported by the WCB. Finally, we summarise our findings and conclude with the implications of this study for future research on WCBs.
In this chapter, we first describe the ICON model setup used for our simulations. We then outline our WCB trajectory selection algorithm and explain our method of normalising the ascent-time axis around the WCB ascent of a trajectory. Finally, we give a detailed overview of the variables used in our investigations. In particular, we derive Lagrangian formulations for the drying ratio, precipitation efficiency and condensation ratio, among others.
2.1 ICON model setup
Our case study considers a WCB that dominated weather over the northern Atlantic Ocean on 23 September 2017. To simulate the evolution of the atmosphere for this case study we used the Icosahedral Nonhydrostatic (ICON) modelling framework (version 2.6.2; Zängl et al., 2014). Our simulation was initialised with the operational ICON global analysis at 00:00 UTC on 20 September 2017, a couple of hours before the cyclone formed. The simulation ran for 96 h until 00:00 UTC on 24 September 2017, at which time the WCB dissipated over northern Europe.
In addition to a computation domain that spans the entire globe, ICON can embed regions of higher spatial resolution (called “nests”) within the global grid. ICON includes an implementation of two-way nesting, meaning that simulations on lower-resolution domains couple to the next highest-resolution simulation by providing lateral boundary conditions and are in turn nudged towards the solutions of the higher resolution (Zängl et al., 2022). Our model ran with two nested domains. Computations on the global domain were conducted with a 120 s time step on a R03B07 grid (effective grid spacing of approximately 13 km) and on the nested domains with 60 and 30 s time steps on R03B08 (∼ 6.5 km) and R03B09 (∼ 3.3 km) grids, respectively. The nests were chosen such that they cover the main region of WCB ascent, which was visually determined before the model run using cloud cover and sea-level pressure data from ERA5. Figure 1 shows the nested setup with a snapshot of ERA5 reanalysis data (Hersbach et al., 2020) over the main WCB ascent region for 10:00 UTC on 23 September 2017. We can see that the main part of the WCB falls into the nested domains.
We chose the spatial resolutions of the highest-resolution nested domain such that it permits convection. On the global domain, convection is parameterised using the Tiedtke–Bechtold convection scheme (Tiedtke, 1989; Bechtold et al., 2008), whereas on the nested domains only shallow convection is parameterised. On all domains non-orographic gravity wave drag, sub-grid scale orographic drag (Lott and Miller, 1997; Orr et al., 2010) and turbulence are parameterised using the standard ICON schemes. Radiation is treated using the Rapid Radiative Transfer Model. Cloud microphysical processes, which are central to this paper, are calculated using the two-moment microphysics scheme by Seifert and Beheng (2005). This scheme represents hydrometeor mass mixing ratios qx and the corresponding number concentrations nx for six hydrometeor species: cloud droplets (c), rain drops (r), ice crystals (i), snow flakes (s), graupel grains (g) and hailstones (h). The model setup we have described here allows for a detailed representation of the region of interest, i.e. the WCB ascent and initial outflow, while offering a consistent representation of the larger-scale surroundings of the WCB.
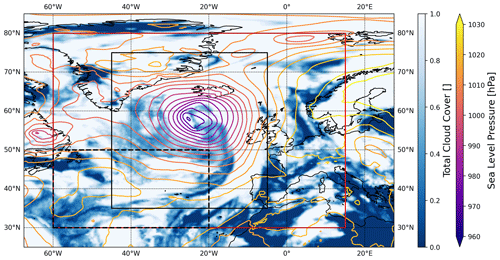
Figure 1Snapshot of the atmosphere at 10:00 UTC on 23 September 2017 using ERA5 data. The nested domain boundaries are shown for the first nest (red) and the second nest (black). The starting area of the online trajectories is also outlined (dashed black line). Through the sea-level pressure contours and the total cloud cover one can clearly see the prominent WCB cloud band and low-pressure system.
Online trajectories
Lagrangian data can be computed online (during a model simulation, using wind fields computed at each time step) or offline (after a model simulation, using Eulerian output files). Online trajectories offer accurate solutions to the trajectory equation for high-resolution models and detailed perspective at high temporal resolution on e.g. microphysical-process rates (Oertel et al., 2023; Miltenberger et al., 2020, 2016, 2013). We therefore used an online trajectory module implemented in ICON by Miltenberger et al. (2020) and extended by Oertel et al. (2023) to support domain nesting. We started online trajectories every 5 h during the 96 h simulation, and data were written to a file every 30 min. Starting positions were chosen at random from within the starting region (shown using the dashed black lines in Fig. 1) and from six vertical model levels (ranging between ca. 1000 and 800 hPa). We chose the starting region, which spans across the two nested domains, on the basis of prior offline trajectories that were calculated using ERA5 reanalysis data. This ensured that we obtained plenty of trajectories representing the WCB airstream.
2.2 Selection of warm conveyor belt trajectories
Our selection algorithm identified WCB trajectories conditional to them fulfilling two criteria. Firstly, a WCB trajectory must ascend at least 600 hPa in at most 48 h. This is a widely used criterion/limit imposed by previous studies (e.g. Madonna et al., 2014; Oertel et al., 2023; Rasp et al., 2016). Secondly, all WCB trajectories must be within two visually determined longitude–latitude regions at two certain times. These regions were determined on the basis of Eulerian cloud cover and sea-level pressure data from our simulation. This ensured that the trajectories were not part of a mesoscale convective system (MCS) unrelated to our WCB or any other cyclone.
2.3 Ascent timescales and characterisation of convective behaviour
In this section we introduce the metrics with which we determine the ascent timescale and convective behaviour of WCB trajectories. The simplest and most widely used ascent timescale is the fastest time in which a trajectory ascends 600 hPa, called τ600 (Rasp et al., 2016; Oertel et al., 2023). We use this timescale to differentiate convective (small τ600) from slantwise-ascending (large τ600) WCB trajectories. We are however interested in the entire WCB ascent, not just the section where the ascent is fastest. We therefore also look at the time for which the ascent velocity remains above 8 hPa h−1 before and after the τ600 time segment and call this time τWCB. We use τWCB to define the period during which a trajectory is ascending as part of the WCB; before/after this time it is defined to be in the inflow/outflow.
To get a broader picture of the overall convective activity, we also consider additional variables. Similarly to τ600, we also look at the 300 and 400 hPa ascent times (τ300, τ400) to quantify the convective behaviour for less deep ascent (i.e. embedded mid-level convection). We also look at the maximum 2 h pressure difference (max(Δp2 h)) and the minimum 10 h pressure difference (min(Δp10 h)) during the WCB ascent to assess the “regularity” with which trajectories rise. The last metric of course only makes sense for trajectories that take more than 10 h to ascend.
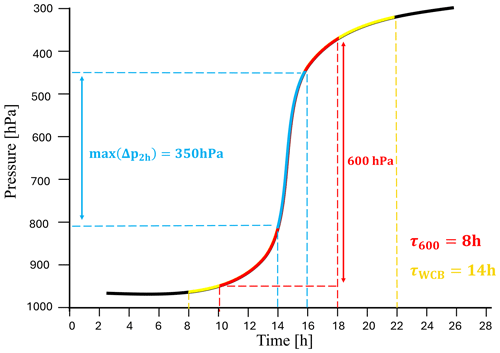
The metrics introduced here allow for a deeper insight into a trajectory's ascent behaviour. Consider for instance the three most important metrics: τ600, τWCB and max(Δp2 h), visualised by a drawing in Fig. 2. In this example, a WCB trajectory is ascending from the boundary layer at around 950 to 350 hPa over a time of approximately 28 h. The ascent velocity remains above 8 hPa h−1 (τWCB) for 14 h and is coloured yellow. The minimum time taken for a 600 hPa ascent along the trajectory's entire path (τ600) is 8 h and is coloured red. The maximum pressure difference experienced by the trajectory in any 2 h time span (max(Δp2 h)) is 350 hPa and is coloured cyan. This trajectory would be described as ascending in a purely slantwise fashion if only τWCB is considered, but max(Δp2 h) shows that there is a short period of convective ascent. It is therefore important to consider multiple metrics to correctly classify and understand the ascent behaviour of a trajectory.
2.4 Normalised ascent timescale
We want to be able to compare the physical processes of WCB trajectories with different ascent timescales at similar stages of their ascent. This becomes difficult when looking at data along a τWCB time axis, as fast trajectories will complete their ascent and reach the UTLS at a time when slow trajectories may still be in the lower troposphere. We therefore normalise the τWCB ascent time for all trajectories and introduce the normalised ascent time . The time at which trajectories begin to ascend at a velocity of at least 8 hPa h−1 (t0, defined as the beginning of τWCB; see Sect. 2.3) is set to 0 (), and the time at which they stop ascending at a velocity of at least 8 hPa h−1 () is set to 1 (). Now all normalised ascent times are bound by 0 and 1, and any two trajectories at a given normalised time are likely to be at similar stages of their ascent. This approach allows for an investigation and comparison of physical processes along a coherent and ascent-oriented time axis.
2.5 Time-integrated rates
We consider time-integrated (as opposed to instantaneous) microphysical-process rates. This is done so that we can determine the accumulated effects of a microphysical process along a trajectory during its WCB ascent. ICON computes instantaneous microphysical-process rates ψinst(t) with units of (see Supplement). We use these to define the time-integrated rates that are calculated by the online trajectory module using the spatially interpolated instantaneous rates at each model physics time step:
To focus on the WCB ascent only, i.e. ignoring anything that happened before, the time-integrated rates are set to 0 (in post-processing) at the start of the WCB ascent, i.e. .
2.6 Moisture budget
To understand the physical mechanisms that control the final moisture content in the outflow of a WCB, we will now define and derive variables that describe the specifics of removing/adding moisture from/to an air parcel in a Lagrangian framework.
2.6.1 Lagrangian drying ratio
In the most general sense, the efficiency with which moisture is removed from a parcel can be described by the drying ratio (DR) (e.g. Miltenberger, 2014). It quantifies how much moisture initially contained in the Lagrangian parcel is removed by the end of the ascent and is given by
Here is the total moisture content at the beginning () and at the end () of the WCB ascent, so the numerator is equal to the change in total moisture during the ascent. is the sum of the specific humidity (qv) and all hydrometeor mass mixing ratios (qc, qr, qi, qs, qg and qh; see Appendix B). This definition of DR is a Lagrangian one because we consider the differences in moisture along the trajectories.
DR is non-zero if moisture is removed from a trajectory by the end of the ascent (DR = 1 if all moisture is removed). The mechanisms for moisture removal in our simulation are (i) the turbulence parameterisation, (ii) the convection parameterisation, (iii) precipitation and (iv) numerical uncertainties/interpolation errors. We can therefore rewrite Eq. (2) as follows:
In this equation, Qtcr(1) is the sum of the moisture removed by the turbulence and convection parameterisations and the numerical uncertainties by the end of the ascent (for details see Appendix B). We refer to this as the moisture loss due to the “mixing” processes. P(1) is the time-integrated net precipitation rate at the end of the ascent, which accounts for the moisture lost by the gravitational removal of hydrometeors from the parcel (see Appendix B). Note that this is not surface precipitation but the net flux of hydrometeors leaving the parcel.
We can conclude that the numerator terms in Eq. (3) include all the mechanisms in our simulation that can remove moisture from a trajectory. Their sum is therefore equal to the change in total moisture during the ascent and Eq. (3) is equal to Eq. (2).
2.6.2 Lagrangian microphysical and mixing drying ratio
More detailed insight into the processes that determine DR can be gained by splitting DR into terms that describe different moisture removal mechanisms. First we define the mixing drying ratio,
which describes what fraction of initial moisture is lost due to mixing processes. All remaining moisture (Qtot(0)−Qtcr(1)) either remains in the parcel or is removed by precipitation, which brings us to the definition of the microphysical drying ratio:
DRmphys is the fraction of this remaining moisture that is removed by the precipitation of hydrometeors. Its name comes from the fact that moisture loss due to precipitation depends on the microphysical processes that form and grow hydrometeors.
For completeness, note that the denominators of the two drying ratios we have defined are not the same. Our choice of denominators ensures that DRmphys only describes moisture removal by precipitation after the removal by mixing processes is taken into account. DRmphys is not 1 if all the moisture has been removed by precipitation alone but if all the moisture that has not been removed by turbulence/convection has been removed by precipitation. This choice reflects the focus of this paper on microphysical processes. Regardless of the choice of denominator, DR can be recovered from DRmix and DRmphys as follows:
The interaction term Θ results from the fact that both moisture removal by mixing and precipitation occur simultaneously, i.e. any moisture removed by turbulence/convection is not available for precipitation. We now shift our focus to the processes that govern DRmphys.
2.6.3 Lagrangian precipitation efficiency (PE) and condensation ratio (CR)
For water vapour to be removed from an air parcel through precipitation, it must first be converted into cloud condensate. This conversion can happen either by forming new hydrometeors (nucleation) or by the growth of existing hydrometeors through deposition and condensation. These hydrometeors may already be present in the parcel, or they may enter it through sedimentation or mixing via turbulent processes. This conversion can be quantified by the condensation ratio (CR) (e.g. Barstad et al., 2007; Miltenberger, 2014). After the conversion, condensate may leave the parcel as precipitation. This process is quantified by the precipitation efficiency (PE) (e.g. Miltenberger, 2014; Dacre et al., 2023).
For the Lagrangian CR we obtain the following expression:
A detailed definition of the above terms can be found in Appendix B4, but in short, quantifies the conversion of vapour into hydrometeors, quantifies the reverse (conversion of hydrometeors into vapour) and VAP() is equal the initial vapour content minus the vapour lost to parameterisations other than cloud microphysics, all at the normalised ascent time . Therefore, this equation states that CR is equal to the net hydrometeor growth by microphysical processes (Chy(1)+Ev(1)) divided by the net initial water vapour content (VAP(1)). It thus gives the fraction of vapour that is initially present or brought in through turbulence, convection or numerical residuals, which is subsequently converted into hydrometeors. Using VAP, instead of as in the definition of DR, ensures that CR is bounded by 0 and 1.
For PE we obtain
This formulation states that PE is equal to the total net precipitation out of the parcel (P(1)) divided by the sum of net hydrometeor growth and net initial hydrometeor content (HYD(1), initial hydrometeor content minus the hydrometeors lost to parameterisations other than cloud microphysics by the end of the ascent; see Appendix B4). In other words, PE tells us how many hydrometeors that (i) were formed during the ascent, (ii) were already present at the beginning, or (iii) were carried in by the turbulence or convection scheme (or numerical residual) are precipitated out of the parcel by the end of the ascent. The incorporation of (iii) ensures that PE is bounded by 0 and 1.
Finally, we get DRmphys from PE and CR as follows:
using
We point out that
is equal to 1 if all initial moisture is lost exclusively to precipitation. For small values of HYD(1) the fraction on the right-hand side of Eq. (9) goes to 1 and ϵ goes to 0, meaning that we can approximate
This equation is typically used in studies focussing on a regional moisture budget analysis from an Eulerian perspective (e.g. Barstad et al., 2007; Miltenberger, 2014).
In this section we have presented all variables using the normalised ascent timescale introduced in Sect. 2.4. However, the definitions are also valid on the real time axis as long as the start and end times for the integrated rates are set accordingly. It is also possible to quantify at DR, PE, etc. at arbitrary times during the ascent by replacing with a normalised time (leaving the initial conditions unchanged). We will now discuss the physical meaning of PE and CR in DRmphys.
2.6.4 Interpretation of PE and CR's physical meaning in DRmphys
The physical meaning of PE and CR in DRmphys can be easily interpreted if we assume that the net initial hydrometeor content HYD(1) is negligible. In this case DRmphys approximates to PE⋅CR. CR determines how much moisture is converted into hydrometeors, and PE determines how many hydrometeors are removed. If CR is large and PE is small, then the air parcel is converting moisture efficiently but removing it inefficiently. Conversely, if CR is small and PE is large, then the parcel is efficient at hydrometeor removal but has low hydrometeor production. DR is less than 1 if some moisture remains, 1 if all moisture has been removed and 0 if no moisture has been removed. The following theoretical edge cases illustrate this:
-
PE=1, CR=1 and DR=1.
There is no remaining moisture. All the vapour has been converted, and every hydrometeor has precipitated. -
PE=1, CR<1 and DR<1.
Any remaining moisture is vapour, and all hydrometeors have precipitated. -
PE<1, CR=1 and DR<1.
Hydrometeors make up all remaining moisture, and there is no vapour. -
PE=0, CR>0 and DR=0.
Water vapour is converted into hydrometeors, but they stay in the parcel. Qtot is unchanged. -
PE>0 and CR=0 but DR>0 in the case that HYD(1)>0 is not negligible.
This case only makes sense if the net initial hydrometeor content is not neglected, meaning ϵ>0. No moisture is converted, and only the initial hydrometeors precipitate. Qtot decreases, but Qv is unchanged.
As the last case illustrates, including HYD(1) ensures that initial hydrometeors and additional hydrometeor removal processes (e.g. turbulence) are accounted for. Our interpretation of the role of PE and CR therefore holds as long as HYD(1) is much smaller than VAP(1). In Appendix B5 we show that our Lagrangian definitions for PE, CR and DRmphys can heuristically be compared to the Eulerian definitions of the same variables from previous studies.
Here, we present a detailed description of the WCB that serves as the focus of our case study. A strong cyclone with a pronounced WCB characterised the weather over the northern Atlantic from the afternoon of 22 September 2017 to the end of 23 September 2017. Measurements in air masses related to this system were carried out as part of the HALO–WISE (High Altitude and long Range Aircraft–Wave-driven ISentropic Exchange) campaign (Haynes and Palm, 2023). Note that it is an example of an almost purely open-ocean WCB.
The conditions for cyclogenesis began to develop early on 20 September 2017. Strong southeasterly winds, resulting from the combination of the wind fields around a high-pressure system off the coast of Newfoundland and a low-pressure system off the southern tip of Greenland drove a large and cold air mass from the Greenland and the Labrador Sea across the northern Atlantic (Fig. A1a). On the western side of the high-pressure system (located at 45° W, 45° N) warm air was transported northwards, leading to the formation of a 1500 km long front at 52° N (Fig. A2a). The converging winds associated with the high- and low-pressure systems acted frontogenically and strengthened the temperature gradient. This induced a baroclinic zone with strong horizontal wind shear and began lifting air masses at the point of convergence. At this time (ca. 04:00 UTC on 21 September 2017), the low-pressure system started forming.
At the same time, an upper-level trough/positive potential vorticity (PV) anomaly approached from the northwest and propagated to the southeast (Fig. A2b). It induced cyclonic rotation in the atmospheric column, which, together with PV generated at lower levels from latent heating, resulted in the development of a PV tower. This induced strong cyclonic flow in the lower levels of the atmosphere (Fig. A3a). As a result, the cyclone underwent explosive cyclogenesis, with central surface pressure dropping from 1002 hPa at 04:00 UTC on 21 September to 977 hPa at 04:00 UTC the following day. In the cloud field a comma-shaped cloud band typical of WCBs formed on 22 September 2017 and propagated northeast until its northern tip reached Iceland early on 23 September (Fig. 1). At this point the cold front (along which convective clusters were found) stretched 4000 km across the Atlantic and reached south of 40° N. On 24 September 2017 the cyclone dissipated over the Norwegian Sea. The upper-level trough propagated further downstream (Fig. A5b). On the surface the cyclone brought relatively mild air (ca. 15 °C) all the way to Iceland and Svalbard and therefore had a large impact on central and northern European weather.
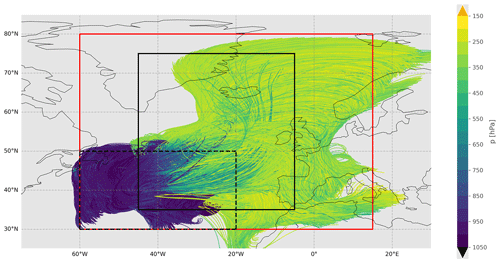
From our simulation of the case (see Sect. 2.2 for a description of the setup) we identified 393 070 WCB trajectories associated with the cyclone described above. The spatial and pressure evolution for every 10th trajectory throughout the entire simulation is shown in Fig. 3. The colouring shows that most trajectories experience a large change in pressure (and hence their WCB ascent) within the highest-resolution domain. The average horizontal distance covered during the ascent is 2400 km. A few trajectories rise very early and remain in the southern region of the WCB. A majority of trajectories move along northwards during their ascent, in line with the comma-shaped cloud structure, and move eastwards after reaching the UTLS. Some then turn clockwise and move to the southeast, reaching as far south as Morocco, while others, completing their ascent further north, move across central or northern Europe. A large proportion end up as far north as Greenland.
We characterise the ascent of WCB trajectories on the basis of their τ600 (Sect. 2.3). Figure 4a shows a histogram of τ600 and τWCB ascent times for all selected WCB trajectories. We see a unimodal distribution with a mean, median and mode for τ600 of 16.9, 14.5 and 11 h, respectively. There is large variability in ascent timescales with a steep decline for timescales shorter than 10 h and a tail towards longer ascent times. We define three ascent “regimes”: (i) “convective” trajectories with τ600<5 h, representing 6 % of all WCB trajectories; (ii) “normal” trajectories with , representing 55 %; and (iii) “slow” trajectories with τ600>20 h, representing 30 % of all cases. However, τ600 ascent times do not form a complete picture of ascent behaviour, as they quantify only deep ascent. The 300 and 400 hPa ascent times (τ300, τ400, Fig. 4b) focus on smaller-scale embedded convective activity. Their distribution is not unimodal but instead bimodal with peaks at about 5 h (3 h) and 1.5 h (1 h) for τ400 (τ300). Many trajectories therefore ascend rapidly for a large part of the total 600 hPa ascent but fail to maintain a high rate of ascent throughout the troposphere (an example for this is shown in Fig. C1b).
The widespread occurrence of rapid-ascent segments across the τ600 spectrum is confirmed by the distribution of maximum pressure drops over 2 h (Fig. C1a): 38 % of slow trajectories experience periods where they rise about 200 hPa in 2 h, and 78 % of all trajectories have a 0.5 h period in which the average ascent velocity is larger than 120 hPa h−1 (gives 600 hPa in 5 h). Many trajectories also rise in “steps”, with two or more sections of rapid ascent followed by extended periods of almost no ascent (not shown); 30 % of slow trajectories experience a 10 h period in which they ascend less than 10 hPa (min(Δp10 h)<10 hPa), and 10 % even experience a segment within τWCB in which they descend more than 40 hPa (not shown). Only 9 % of slow trajectories have max(Δp2 h)<100 hPa, meaning that truly slantwise-ascending trajectories are in the minority and one cannot assume that a large τ600 value means that the entire ascent is slow and monotonous.
To ensure that the problematic cases (where τ600 is large but the trajectory is rising convectively for most of the ascent) are neglected, we remove slow trajectories that rise quickly for a large part of the ascent, i.e. max(Δp2 h)>350 hPa, from the dataset for further analysis (removes about 5 % of slow trajectories). A similar condition has been imposed by Rasp et al. (2016). This additional condition is why the orange colour in Fig. 4a does not fill the histogram all the way to the top.
In summary, the WCB trajectories show a wide range of ascent timescales and almost all of them, even the slowly ascending ones, experience bursts of convective activity (Fig. C1). This shows that even for an open-ocean WCB, convection is a ubiquitous feature and that truly slantwise-ascending trajectories are a minority. We will now analyse the transport of moisture by the WCB.
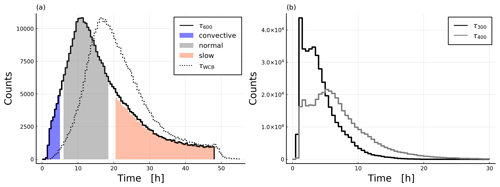
Figure 4Ascent statistics that help us understand the convective behaviour of WCB trajectories. In (a) histograms for τ600 (solid line) and τWCB (dashed line) ascent times are shown, as well as the three categories into which they are grouped. In (b) the τ300 (black) and τ400 (grey) ascent times are shown. The distributions are different because many trajectories ascend a large portion convectively but not the full 600 hPa.
WCB ascent connects the planetary boundary layer with the upper troposphere and thereby constitutes a source of moisture for the UTLS. The actual amount of water reaching the UTLS depends on the initial water content at the start of the ascent and the moisture loss processes during the ascent. For the selected case study, we present a detailed analysis of this moisture budget in the following.
5.1 Trajectory characteristics at the start of the WCB ascent
Convective trajectories have initial temperatures and pressures of approximately 20 °C and 975 hPa, respectively, whereas slow trajectories have about 18 °C and 965 hPa (Fig. 5a; recall that is the start of the τWCB ascent and is the end). Hence, on average faster-ascending trajectories begin their ascent at higher temperatures and pressures and have a higher initial total moisture content than slower-ascending trajectories. However, the spread of conditions for the start of slow trajectories is much larger than for the fast trajectories, as can be seen by the difference in the mean and median values. This is consistent with the finding by Oertel et al. (2023) that convective trajectories originate in a more southerly part further away from the cyclone centre compared to slow trajectories. The initial total water content behaves similar to the temperature; i.e. it decreases with increasing ascent time (Fig. 6a). Consequently, the average Qtot(0) is 12.9 g kg−1 for convective trajectories and 11.3 g kg−1 for slow trajectories. The spread increases with ascent time. This means that we find a strong correlation for short ascent times with high vapour content and high temperatures. We suggest that this is because higher temperatures and vapour content mean that more buoyancy can be generated by latent heating, leading to faster ascent times (this is in line with findings from Schäfler and Harnisch, 2014). The initial hydrometeor content varies but is generally small (<0.4 g kg−1, average of 0.08 g kg−1 for all trajectories, Fig. 6a) with a weak dependence on τ600.
5.2 Trajectory characteristics at the end of the WCB ascent
5.2.1 Temperature and pressure
The pressure and temperature at the end of the ascent is lower for trajectories with smaller τ600 values compared to more slowly rising trajectories (Fig. 5b). This difference persists even many hours after completion of the ascent, with the minimum pressure and temperature that convective trajectories reach averaging 236 hPa and −56 °C and 314 hPa throughout the entire simulation and −44 °C for slow trajectories (not shown). This is partially due to the fact that faster trajectories ascend earlier and therefore further south (not shown), where the atmosphere is deeper. However, even when trajectories are rising at the same latitude, those with lower τ600 values will rise on average 90 hPa higher (not shown). The differences seen for final temperature and pressure are therefore largely due to differences in initial humidity and temperature, where larger values favour latent heat release and stronger cross-isentropic transport.
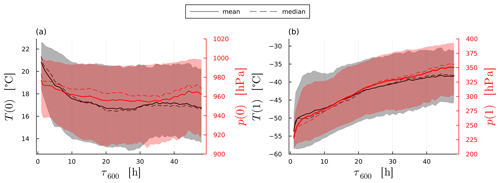
Figure 5Mean (solid line) and median (dashed line) of the temperatures (black) and pressures (red) at the (a) beginning and (b) end of the WCB ascent. The 10th and 90th percentiles are shaded. Faster trajectories start their ascent at higher temperatures and pressures and conversely end their ascent at significantly lower temperatures and pressures. Note: the pressure axis is not flipped to make the correlation with temperature more obvious.
5.2.2 Hydrometeor content
The total hydrometeor content at the end of the ascent (Qhy(1)) is strongly influenced by ascent time and increases for a shorter τ600 (the maximum value of 0.17 g kg−1 is reached for τ600=1.5 h, Fig. 6b). Therefore, on average, convective trajectories transport far more hydrometeors (mass and number) into the UTLS than slow trajectories. This is made evident by the fact that even though convective trajectories make up only 5.8 % of all trajectories, they account for 14.3 % of Qhy(1). The mean Qhy(1) remains below 0.04 g kg−1 for τ600>10 h, where the spread is low. Ice is the dominant hydrometeor species at the end of the ascent for all trajectories, constituting 99 % of Qhy(1) (the remaining 1 % is predominantly snow). No liquid hydrometeors are found, although T(1) is not below 235 K (the homogeneous freezing temperature) for all trajectories.
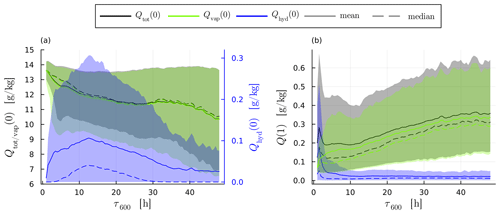
Figure 6Mean (solid line) and median (dashed line) total moisture content (Qtot, black) as well as the vapour (Qvap, green) and hydrometeor (Qhyd, blue) content at the (a) beginning and (b) end of the WCB ascent. The 10th and 90th percentiles are shaded. Note: the different y axis for Qhyd(0) in (a) is due to the difference in magnitude.
5.2.3 Vapour content and relative humidity over ice
Aside from condensate, WCB trajectories also transport water vapour into the UTLS. Specific humidity is strongly correlated with the saturation specific humidity over ice, which depends on temperature and pressure only (Fig. 7b), indicating that transport of specific humidity has strong thermodynamic constraints. This is also evident from the final vapour content Qv(1) (Fig. 6) showing the same dependence on τ600 as the final temperature (Fig. 5b). As a result, the majority of trajectories (65 %) have a relative humidity with respect to ice (RHi(1)) of (100±6) % (Fig. 7a). However, while the thermodynamic conditions at the end of the ascent are the dominant factors in determining vapour content, a significant minority of trajectories deviate from 100 % saturation: 3.5 % of trajectories have RHi(1)<94 %, and 31 % have RHi(1)>106 %. Notably, more trajectories are supersaturated than sub-saturated, with 70 % of all trajectories being supersaturated with respect to ice upon completing their ascent and entering the UTLS. This indicates that the WCB transports substantial amounts of ice-supersaturated air into the UTLS. The variability in RHi(1) likely stems from the different microphysical properties of the trajectories which control the relaxation of supersaturation to saturation values.
There are notable differences in RHi(1) between convective and slow trajectories. On average, convective trajectories have a slightly lower RHi(1) of 102.6 % compared to 104.7 % for slow trajectories. Although these averages are similar, the RHi(1) distributions differ significantly between the two groups. Convective trajectories exhibit a sharp peak at 97 % with a tail extending to higher values, while slow trajectories show a more bell-shaped distribution, peaking at 108 % (Fig. 7a). Consequently, only 56.5 % of convective trajectories are supersaturated, compared to 80 % of slow trajectories. This finding is particularly interesting given that convective trajectories contain much higher hydrometeor concentrations than slow trajectories at the end of the ascent. The lower ice number concentration in slow trajectories (Fig. 11) likely increases the supersaturation relaxation timescale and allows for the persistence of higher relative humidity.
We can summarise Sect. 5.2 by noting that convective trajectories reach higher into the atmosphere at the end of the ascent and have lower specific humidity than slow trajectories and higher hydrometeor contents than slow trajectories. The specific humidity at the end of the ascent is predominantly constrained by the outflow temperature. Substantial spread in the specific humidity at a given temperature is introduced by deviations away from saturation, which are more abundant in slow compared to convective trajectories. At the end of the ascent, convective trajectories contain, on average, 10 times more ice crystals (or 2 times more for the median) and roughly twice the ice mass compared to slow trajectories. Consequently, while both convective and slow trajectories transport a similar total water mass to the UTLS – with a minimum observed for intermediate ascent timescales – the partitioning between water vapour and condensate, as well as the resulting ice cloud properties, depends significantly on the ascent timescale.
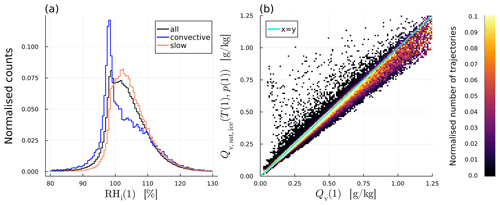
Figure 7(a) Relative humidity over ice for all trajectories as well as the convective and slow trajectories, shown as a normalised histogram at the end of the ascent for all (black), convective (blue) and slow (orange) trajectories. (b) Two-dimensional histogram of calculated saturation specific humidity (over ice) given temperature and pressure at the end of the ascent (y axis), over the actual specific humidity (x axis).
5.3 Moisture loss pathways
In this section we will compare the behaviour of moisture loss between convective and slow-ascending trajectories using the variables introduced in Sect. 2.6.
5.3.1 Total fractional moisture loss (DR)
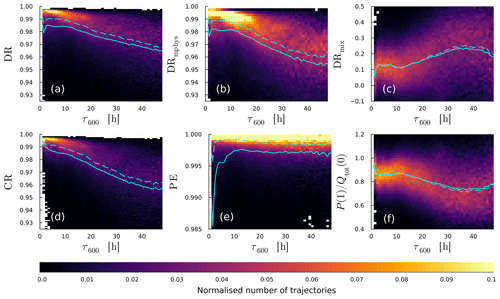
DR indicates the percentage of moisture lost by the end of the ascent, and on average WCB trajectories lose more than 95 % of their moisture (Fig. 8a). DR decreases with increasing ascent time, meaning that faster trajectories lose a larger fraction of their initial moisture than slower trajectories. As we will discuss in the next paragraphs, this is mainly due to the lower temperature attained by fast-ascending trajectories, which results in low-saturation vapour pressure (see discussion on CR). The slight decrease in DR for the fastest-ascending trajectories is due to their elevated hydrometeor content (Fig. 6a; see discussion on PE). This shows that DR is predominantly controlled by thermodynamic conditions but can be modulated by the transport of hydrometeors.
5.3.2 Fractional moisture loss due to mixing processes (DRmix)
The fraction of the initial humidity that is removed by turbulent mixing during the ascent is quantified by DRmix (Eq. 4). Overall, DRmix increases with increasing ascent time (Fig. 8c), meaning that slower-ascending trajectories experience more fractional moisture loss due to processes other than precipitation than fast-ascending trajectories. The individual contributions to DRmix (turbulence, convection parameterisation, numerical residuals) as functions of τ600 are shown in Fig. C4. The largest contribution to DRmix comes from the turbulence parameterisation; the convection parameterisation and numerical residuals play a secondary role. This makes sense because a longer ascent time means more time spent in the planetary boundary layer and a longer time for surrounding air to be mixed into the air parcel through turbulence. Indeed, for all WCB trajectories the moisture loss due to mixing occurs in the first part of the ascent at pressures larger than about 700 hPa (Fig. C5a, b). A surprising trend is that for the longest ascent times DRmix decreases slightly. We presume that this is because the slowest trajectories move along regions that experience smaller horizontal and vertical wind shear (which drive turbulence). Circumstantial evidence for this assumption is provided by temporally averaged wind shear amplitudes along the ascent (Fig. C2), which indicates that slower-ascending trajectories are more part of the large-scale coherent flow of the WCB than fast-ascending trajectories.
5.3.3 Fractional moisture loss due to precipitation ()
The net precipitation P(1) decreases with increasing ascent time (Fig. C3a), correlating with less available moisture in the slowly ascending trajectories (Fig. 6a). This suggests (see discussion on PE) that precipitation formation is very efficient and precipitation amounts are strongly controlled by thermodynamic constraints on condensate formation. Fast-ascending trajectories experience greater fractional moisture loss due to net precipitation () than slow-ascending trajectories (Fig. 8f). is also larger than DRmix for all trajectories, showing that precipitation is the dominant mechanism for moisture loss of WCB trajectories, regardless of their ascent time. Note that is essentially the mirror image of DRmix as both terms contain all possible moisture loss processes.
The dominant form of net precipitation for almost all trajectories is the warm phase (rain) (Fig. C3a). Only the fastest-ascending trajectories have equal amounts of frozen precipitation (ice, snow, graupel, hail) and rain. The net flux of frozen hydrometeors is negative for many slow-ascending trajectories and is largely a mirror image of the net rain flux. This suggests that slow trajectories convert frozen hydrometeors entering them from above (mainly graupel and snow, Fig. C3b) into rain by melting. Slow trajectories spend a large fraction of their ascent just below the melting layer, which allows for a substantial influx of frozen hydrometeors in melting conditions (see Sect. 5.4). For all trajectories with τ600<20 h, graupel precipitation is the dominant precipitating hydrometeor and makes up 33 % of precipitation for convective trajectories (Fig. C3b). So for all trajectories but especially for fast-ascending trajectories, frozen hydrometeors play a larger role in removing moisture.
5.3.4 Efficiency of moisture loss through precipitation (DRmphys, PE, CR)
Finally, we measure how condensate formation and the removal of condensate through sedimentation each contribute to the variability in net precipitation and outflow moisture content for different τ600 values. The fraction of inflow moisture that is not removed by turbulence and is converted to condensate is quantified by the Lagrangian condensation ratio CR. CR is on average 0.98 and decreases from about 0.99 for convective to about 0.97 for slowly rising trajectories (Fig. 8d). The large CR reflects the large vertical displacement of all trajectories and supports the strong cross-isentropic ascent of the WCB. Water vapour content at the end of the ascent is predominantly thermodynamically constrained (Sect. 5.2), and it is therefore not surprising that the dependency of CR on τ600 reflects the outflow temperature of the WCB trajectories.
The fraction of the condensate that is removed by gravitational settling can be quantified by the Lagrangian precipitation efficiency PE. PE is very close to 1 for all trajectories (Fig. 8e), indicating that WCB air parcels are extremely efficient at removing the hydrometeors they form/grow during the ascent. For the fastest ascents, PE decreases sharply, which is reflected in the large final hydrometeor content for convective trajectories. Because of the longevity of ice particles in convective trajectories, PE also remains larger for faster ascent times in the hours after the ascent (not shown).
Finally, PE and CR can be combined to a microphysical drying ratio DRmphys (Eq. 9) analogous to DRmix and the fractional moisture loss discussed earlier. In contrast to the fractional moisture loss, DRmphy quantifies the loss of moisture due to cloud microphysical processes in the absence of turbulent mixing. DRmphys is approximately equal to PE⋅CR as HYD(1) and ϵ are much smaller than 1 (not shown). Furthermore, since PE is essentially 1 for most trajectories, DRmphys is almost equal to CR. Only for the fastest trajectories do we see a dip in DRmphys that reflects the sharp decrease in PE.
In summary, the main pathway for moisture removal for all trajectories is precipitation with mixing processes playing a secondary role. Fractional moisture loss is >95 % for all trajectories and is mainly controlled by the vertical displacement that WCB parcels experience, i.e. temperature at the end of the ascent. This is reflected in CR, which behaves like final pressure and temperature, and PE, which is close to 1. The exception for PE is convective trajectories, where PE decreases sharply with decreasing ascent time. This shows that convective activity has a large impact on the efficiency with which moisture is removed by the end of the WCB ascent. Note that the variability in PE, CR and DRmpyhs with τ600 may appear small because all parcels are rising very strongly, but this variability gives rise to substantial variability in the moisture content in the UTLS (about a factor of 2 in Qtot(1), Sect. 5.2).
5.4 Trajectory characteristics during the ascent
Here, we present a detailed analysis of the moisture and thermodynamic evolution of rising WCB air parcels to explain the τ600 dependence of moisture budget terms. Specifically, we compare the evolutions of slow ascending and convective ascending parcels along the normalised ascent-time axis introduced in Sect. 2.4. Our focus is on the microphysical removal of moisture and key moisture budget terms, namely CR and PE.
5.4.1 Processes contributing to condensation efficiency (CR)
The condensation ratio at the end of the ascent CR(1) is higher for fast-ascending trajectories than slow-ascending trajectories (Sect. 5.3) and is largely controlled by the temperature. The evolution of CR (Fig. 9a) and temperature (Fig. 9b) during the ascent reveal a similar picture, with CR increasing much faster for convective trajectories than for slow ones, mimicking the faster decrease in temperature for fast trajectories.
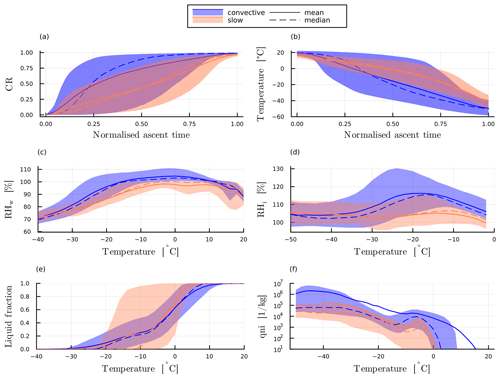
Figure 9(a) Condensation ratio CR and (b) temperature over normalised ascent time. (c) Relative humidity over water RHw, (d) relative humidity over ice RHi, (e) liquid fraction and (f) ice crystal number concentration over parcel temperature during the WCB ascent. In all panels the mean (solid) and median (dashed) and the 10th and 90th percentiles (shaded) are plotted in blue for convective and orange for slow trajectories.
In Sect. 5.3 we also found distinct differences in the relative humidity distribution for slantwise-ascending and convective ascending parcels. To clarify the physical processes driving these differences, we present the time evolution of relative humidity over water RHw and ice RHi, the liquid fraction (i.e. the ratio of liquid condensate mass to total condensate mass), and the ice crystal number concentration (Fig. 9c–f; note that the x axis is now temperature, which allows us to focus on deviations away from thermodynamic equilibrium). During the ascent but at temperatures above 0 °C, the median RHw increases as WCB parcels approach the cloud base and reaches close to 100 % at about 12 °C for both sets of trajectories. It remains close to 100 % for a substantial part of the ascent, reflecting the control of the saturation adjustment scheme on the specific humidity in the model. Note that small deviations away from 100 % are likely due to uncertainties in the interpolation of specific humidity, temperature and pressure to the trajectory position in the online trajectory module.
After reaching temperatures below −6 °C, the median RHw decreases rapidly for slow trajectories, while for convective trajectories, conditions close to water saturation persist until temperatures of about −17 °C. This difference is due to the more rapid glaciation of slowly rising trajectories compared to convective ones, as is also evident from the differences in the median liquid fraction below −10 °C (Fig. 9e). Smaller vertical velocities for slow-ascending trajectories (Fig. C5c) mean both that the Wegener–Bergeron–Findeisen process is more efficient and that there is more time for depositional growth (Fig. C6a–c).
A total of 90 % of both sets of trajectories are fully glaciated before reaching the homogeneous freezing temperature for cloud droplets (−38 °C), which is also reflected in the fact that RHi values close to saturation are being reached already at temperatures of about −30 °C. In the fully glaciated part of the ascent (temperatures between −30 and −40 °C), the median RHi is smaller for convective than for slow trajectories despite larger vertical velocities. This is likely because the much higher ice crystal number concentrations of convective trajectories in this temperature range allow for a more efficient conversion of vapour into ice (Fig. 9f). The difference in ice number concentrations can be attributed to two factors: (i) within this temperature range, the Hande et al. (2015) parameterisation has a strong temperature dependence of ice-nucleating particles (INPs) for immersion freezing. Since slow-ascending trajectories glaciate at warmer temperatures, immersion freezing produces fewer ice crystals when compared to convective trajectories. (ii) Convective trajectories have less time available for the sedimentation of ice crystals and the aggregation to snow.
In summary, the dependence of CR and the distribution on the ascent timescale τ600 can be explained by the stronger vertical displacement and less rapid glaciation in convective trajectories. The use of the saturation adjustment scheme, along with the specifics of the ice nucleation parameterisation, may affect the quantitative results. We are currently conducting a follow-up study to investigate the impact of these factors.
5.4.2 Processes contributing to precipitation efficiency (PE)
As discussed in Sect. 5.3, the precipitation efficiency PE also increases with decreasing τ600, with a weak indication of reduced PE for the fastest ascents (τ600≤2 h). The temporal evolution of PE (Fig. 10a) and of relevant microphysical properties (Fig. 10b–f) during the ascent reveal the underlying physical processes that lead to this difference. The evolution of PE is much more similar between slow and convective trajectories than the evolution of CR and is not directly tied to the evolution of temperature and pressure. This further validates the hypothesis that CR and PE are useful metrics for understanding how the (thermo)dynamic and microphysical conditions control precipitation formation (see also the discussion in e.g. Miltenberger et al., 2016; Miltenberger, 2014).
In the first quarter of the ascent, corresponding to pressures roughly below 800 hPa (Fig. C5b), PE increases very quickly to 0.9. At this time warm-rain processes and accretion dominate the microphysics (Fig. 9b), while parcels are located below the main WCB cloud, where they are increasingly affected by hydrometeor influx from above (not shown). Consistently, the hydrometeor mass mixing ratio strongly increases in the first quarter of the ascent for both slow and convective trajectories (Fig. 10c), suggesting that condensate loss is less efficient than condensate production. At the end of this first phase of the ascent both sets of trajectories have a similar PE.
After , PE slowly increases for both sets of trajectories, but by it is slightly larger for convective trajectories. This shows that for PE the microphysical evolution at later stages of the ascent is decisive. During this period, the hydrometeor mass mixing ratio steadily decreases for convective trajectories, whereas it remains nearly constant or even slightly increases for slow trajectories (Fig. 10b). This suggests that with a similar condensate formation rate, precipitation efficiency rises more rapidly in convective trajectories than in slow ones. Notably, the median frozen precipitation shows no net loss of condensate mass for slow trajectories until , while it rapidly increases beyond for convective trajectories (Fig. 10c). This indicates that in slow trajectories, falling frozen precipitation does not collect much additional hydrometeors while passing through the considered parcels. Conversely, frozen precipitation in convective trajectories gathers significant additional condensate mass, amplifying sedimentation flux across the air parcel. Partitioning of frozen condensate reveals that convective trajectories contain a much larger proportion of graupel, while snow formation dominates in slow trajectories (Fig. 10e and f). Larger graupel mass mixing ratios are consistent with larger vertical velocities (Fig. C6d), a larger liquid fraction (Fig. 9e) and a more vertical than slantwise ascent (not shown) of convective trajectories. They also suggest efficient riming growth (Fig. C6c), which explains positive net frozen precipitation. Towards the end of the ascent and after full glaciation, i.e. , slow trajectories also have a positive net frozen precipitation, which is predominantly snow (not shown).
In summary, the dependence of PE on τ600 is due to different mixed-phase precipitation formation pathways controlled by vertical velocities and the availability of supercooled liquid. Riming growth dominates precipitation formation in convective trajectories, while aggregation and deposition are more important for hydrometeor growth in slow trajectories. This is consistent with findings in earlier studies on precipitation formation (Oertel et al., 2023). These distinct pathways, along with variations in mass growth rates and particle fall velocities, result in a lower PE for slow trajectories despite the longer time available for precipitation formation and sedimentation. Although PE appears reduced for very short τ600 ascent times, we refrain from further analysis due to the small number of trajectories in this category and the coarse time resolution of our trajectory (output) data.
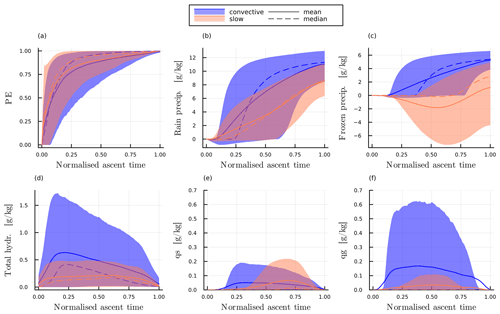
Figure 10(a) Precipitation efficiency PE; (b) net rain precipitation; (c) net frozen precipitation; and the (d) total hydrometeor, (e) snow and (f) graupel mass mixing ratio over the normalised ascent time. In all panels the mean (solid) and median (dashed) and the 10th and 90th percentiles (shaded) are plotted in blue for convective and orange for slow trajectories. Note: positive net precipitation signifies a loss of condensate from the trajectories from gravitational settling.
5.5 Trajectory characteristics after the ascent
Since virtually all hydrometeors at the end of the ascent are ice, the differences in hydrometeor contents in the hours after the ascent between convective and slow trajectories are also seen when looking only at ice particle mass and number concentrations (Fig. 11). The ice number concentration shows a particularly large difference, with convective trajectories containing up to 15 times more ice particles than slow trajectories directly at the end of the ascent. This difference remains large up to 24 h after the ascent, after which convective trajectories contain (on average) roughly 104 kg−1 ice particles and slow trajectories contain roughly ice particles (Fig. 11a). Ice mass mixing ratios for both groups are similar roughly 5 h after the end of the ascent (Fig. 11b). The initial strong decrease in number concentration and particle mass is due to sedimentation and aggregation of (large) ice crystals. This is reflected in the geometric radius of ice particles (Fig. 11c), which decreases with time. There is a small increase/stagnation of ice particle radius after 5 h, which is due to the production of new ice particles through homogeneous and heterogeneous freezing (not shown). Overall, the geometric radius of ice particles is smaller for convective trajectories than for slow trajectories. Convective trajectories therefore appear to produce clouds with longer lifetimes and greater optical thickness (more and smaller ice particles) than slow trajectories. These clouds also have lower temperatures, since convective trajectories ascend to lower pressures and temperatures (Fig. 5b). A key takeaway from this finding is that the radiative properties of clouds formed by air parcels in the WCB outflow depend on their ascent pathways. The significance of these differing radiative properties is further influenced by the extent to which WCB outflow clouds are overlaid by in situ cirrus clouds and the optical thickness of these cirrus layers.
In the hours after the ascent, RHi decreases faster for slow trajectories than for convective trajectories (Fig. 11d). For both groups the 90th percentile remains above 100 % even after 25 h, but the mean and median for convective trajectories are much larger. This is in part because in the hours after the ascent, convective trajectories keep ascending, whereas slow trajectories descend approximately 20 hPa after 20 h (not shown). Convective trajectories however also produce more ice particles that remain in the air parcel for longer, and they counteract the formation of subsaturation by sublimating in case the relative humidity goes below 100 %.
After the ascent, we can summarise the behaviour of trajectories by noting that convective trajectories remain supersaturated for longer periods (up to more than a day) and retain a higher ice number and mass concentrations much longer than slow trajectories.
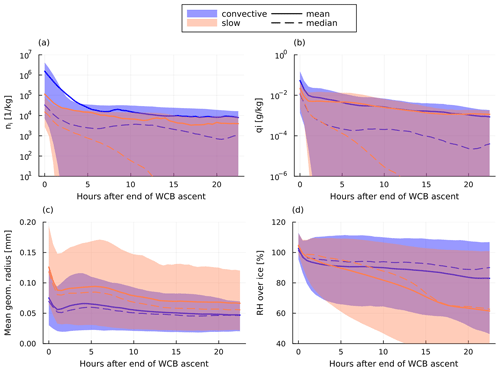
Figure 11The (a) ice number concentration, (b) ice mass concentration, (c) mean geometric radius of ice particles and (d) relative humidity over ice in the hours after the end of the WCB ascent. The mean (solid) and median (dashed) and the 10th and 90th percentiles (shaded) are plotted in blue for convective and orange for slow trajectories.
In this paper, we investigate moisture transport into the UTLS by a WCB that occurred on 23 September 2017. Our analysis is based on numerical simulations using the ICON model in a double-nested, convective-permitting setup and utilises high-resolution air mass trajectory data from the ICON online trajectory module.
After selecting trajectories that ascend at least 600 hPa within 48 h (our definition of a WCB trajectory), we first investigated their ascent behaviour. Various ascent-time metrics suggest an abundance of fast, convective ascent in the WCB: 78 % of all trajectories experience a 0.5 h period in which the average ascent velocity is larger than 120 hPa h−1. The fast ascent for most trajectories does not extend over the full 600 hPa ascent, consistent with recent observations of embedded convection in the WCB (Blanchard et al., 2020). A small fraction of WCB trajectories (∼ 5 %) completes the entire WCB ascent in few hours. Hence, (embedded) convection is confirmed as an ubiquitous feature also in the WCB investigated here. The distribution of 600 hPa (τ600) is similar in structure to earlier investigations of Rasp et al. (2016) and Oertel et al. (2021, 2023), although unsurprisingly case-to-case variations in the fraction of very fast-ascending trajectories emerge.
Next, we analysed how moisture content and thermodynamic conditions change at the beginning, during and at the end of the WCB ascent and how these changes vary across different ascent timescales. To highlight the impact of different ascent timescales we contrast properties from trajectories with ascent timescales of less than 5 h (“convective” trajectories) and those with ascent timescales more than 20 h (“slow” trajectories). The convective trajectories begin their ascent at higher temperatures and pressures than slow trajectories and therefore have larger specific humidity values at the start of the ascent. Only small variations in the initial hydrometeor content are found. By the end of the ascent, all WCB trajectories have lost more than 95 % of their initial moisture. However, there is substantial variability in the outflow moisture content: total moisture varies by roughly a factor of 10 across all trajectories (∼ 0.05 to ) and about a factor of 3 if the median values per ascent timescale are considered (∼0.1 to ). Our analysis of moisture loss pathways suggest that 80 % to 90 % of moisture is lost by precipitation formation (predominantly rain). Turbulent mixing is more prominent for slow trajectories but still only contributes up to 20 % of moisture loss and mainly occurs at pressures larger than 700 hPa.
Variability in end-of-ascent moisture content primarily reflects differences in specific humidity, with slow trajectories showing higher values than convective ones, opposite to their initial conditions. This is largely due to colder outflow temperatures for convective trajectories and the strong correlation between specific humidity and temperature. While deviations from the saturation specific humidity are of secondary importance, they may still influence the evolution of outflow cirrus clouds. The fraction of supersaturated trajectories is larger for slow (80 %) than for convective trajectories (56.5 %). It is shown that the final partitioning between water vapour and condensate is strongly influenced by the temperature at which air parcels fully glaciate, as well as the number of ice crystals present at temperatures below approximately −20 °C. Slow trajectories glaciate earlier than fast trajectories and contain fewer ice crystals.
Hydrometeor content at end of the ascent is generally small. The median hydrometeor content slightly decreases with decreasing ascent timescales but strongly increases for trajectories with ascent timescales less than about 3 h (the mean increases for ascent timescales less than about 10 h). The evolution of microphysical properties and precipitation loss during the WCB ascent suggest that the increasing efficiency of condensate removal towards shorter timescales is driven by a transition of the precipitation formation pathway from deposition–aggregation-dominated to riming-dominated. The strong decrease in removal efficiency for the shortest ascent timescales may be driven by a decreasing ratio of the ascent timescale to the precipitation formation timescale. However, the output frequency of trajectory data is too small to allow for an in-depth analysis of the microphysical evolution of these trajectories.
Finally, we investigate the evolution of WCB outflow after the end of the ascent. While hydrometeors contribute little to the total moisture transport to the UTLS (except for an ascent timescale less than 10 h), they contribute to the WCB-associated cirrus clouds and therefore are important for cloud radiative heating. At the end of the ascent, convective trajectories have roughly twice the ice crystal number concentration of slow trajectories, although both have similar ice crystal mass. This difference in ice crystal concentration affects the mean geometric radius of the crystals, which in turn influences the cloud's lifetime, along with variations in the outflow position and the associated vertical motion. Specifically, the median ice mass mixing ratio in convective outflow cirrus clouds remains above 0.1 mg kg−1 for about 15 h, whereas in cirrus clouds formed from slow trajectories, this median value drops below 0.1 mg kg−1 after about 5 h.
The physical processes governing the moisture transport into the UTLS are captured by non-dimensional metrics of the Lagrangian moisture budget and provide a concise overview thereof:
-
DRmix generally increases with τ600 highlighting stronger moisture loss through turbulent processes.
-
CR increases with decreasing τ600 reflecting the larger fraction of initial humidity converted to condensate for fast-ascending trajectories. This tendency is mainly due to larger vertical displacement and colder outflow temperatures with a secondary contribution of a smaller fraction of supersaturated trajectories for fast-ascending trajectories.
-
PE slightly increases with decreasing τ600 due to a shift in the dominant precipitation formation pathway towards riming-dominated. For very short τ600 ascent times, PE decreases substantially, resulting in a large hydrometeor mass mixing ratio in the WCB outflow.
The findings presented in this paper are broadly consistent with the limited number of earlier studies on the cloud and updraught structure of WCB clouds (Rasp et al., 2016; Oertel et al., 2019, 2021, 2023; Binder et al., 2020; Blanchard et al., 2020, 2021). Most of these studies focus on the ascent characteristics and mid-level latent heating distribution. Both modelling and observational case studies suggest significant variability in the vertical velocities with ubiquitous rapid-ascent segments. The modelling studies of Oertel et al. (2019, 2021, 2023) suggest different latent heating structures and microphysical pathways for precipitation formation for different local vertical velocity. On a climatological scale, the analysis of CloudSat and CALIPSO (Cloud-Aerosol Lidar and Infrared Pathfinder Satellite Observations) data by Binder et al. (2020) supports the ubiquitous presence of rapid-ascent segments with different microphysical characteristics, i.e. reflectivity structure. However, we are not aware of an earlier study quantifying the impact of the mesoscale variability in ascent characteristics on the moisture import into the UTLS and WCB outflow cirrus clouds. While the consistency in mid-level cloud characteristics with earlier studies suggests model results presented here are physically plausible, the ICON model and in particular the representation of microphysical processes therein have some important limitations: first, the ICON model uses a saturation adjustment scheme, which enforces water-saturated conditions in mixed- and warm-phase cloud regions. Secondly, the parameterisation of ice formation (primary and secondary) still involves large uncertainties, which may influence the glaciation of WCB clouds. Therefore, the verification of our key results with observational data is strongly warranted and is planned for a follow-up study. However, an obstacle to this is the sparsity of high-quality (in-cloud) humidity data in the altitude range between 300 and 100 hPa.
Despite the pending verification with observational data, we think our findings are important, as they suggest that lower-resolution models with parameterised convection likely do not adequately capture the mesoscale variability in moisture transport and cirrus properties. Specifically, they may underestimate the intensity of convection in WCBs and therefore incorrectly model the transport of hydrometeors and moisture to the UTLS. This could have implications for studies that aim to determine the role of WCBs in Earth's climate. For instance, Joos (2019) conducted a WCB climatology using the ERA-Interim dataset (which parameterises convection) and found that WCBs usually have a cooling effect when located further south in the early stages of their development and a heating effect further north later on. The balance between the cooling and heating effect over the cyclone life cycle may be affected by the preferential occurrence of convective trajectories in the southern part of the WCB outflow and the associated long-lived cirrus clouds with comparably small effective radii. Additionally, the possible mis- or under-representation of microphysical processes during the WCB ascent could impact studies that investigate the role of WCBs in the formation of precipitation extremes (Catto et al., 2015) and forecast inaccuracies (Grams et al., 2011; Grams and Archambault, 2016; Martínez‐Alvarado et al., 2015). This study demonstrates that the mesoscale updraught structure directly influences the moisture distribution within the WCB outflow in the UTLS. This suggests a pathway for error growth and climatological impacts of mesoscale structures beyond their effects on potential vorticity. Accurately capturing mesoscale variability is therefore essential for quantifying the impact of WCBs on extratropical weather and climate.
The results presented in this paper are strictly only valid for the analysed WCB case, which we have selected to represent a typical, non-extreme event of an open-ocean WCB. While we believe our findings provide valuable insights into WCB moisture transport and may be applicable to similar WCB cases, the extent to which they apply to the larger WCB population remains to be addressed in future studies. Furthermore, some of the findings summarised above may depend on the particular parameterisation setup used in the analysed simulation, such as the specific microphysics scheme and the absence of a deep-convection parameterisation. The influence of these model-specific factors on our key findings is currently being assessed through model sensitivity experiments and comparisons with observational data.
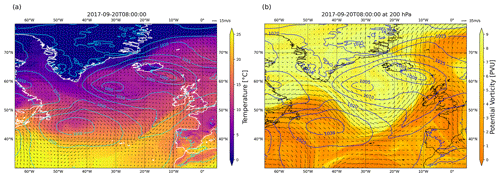
Figure A1Snapshot of the northern Atlantic at 08:00 UTC on 20 September 2017. (a) The 2 m temperature (heatmap), sea-level pressure (contours) and 10 m wind field (arrows). (b) The upper-level PV (heatmap) and wind field (arrows) at 200 hPa and sea-level pressure (contours). The combining winds from the high-pressure system (−45° W, 45° N) and the low-pressure system (−30° W, 58° N) blow a cold air mass over the northern Atlantic.
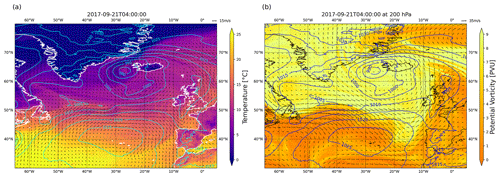
Figure A2Snapshot of the northern Atlantic at 04:00 UTC on 21 September 2017. (a) The 2 m temperature (heatmap), sea-level pressure (contours) and 10 m wind field (arrows). (b) The upper-level PV (heatmap) and wind field (arrows) at 200 hPa and sea-level pressure (contours). The low-pressure system starts forming at −45° W, 53° N, where the winds converge. At the same time, an upper-level PV ridge (−55° W, 55° N) approaches from the west.
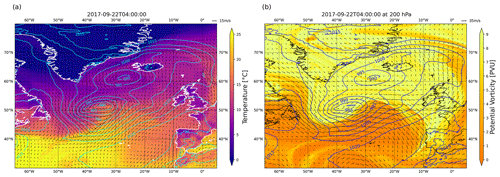
Figure A3Snapshot of the northern Atlantic at 04:00 UTC on 22 September 2017. (a) The 2 m temperature (heatmap), sea-level pressure (contours) and 10 m wind field (arrows). (b) The upper-level PV (heatmap) and wind field (arrows) at 200 hPa and sea-level pressure (contours). The cyclone has undergone explosive cyclogenesis due to the upper-level PV anomaly inducing cyclonic rotation in the atmospheric column.
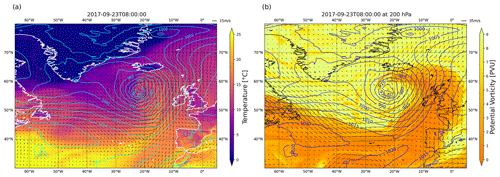
Figure A4Snapshot of the northern Atlantic at 08:00 UTC on 23 September 2017. (a) The 2 m temperature (heatmap), sea-level pressure (contours) and 10 m wind field (arrows). (b) The upper-level PV (heatmap) and wind field (arrows) at 200 hPa and sea-level pressure (contours). The cyclone has assumed the typical WCB comma shape and is transporting low PV into the upper atmosphere. The northern tip of the WCB reaches Iceland.
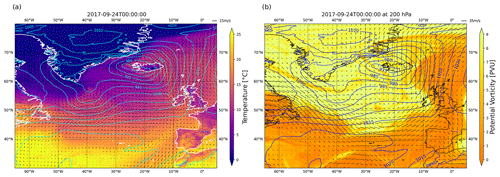
Figure A5Snapshot of the northern Atlantic at 00:00 UTC on 24 September 2017. (a) The 2 m temperature (heatmap), sea-level pressure (contours) and 10 m wind field (arrows). (b) The upper-level PV (heatmap) and wind field (arrows) at 200 hPa and sea-level pressure (contours). The cyclone begins to dissipate over northern Europe and has created an upper-level trough.
In this section, we define, describe and/or derive variables that we use in this paper to formulate Lagrangian versions of DR, PE and CR (Sect. 2.6.2, 2.6.3). Finally, we compare our Lagrangian versions with Eulerian versions from previous studies and show how they can be heuristically related.
B1 Total moisture content
The total moisture content is defined as follows
B2 Moisture removal by mixing processes
The total moisture removed by mixing processes is defined as a function of normalised ascent time as follows:
is the accumulated moisture removed from the parcel by the turbulent diffusion scheme and is defined as
is the accumulated moisture removed from the parcel by the convection scheme, which is only of consequence when a trajectory is outside either of the nested domains. It is defined as
For detailed explanation of qxturb and qxconv, see Supplement. Finally, is the residual term which accounts for the accumulated moisture lost due to numerical and interpolation errors. It is defined as
This term is necessary because although the online trajectory scheme provides highly accurate data computed at each time step using the Eulerian wind fields from ICON, numerical errors cannot be completely avoided. In each time step, the trajectory equation () is solved to calculate the new trajectory position (Miltenberger et al., 2013). The wind field implied by this solution may differ slightly from that given by ICON, leading to the first possible source of uncertainty. Variables from the ICON Eulerian grid are then linearly interpolated to the new trajectory position, providing the second source of uncertainty. One of the consequences of this is that the moisture budget, calculated by summing the total water content and all possible moisture removal/addition mechanisms, is not closed:
The numerical residual term is defined such that it closes the moisture budget. We can split up the residual into the water vapour and the hydrometeor residual ( and , respectively):
These terms are defined as
and
where we use , and from Sect. 2.6 and define as the sum over all microphysical processes that change the vapour/hydrometeor content (written now without time dependence):
These processes are described in the Supplement.
B3 Lagrangian net precipitation rate
The Lagrangian net precipitation rate is defined as follows:
The variables and , in the Lagrangian framework of online trajectories, are the time-integrated rates of hydrometeors entering the parcel from above (in) and leaving it at its lower edge (out) at the ascent time . Note that this means that we are not talking about surface precipitation but precipitation out of the Lagrangian air parcel. We refer to as fluxes. Calculating precipitation in this way ensures that only precipitation formed (or grown) within the parcel is taken into account. A net precipitation rate of 0 therefore means that any precipitation entering the parcel from above does not collect (and thus remove) any additional water and is equal to the precipitation leaving the parcel at its lower edge.
B4 Additional microphysical variables for derivation of PE and CR
B4.1 Lagrangian hydrometeor growth term (Chy)
The hydrometeor growth term is the sum of all microphysical processes that convert moisture into hydrometeors. It is given by
where we have the sum of condensation (cond), cloud condensation nuclei (CCN) nucleation (qcnuc), homogeneous and heterogeneous ice nucleation (qihh), and deposition (depo) (see Supplement).
B4.2 Lagrangian vapour growth term (Ev)
The Lagrangian vapour growth term is the sum over all microphysical processes that increase the vapour content by evaporating ice or sublimating water. It is given by
where we have the evaporation of cloud drops (evap); evaporation of rain (revap); sublimation of snow, graupel and hail (fevap); and the sublimation of ice (subl) (see Supplement).
B4.3 Hydrometeor/water vapour tendency (Qhy,tc(t̃) and Qv,tc(t̃))
The hydrometeor/water vapour tendency gives the accumulated hydrometeor/water vapour mass transported out of the air parcel during the ascent through either the turbulence or the convection scheme. For hydrometeors and vapour, respectively, it is given by
Here we use the corrected turbulence tendencies qcturc and qvturc that account for the strong instantaneous compensation between process rates from the turbulence scheme and the second call to the saturation adjustment in ICON (see Supplement).
B4.4 Net initial hydrometeor/vapour content (HYD and VAP)
Using these variables (and the numerical hydrometeor/water vapour residuals and ), we formulate the net initial hydrometeor content,
and the net initial vapour content,
These terms are almost equal to the initial hydrometeor/vapour content but take into account additional hydrometeors/vapour transported in or out of the parcels by the turbulence or convection scheme (or numerical residuals). We create these terms because we follow the following logic: hydrometeors that precipitate out of a parcel but were brought in by turbulence, for example, should not be counted as precipitation formed within the parcel. Using only the initial hydrometeor/vapour contents would mean that we could, theoretically, see more precipitation “formation” than we have initial total water, which would be confusing.
B5 Comparison of PE, CR and DR to Eulerian variables
We can compare our Lagrangian definitions of PE, CR and DRmphys to the Eulerian definitions from Miltenberger (2014) by making simplifications. If we let Qtcr(1) and Qhy(0) go to 0 (i.e. we neglect the initial hydrometeor content, all numerical residuals, and all transport by the turbulence and convection scheme), we get
which reduces to
These definitions are similar to those from Miltenberger (2014). The simplifications we have may also result in DRmix=0, meaning that . We have thus shown that our Lagrangian definitions of DR, PE and CR can be understood as generalisations of those in the Eulerian framework (or alternatively, the Eulerian definitions from Miltenberger, 2014, are special cases that neglect initial hydrometeor contents, numerical residuals, and transport by turbulence and convection schemes).
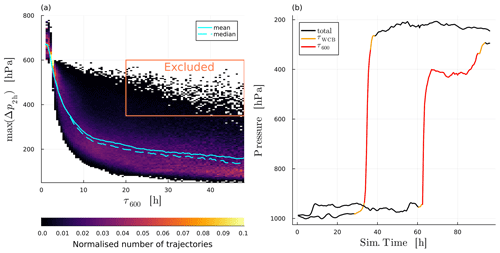
Figure C1(a) The pressure course for two example trajectories, one convective and one slow, showing that some trajectories ascend convectively but not for the entire 600 hPa. (b) The maximum pressure velocity over 2 h for each trajectory (max(Δp2 h)) as a two-dimensional normalised trajectory over τ600. Trajectories that fall into the orange square are excluded from the analysis.
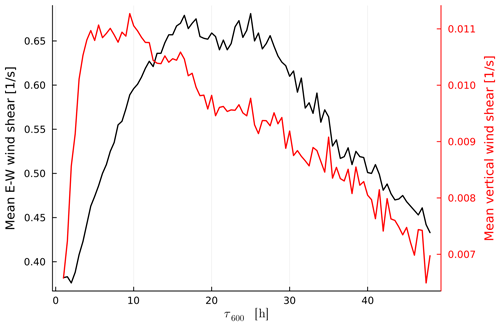
Figure C2Mean horizontal (black, left y axis) and vertical (red, right y axis) wind shear for all data points along the WCB ascent for trajectories over τ600.
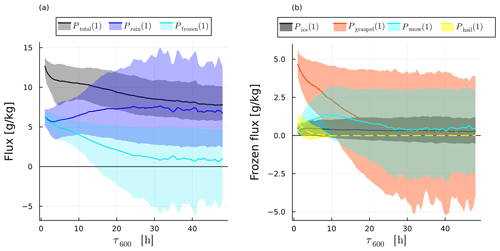
Figure C3(a) The median total (black), warm-phase (blue) and cold-phase (cyan) precipitation flux by the end of the ascent, with the 10th and 90th percentiles shaded. (b) The individual contributions to the cold-phase flux. Ice (black), graupel (red), snow (cyan) and hail (dashed yellow line; note: zero everywhere except for τ600<10 h).
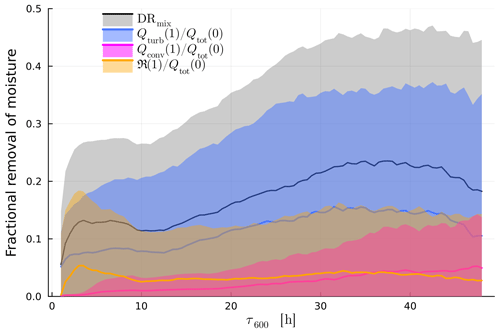
Figure C4Mean DRmix (black) with individual contributions from turbulence (blue), convection (red) and numerical residual (yellow). The 10th and 90th percentiles shaded.
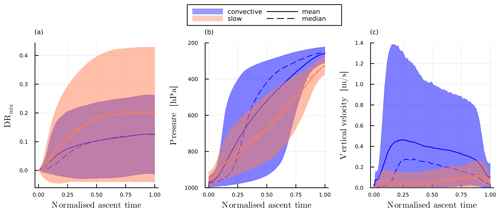
Figure C5(a) DRmix, (b) pressure and (c) vertical velocity over normalised ascent time. In all panels the mean (solid) and median (dashed) and the 10th and 90th percentiles (shaded) are plotted in blue for convective and orange for slow trajectories.
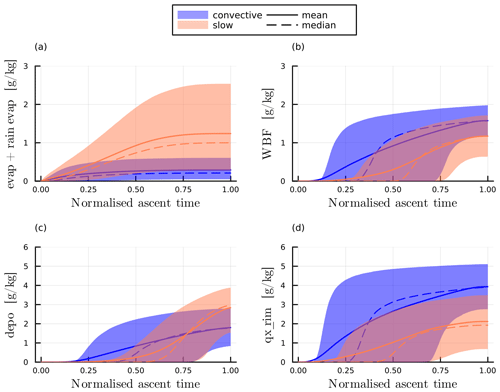
Figure C6(a) Time-integrated evaporation, (b) Wegener–Bergeron–Findeisen, (c) deposition and (d) riming rate over normalised ascent time. In all panels the mean (solid) and median (dashed) and the 10th and 90th percentiles (shaded) are plotted in blue for convective and orange for slow trajectories.
The ICON source code is distributed under an institutional licence issued by the German Weather Service (DWD). The model output of the ICON simulation is available from the authors upon request. The code and data necessary to recreate the results shown here are available at https://doi.org/10.5281/zenodo.13913564 (Schwenk and Miltenberger, 2024).
The supplement related to this article is available online at: https://doi.org/10.5194/acp-24-14073-2024-supplement.
CS and AM designed the experiment and conducted the numerical simulations. AM implemented the online diagnostics, and CS wrote the post-processing code. CS and AM worked jointly on the interpretation of the results. CS drafted the final manuscript with contributions from AM.
The contact author has declared that neither of the authors has any competing interests.
Publisher’s note: Copernicus Publications remains neutral with regard to jurisdictional claims made in the text, published maps, institutional affiliations, or any other geographical representation in this paper. While Copernicus Publications makes every effort to include appropriate place names, the final responsibility lies with the authors.
This work was funded by the Deutsche Forschungsgemeinschaft (DFG, German Research Foundation) through TRR 301 (project no. 428312742; The Tropopause Region in a Changing Atmosphere) sub-project B08 coordinated by Annette Miltenberger. The authors gratefully acknowledge the computing time granted on the supercomputer MOGON 2 at Johannes Gutenberg University Mainz (https://hpc.uni-mainz.de/ last access: 9 December 2024), which is a member of the AHRP (Alliance for High Performance Computing Rhineland-Palatinate, https://www.ahrp.info/, last access: 9 December 2024) and the Gauß-Allianz e.V. We further thank Annika Oertel for useful discussion input and sharing her ICON setup used in Oertel et al. (2023).
This research has been supported by the Deutsche Forschungsgemeinschaft (grant no. 428312742).
This paper was edited by Peter Haynes and reviewed by two anonymous referees.
Barstad, I., Grabowski, W. W., and Smolarkiewicz, P. K.: Characteristics of large-scale orographic precipitation: Evaluation of linear model in idealized problems, J. Hydrol., 340, 78–90, https://doi.org/10.1016/j.jhydrol.2007.04.005, 2007. a, b
Barthlott, C., Zarboo, A., Matsunobu, T., and Keil, C.: Impacts of combined microphysical and land-surface uncertainties on convective clouds and precipitation in different weather regimes, Atmos. Chem. Phys., 22, 10841–10860, https://doi.org/10.5194/acp-22-10841-2022, 2022. a
Bechtold, P., Köhler, M., Jung, T., Doblas-Reyes, F., Leutbecher, M., Rodwell, M. J., Vitart, F., and Balsamo, G.: Advances in simulating atmospheric variability with the ECMWF model: From synoptic to decadal time-scales, Q. J. Roy. Meteorol. Soc., 134, 1337–1351, https://doi.org/10.1002/qj.289, 2008. a
Berman, J. D. and Torn, R. D.: The Impact of Initial Condition and Warm Conveyor Belt Forecast Uncertainty on Variability in the Downstream Waveguide in an ECWMF Case Study, Mon. Weather Rev., 147, 4071–4089, https://doi.org/10.1175/mwr-d-18-0333.1, 2019. a
Binder, H., Boettcher, M., Joos, H., and Wernli, H.: The Role of Warm Conveyor Belts for the Intensification of Extratropical Cyclones in Northern Hemisphere Winter, J. Atmos. Sci., 73, 3997–4020, https://doi.org/10.1175/jas-d-15-0302.1, 2016. a, b
Binder, H., Boettcher, M., Joos, H., Sprenger, M., and Wernli, H.: Vertical cloud structure of warm conveyor belts – a comparison and evaluation of ERA5 reanalysis, CloudSat and CALIPSO data, Weather Clim. Dynam., 1, 577–595, https://doi.org/10.5194/wcd-1-577-2020, 2020. a, b, c
Blanchard, N., Pantillon, F., Chaboureau, J.-P., and Delanoë, J.: Organization of convective ascents in a warm conveyor belt, Weather Clim. Dynam., 1, 617–634, https://doi.org/10.5194/wcd-1-617-2020, 2020. a, b, c
Blanchard, N., Pantillon, F., Chaboureau, J.-P., and Delanoë, J.: Mid-level convection in a warm conveyor belt accelerates the jet stream, Weather Clim. Dynam., 2, 37–53, https://doi.org/10.5194/wcd-2-37-2021, 2021. a
Catto, J. L., Madonna, E., Joos, H., Rudeva, I., and Simmonds, I.: Global Relationship between Fronts and Warm Conveyor Belts and the Impact on Extreme Precipitation, J. Climate, 28, 8411–8429, https://doi.org/10.1175/jcli-d-15-0171.1, 2015. a
Choudhary, A. and Voigt, A.: Impact of grid spacing, convective parameterization and cloud microphysics in ICON simulations of a warm conveyor belt, Weather Clim. Dynam., 3, 1199–1214, https://doi.org/10.5194/wcd-3-1199-2022, 2022. a
Dacre, H. F., Martinez‐Alvarado, O., and Hodges, K. I.: Precipitation efficiencies in a climatology of Southern Ocean extratropical cyclones, J. Geophys. Res.-Atmos., 128, e2023JD039239, https://doi.org/10.1029/2023jd039239, 2023. a
Dearden, C., Vaughan, G., Tsai, T., and Chen, J.-P.: Exploring the Diabatic Role of Ice Microphysical Processes in Two North Atlantic Summer Cyclones, Mon. Weather Rev., 144, 1249–1272, https://doi.org/10.1175/mwr-d-15-0253.1, 2016. a
Eckhardt, S., Stohl, A., Wernli, H., James, P., Forster, C., and Spichtinger, N.: A 15-Year Climatology of Warm Conveyor Belts, J. Climate, 17, 218–237, https://doi.org/10.1175/1520-0442(2004)017<0218:aycowc>2.0.co;2, 2004. a
Flaounas, E., Kotroni, V., Lagouvardos, K., Gray, S. L., Rysman, J.-F., and Claud, C.: Heavy rainfall in Mediterranean cyclones. Part I: contribution of deep convection and warm conveyor belt, Clim. Dynam., 50, 2935–2949, https://doi.org/10.1007/s00382-017-3783-x, 2017. a, b
Gehring, J., Oertel, A., Vignon, É., Jullien, N., Besic, N., and Berne, A.: Microphysics and dynamics of snowfall associated with a warm conveyor belt over Korea, Atmos. Chem. Phys., 20, 7373–7392, https://doi.org/10.5194/acp-20-7373-2020, 2020. a
Gettelman, A., Hoor, P., Pan, L. L., Randel, W. J., Hegglin, M. I., and Birner, T.: The extratropical upper troposphere and lower stratosphere, Rev. Geophys., 49, RG3003, https://doi.org/10.1029/2011rg000355, 2011. a
Grams, C. M. and Archambault, H. M.: The Key Role of Diabatic Outflow in Amplifying the Midlatitude Flow: A Representative Case Study of Weather Systems Surrounding Western North Pacific Extratropical Transition, Mon. Weather Rev., 144, 3847–3869, https://doi.org/10.1175/mwr-d-15-0419.1, 2016. a
Grams, C. M., Wernli, H., Böttcher, M., Čampa, J., Corsmeier, U., Jones, S. C., Keller, J. H., Lenz, C.-J., and Wiegand, L.: The key role of diabatic processes in modifying the upper-tropospheric wave guide: a North Atlantic case-study, Q. J. Roy.Meteorol. Soc., 137, 2174–2193, https://doi.org/10.1002/qj.891, 2011. a, b
Hande, L. B., Engler, C., Hoose, C., and Tegen, I.: Seasonal variability of Saharan desert dust and ice nucleating particles over Europe, Atmos. Chem. Phys., 15, 4389–4397, https://doi.org/10.5194/acp-15-4389-2015, 2015. a
Hansen, J., Lacis, A., Rind, D., Russell, G., Stone, P., Fung, I., Ruedy, R., and Lerner, J.: Climate sensitivity: Analysis of feedback mechanisms, 130–163 pp., American Geophysical Union, https://doi.org/10.1029/gm029p0130, 1984. a
Haynes, P. and Palm, M.: Special issue on WISE: Wave-driven isentropic exchange in the extratropical upper troposphere and lower stratosphere, Atmospheric Chemistry and Physics, https://acp.copernicus.org/articles/special_issue1061.html (last access: 9 December 2024), 2023. a
Held, I. M. and Soden, B. J.: Water Vapor Feedback and Global Warming, Annu. Rev. Ener. Environ., 25, 441–475, https://doi.org/10.1146/annurev.energy.25.1.441, 2000. a
Hersbach, H., Bell, B., Berrisford, P., Hirahara, S., Horányi, A., Muñoz-Sabater, J., Nicolas, J., Peubey, C., Radu, R., Schepers, D., Simmons, A., Soci, C., Abdalla, S., Abellan, X., Balsamo, G., Bechtold, P., Biavati, G., Bidlot, J., Bonavita, M., Chiara, G., Dahlgren, P., Dee, D., Diamantakis, M., Dragani, R., Flemming, J., Forbes, R., Fuentes, M., Geer, A., Haimberger, L., Healy, S., Hogan, R. J., Hólm, E., Janisková, M., Keeley, S., Laloyaux, P., Lopez, P., Lupu, C., Radnoti, G., Rosnay, P., Rozum, I., Vamborg, F., Villaume, S., and Thépaut, J.-N.: The ERA5 global reanalysis, Q. J. Roy. Meteorol. Soc., 146, 1999–2049, https://doi.org/10.1002/qj.3803, 2020. a
Hieronymus, M., Baumgartner, M., Miltenberger, A., and Brinkmann, A.: Algorithmic Differentiation for Sensitivity Analysis in Cloud Microphysics, J. Adv. Model. Earth Syst., 14, e2021MS002849, https://doi.org/10.1029/2021ms002849, 2022. a
Joos, H.: Warm Conveyor Belts and Their Role for Cloud Radiative Forcing in the Extratropical Storm Tracks, J. Climate, 32, 5325–5343, https://doi.org/10.1175/jcli-d-18-0802.1, 2019. a, b, c, d, e, f
Joos, H. and Wernli, H.: Influence of microphysical processes on the potential vorticity development in a warm conveyor belt: a case‐study with the limited‐area model COSMO, Q. J. Roy. Meteorol. Soc., 138, 407–418, https://doi.org/10.1002/qj.934, 2011. a
Joos, H., Sprenger, M., Binder, H., Beyerle, U., and Wernli, H.: Warm conveyor belts in present-day and future climate simulations – Part 1: Climatology and impacts, Weather Clim. Dynam., 4, 133–155, https://doi.org/10.5194/wcd-4-133-2023, 2023. a
Khain, A. P., Beheng, K. D., Heymsfield, A., Korolev, A., Krichak, S. O., Levin, Z., Pinsky, M., Phillips, V., Prabhakaran, T., Teller, A., van den Heever, S. C., and Yano, J.-I.: Representation of microphysical processes in cloud-resolving models: Spectral (bin) microphysics versus bulk parameterization, Rev. Geophys., 53, 247–322, https://doi.org/10.1002/2014rg000468, 2015. a
Li, L., Chen, Z., Wang, B., Fan, J., Lu, T., and Lv, K.: Response of upper tropospheric water vapor to global warming and ENSO, Sci. Rep., 14, 5995, https://doi.org/10.1038/s41598-024-56639-5, 2024. a
Lott, F. and Miller, M. J.: A new subgrid-scale orographic drag parametrization: Its formulation and testing, Q. J. Roy. Meteorol. Soc., 123, 101–127, https://doi.org/10.1002/qj.49712353704, 1997. a
Madonna, E., Wernli, H., Joos, H., and Martius, O.: Warm Conveyor Belts in the ERA-Interim Dataset (1979–2010). Part I: Climatology and Potential Vorticity Evolution, J. Climate, 27, 3–26, https://doi.org/10.1175/jcli-d-12-00720.1, 2014. a, b, c, d
Martínez‐Alvarado, O., Madonna, E., Gray, S. L., and Joos, H.: A route to systematic error in forecasts of Rossby waves, Q. J. Roy. Meteorol. Soc., 142, 196–210, https://doi.org/10.1002/qj.2645, 2015. a
Mazoyer, M., Ricard, D., Rivière, G., Delanoë, J., Arbogast, P., Vié, B., Lac, C., Cazenave, Q., and Pelon, J.: Microphysics Impacts on the Warm Conveyor Belt and Ridge Building of the NAWDEX IOP6 Cyclone, Mon. Weather Rev., 149, 3961–3980, https://doi.org/10.1175/mwr-d-21-0061.1, 2021. a
Mazoyer, M., Ricard, D., Rivière, G., Delanoë, J., Riette, S., Augros, C., Borderies, M., and Vié, B.: Impact of Mixed-Phase Cloud Parameterization on Warm Conveyor Belts and Upper-Tropospheric Dynamics, Mon. Weather Rev., 151, 1073–1091, https://doi.org/10.1175/mwr-d-22-0045.1, 2023. a
Miltenberger, A.: Lagrangian Perspective on Dynamic and Microphysical Processes in Orographically Forced Flows, Ph.D. thesis, https://doi.org/10.3929/ETHZ-A-010406950, 2014. a, b, c, d, e, f, g, h
Miltenberger, A. K., Pfahl, S., and Wernli, H.: An online trajectory module (version 1.0) for the nonhydrostatic numerical weather prediction model COSMO, Geosci. Model Dev., 6, 1989–2004, https://doi.org/10.5194/gmd-6-1989-2013, 2013. a, b
Miltenberger, A. K., Reynolds, S., and Sprenger, M.: Revisiting the latent heating contribution to foehn warming: Lagrangian analysis of two foehn events over the Swiss Alps, Q. J. Roy. Meteorol. Soc., 142, 2194–2204, https://doi.org/10.1002/qj.2816, 2016. a, b
Miltenberger, A. K., Lüttmer, T., and Siewert, C.: Secondary Ice Formation in Idealised Deep Convection–Source of Primary Ice and Impact on Glaciation, Atmosphere, 11, 542, https://doi.org/10.3390/atmos11050542, 2020. a, b
Oertel, A., Boettcher, M., Joos, H., Sprenger, M., Konow, H., Hagen, M., and Wernli, H.: Convective activity in an extratropical cyclone and its warm conveyor belt – a case-study combining observations and a convection-permitting model simulation, Q. J. Roy. Meteorol. Soc., 145, 1406–1426, https://doi.org/10.1002/qj.3500, 2019. a, b, c
Oertel, A., Boettcher, M., Joos, H., Sprenger, M., and Wernli, H.: Potential vorticity structure of embedded convection in a warm conveyor belt and its relevance for large-scale dynamics, Weather Clim. Dynam., 1, 127–153, https://doi.org/10.5194/wcd-1-127-2020, 2020. a, b
Oertel, A., Sprenger, M., Joos, H., Boettcher, M., Konow, H., Hagen, M., and Wernli, H.: Observations and simulation of intense convection embedded in a warm conveyor belt – how ambient vertical wind shear determines the dynamical impact, Weather Clim. Dynam., 2, 89–110, https://doi.org/10.5194/wcd-2-89-2021, 2021. a, b, c, d
Oertel, A., Pickl, M., Quinting, J. F., Hauser, S., Wandel, J., Magnusson, L., Balmaseda, M., Vitart, F., and Grams, C. M.: How warm conveyor belt activity across the North Pacific influenced the predictability of the North American heat wave 2021, EMS Annual Meeting, https://doi.org/10.5194/ems2022-227, 2022. a
Oertel, A., Miltenberger, A. K., Grams, C. M., and Hoose, C.: Interaction of microphysics and dynamics in a warm conveyor belt simulated with the ICOsahedral Nonhydrostatic (ICON) model , Atmos. Chem. Phys., 23, 8553–8581, https://doi.org/10.5194/acp-23-8553-2023, 2023. a, b, c, d, e, f, g, h, i, j, k, l
Orr, A., Bechtold, P., Scinocca, J., Ern, M., and Janiskova, M.: Improved middle atmosphere climate and forecasts in the ECMWF model through a non-orographic gravity wave drag parametrization, ECMWF, https://doi.org/10.21957/DM64CMPJ, 2010. a
Pfahl, S., Madonna, E., Boettcher, M., Joos, H., and Wernli, H.: Warm Conveyor Belts in the ERA-Interim Dataset (1979–2010). Part II: Moisture Origin and Relevance for Precipitation, J. Climate, 27, 27–40, https://doi.org/10.1175/jcli-d-13-00223.1, 2014. a
Pfahl, S., Schwierz, C., Croci-Maspoli, M., Grams, C. M., and Wernli, H.: Importance of latent heat release in ascending air streams for atmospheric blocking, Nat. Geosci., 8, 610–614, https://doi.org/10.1038/ngeo2487, 2015. a
Pickl, M., Quinting, J. F., and Grams, C. M.: Warm conveyor belts as amplifiers of forecast uncertainty, Q. J. Roy. Meteorol. Soc., 149, 3064–3085, https://doi.org/10.1002/qj.4546, 2023. a, b
Purvis, R. M., Lewis, A. C., Carney, R. A., McQuaid, J. B., Arnold, S. R., Methven, J., Barjat, H., Dewey, K., Kent, J., Monks, P. S., Carpenter, L. J., Brough, N., Penkett, S. A., and Reeves, C. E.: Rapid uplift of nonmethane hydrocarbons in a cold front over central Europe, J. Geophys. Res.-Atmos., 108, 4224, https://doi.org/10.1029/2002jd002521, 2003. a
Rasp, S., Selz, T., and Craig, G. C.: Convective and Slantwise Trajectory Ascent in Convection-Permitting Simulations of Midlatitude Cyclones, Mon. Weather Rev., 144, 3961–3976, https://doi.org/10.1175/mwr-d-16-0112.1, 2016. a, b, c, d, e, f, g
Rodwell, M., Forbes, R., and Wernli, H.: Why warm conveyor belts matter in NWP, ECMWF, https://doi.org/10.21957/MR20VG, 2018. a
Rossa, A. M., Wernli, H., and Davies, H. C.: Growth and Decay of an Extra-Tropical Cyclone’s PV-Tower, Meteorol. Atmos. Phys., 73, 139–156, https://doi.org/10.1007/s007030050070, 2000. a
Schäfler, A. and Harnisch, F.: Impact of the inflow moisture on the evolution of a warm conveyor belt, Q. J. Roy. Meteorol. Soc., 141, 299–310, https://doi.org/10.1002/qj.2360, 2014. a
Seifert, A. and Beheng, K. D.: A two-moment cloud microphysics parameterization for mixed-phase clouds. Part 1: Model description, Meteorol. Atmos. Phys., 92, 45–66, https://doi.org/10.1007/s00703-005-0112-4, 2005. a, b
Schwenk, C. and Miltenberger, A.: The role of ascent timescale for WCB moisture transport into the UTLS, Zenodo, https://doi.org/10.5281/zenodo.13913564, 2024. a
Spichtinger, P., Gierens, K., and Wernli, H.: A case study on the formation and evolution of ice supersaturation in the vicinity of a warm conveyor belt's outflow region, Atmos. Chem. Phys., 5, 973–987, https://doi.org/10.5194/acp-5-973-2005, 2005. a
Sprenger, M. and Wernli, H.: A northern hemispheric climatology of cross-tropopause exchange for the ERA15 time period (1979–1993), J. Geophys. Res., 108, 8521, https://doi.org/10.1029/2002jd002636, 2003. a
Stewart, R. E., Szeto, K. K., Reinking, R. F., Clough, S. A., and Ballard, S. P.: Midlatitude cyclonic cloud systems and their features affecting large scales and climate, Rev. Geophys., 36, 245–273, https://doi.org/10.1029/97rg03573, 1998. a
Tiedtke, M.: A Comprehensive Mass Flux Scheme for Cumulus Parameterization in Large-Scale Models, Mon. Weather Rev., 117, 1779–1800, https://doi.org/10.1175/1520-0493(1989)117<1779:acmfsf>2.0.co;2, 1989. a
Wandel, J., Büeler, D., Knippertz, P., Quinting, J. F., and Grams, C. M.: Why Moist Dynamic Processes Matter for the Sub‐Seasonal Prediction of Atmospheric Blocking Over Europe, J. Geophys. Res.-Atmos., 129, e2023JD039791, https://doi.org/10.1029/2023jd039791, 2024. a
Wang, J., Cole, H. L., and Carlson, D. J.: Water Vapor Variability in the Tropical Western Pacific from 20-year Radiosonde Data, Adv. Atmos. Sci., 18, 752–766, https://doi.org/10.1007/bf03403500, 2001. a
Wernli, H.: A Lagrangian‐based analysis of extratropical cyclones. II: A detailed case‐study, Q. J. Roy. Meteorol. Soc., 123, 1677–1706, https://doi.org/10.1002/qj.49712354211, 1997. a
Zahn, A., Christner, E., van Velthoven, P. F. J., Rauthe‐Schöch, A., and Brenninkmeijer, C. A. M.: Processes controlling water vapor in the upper troposphere/lowermost stratosphere: An analysis of 8 years of monthly measurements by the IAGOS‐CARIBIC observatory, J. Geophys. Res.-Atmos., 119, 11505–11525, https://doi.org/10.1002/2014jd021687, 2014. a
Zängl, G., Reinert, D., Rípodas, P., and Baldauf, M.: The ICON (ICOsahedral Non-hydrostatic) modelling framework of DWD and MPI-M: Description of the non-hydrostatic dynamical core, Q. J. Roy. Meteorol. Soc., 141, 563–579, https://doi.org/10.1002/qj.2378, 2014. a
Zängl, G., Reinert, D., and Prill, F.: Grid refinement in ICON v2.6.4, Geosci. Model Dev., 15, 7153–7176, https://doi.org/10.5194/gmd-15-7153-2022, 2022. a
Zou, L., Hoffmann, L., Griessbach, S., Spang, R., and Wang, L.: Empirical evidence for deep convection being a major source of stratospheric ice clouds over North America, Atmos. Chem. Phys., 21, 10457–10475, https://doi.org/10.5194/acp-21-10457-2021, 2021. a
- Abstract
- Introduction
- Methods
- Case study
- Ascent statistics and convective behaviour
- Moisture transport analysis
- Conclusions and discussion
- Appendix A: Case study plots
- Appendix B: Moisture budget terms: definitions and derivations
- Appendix C: General plots
- Code and data availability
- Author contributions
- Competing interests
- Disclaimer
- Acknowledgements
- Financial support
- Review statement
- References
- Supplement


