the Creative Commons Attribution 4.0 License.
the Creative Commons Attribution 4.0 License.
How does riming influence the observed spatial variability of ice water in mixed-phase clouds?
Nina Maherndl
Manuel Moser
Imke Schirmacher
Aaron Bansemer
Johannes Lucke
Christiane Voigt
Maximilian Maahn
Observations show that the ice water content (IWC) in mixed-phase clouds (MPCs) tends to occur in clusters. However, it is not sufficiently understood which ice crystal formation and growth processes play a dominant role in IWC clustering in clouds. One important ice growth process is riming, which occurs when liquid water droplets freeze onto ice crystals upon contact. Here we use airborne measurements of MPCs at mid- and high-latitudes to investigate the spatial variability of ice clusters in clouds and how this variability is linked to riming. We use data from the IMPACTS (mid-latitudes) and the HALO-(AC)3 (high-latitudes) aircraft campaigns, where spatially and temporally colocated cloud radar and in situ measurements were collected. We derive riming and IWC by combining cloud radar and in situ measurements. Ice cluster scales in clouds are quantified using pair correlation functions.
During all analyzed flight segments, riming is responsible for 66 % and 63 % of the total IWC during IMPACTS and HALO-(AC)3, respectively. In mid-latitude MPCs, riming does not significantly change IWC cluster scales but increases the probability of cluster occurrence. In cold-air-outbreak MPCs observed during HALO-(AC)3, riming leads to additional in-cloud IWC clustering at spatial scales of 3–5 km due to the presence of mesoscale updraft features. An increased liquid water path might increase the effect, but it is not a necessary criterion. These results can be used to evaluate and constrain models' representations of MPCs.
- Article
(11191 KB) - Full-text XML
- BibTeX
- EndNote
At mid-latitudes and high latitudes, most precipitation stems from ice-containing clouds (Mülmenstädt et al., 2015), which are a crucial component of the Earth's weather and climate systems. In mixed-phase clouds (MPCs), ice particles and supercooled liquid droplets coexist in a thermodynamically unstable state down to temperatures of about −38 °C. The mass and the ratio of ice and liquid particles play a critical role in not only precipitation processes but also cloud lifetime, radiative budget (Sun and Shine, 1994; Shupe and Intrieri, 2004; Turner, 2005), and climate feedbacks (Choi et al., 2014; Bjordal et al., 2020).
Numerical forecast and climate models often fail to realistically predict or reproduce MPC properties, lifetimes, and precipitation amounts (Morrison et al., 2012, 2020; Ong et al., 2024; Connelly and Colle, 2019). The misrepresentation of MPCs and ice clouds has been suggested as a major contributor to the uncertainty in Coupled Model Intercomparison Project version 6 (CMIP6) climate model predictions (e.g., Bock et al., 2021). This is partly related to a poor understanding of ice formation and growth processes in MPCs (Korolev et al., 2017). Their representations are therefore likely incomplete, even in sophisticated cloud microphysics schemes (e.g., Cao et al., 2023), such as the predicted particle properties (P3) scheme proposed by Morrison and Milbrandt (2015). Gaps in our understanding of the dominant ice processes hinder progress in the representation of MPCs in models (Morrison et al., 2012).
An important ice growth process is riming, which describes the process by which supercooled droplets freeze onto ice particles after contact. Riming efficiently converts liquid to ice and typically results in increased particle mass, density, and fall speed (Heymsfield, 1982; Erfani and Mitchell, 2017; Seifert et al., 2019). Although riming can theoretically significantly increase ice water content (IWC) in MPCs, it is unclear how much it actually contributes to ice mass and further to snowfall amounts on the ground with different studies reaching different conclusions (Harimaya and Sato, 1989; Moisseev et al., 2017; Kneifel and Moisseev, 2020; Fitch and Garrett, 2022; Waitz et al., 2022).
Cloud properties are determined not only by the mass and the ratio of liquid and ice particles but also by their spatial distribution. Observations show that ice particles and liquid droplets in MPCs are often heterogeneously mixed, leading to the formation of hydrometeor clusters (Korolev et al., 2003; Field et al., 2004; Korolev and Milbrandt, 2022). The ability to quantify spatial scales of IWC clustering would allow for model evaluation beyond comparison of IWC distributions. Furthermore, it is poorly understood which microphysical processes lead to IWC clustering at which spatial scales. While quantifying spatial scales of cloud particle clusters has been the focus of previous studies, most have focused on liquid-phase clouds, analyzing liquid droplet clustering on small scales below 1 m (Kostinski and Shaw, 2001; Shaw et al., 2002; Baker and Lawson, 2010), where turbulence plays a major role in clustering (Wood et al., 2005; Saw et al., 2012a, b). Studies of MPCs suggest that ice clustering occurs at different spatial scales than liquid clusters (Korolev and Milbrandt, 2022; Deng et al., 2024). Deng et al. (2024) propose that ice clusters – defined as regions with enhanced ice particle number or IWC – on larger scales of a few kilometers dominate the inhomogeneity of the ice distribution within clouds. However, their analysis is based on in situ data from a single case over China, and it is unclear whether their findings are representative of different types of MPCs.
Accurate in situ measurements of IWC remain challenging (Heymsfield et al., 2010; Baumgardner et al., 2017; Tridon et al., 2019), although in situ cloud probes can provide reliable particle size distribution (PSD) data (Korolev et al., 2013; Moser et al., 2023b). Lacking IWC measurements, Deng et al. (2024) calculated IWC from PSD observations, assuming that ice particle mass as a function of ice particle size follows a power law relationship. Because it is difficult to derive size-resolved ice particle densities from in situ observations alone, Deng et al. (2024) used constant mass size parameters from Heymsfield et al. (2010). Therefore, their analysis captures IWC variability due to ice number concentration and size but not ice particle density, which is commonly linked to riming (Erfani and Mitchell, 2017; Seifert et al., 2019).
The combination of colocated cloud radar and in situ PSD data shows great potential to provide better insight into microphysical processes (Nguyen et al., 2022; Mróz et al., 2021). It also allows the estimation of IWC by inferring ice particle density changes due to riming (Maherndl et al., 2024). In this way, IWC variability driven by riming-induced changes in ice particle density can be studied. In recent years, the synergistic use of both remote sensing and in situ instrumentation during airborne campaigns has become more common (Houze et al., 2017; McMurdie et al., 2022; Nguyen et al., 2022; Kirschler et al., 2023; Sorooshian et al., 2023; Wendisch et al., 2024; Maherndl et al., 2024).
Here we use colocated cloud radar and in situ cloud probe observations in MPCs collected during the IMPACTS (McMurdie et al., 2022) and the HALO-(AC)3 (Wendisch et al., 2024) aircraft campaigns. The focus of IMPACTS was to study precipitation variability during wintertime snowstorms. The main objective of the HALO-(AC)3 campaign was to study Arctic air mass transformations during warm air intrusions and marine cold air outbreaks (MCAOs). During both campaigns, two aircraft flew in an approximately vertically stacked coordinated pattern to collect spatially and temporally colocated radar and in situ data.
We aim to achieve the following goals:
-
to quantify spatial scales of ice clusters in MPCs observed during the IMPACTS (mid-latitude winter storms) and HALO-(AC)3 (Arctic MCAO clouds) aircraft campaigns,
-
to characterize spatial scales at which riming enhances in-cloud ice clustering and link to drivers of riming,
-
to compare ice cluster scales and the impact of riming for mid- and high-latitude MPCs.
Because we aim to compare IWC variability in MPCs at different latitudes, we use data from both aircraft campaigns. IMPACTS data were collected during four flights over the US East Coast and the Midwest. For HALO-(AC)3, we use data from three flights over the Fram Strait west of Svalbard. We compare the contribution of riming to IWC to other ice formation processes in absolute terms and with respect to the spatial scales of ice clustering using the pair correlation function. The paper is organized as follows. Section 2 presents the airborne datasets we use to study riming and IWC variability. Section 3 illustrates the methods we use to quantify riming, derive IWC, and analyze scales of IWC variability in clouds. The main results are presented in Sect. 4. In Sect. 5 we summarize and discuss our findings.
2.1 Airborne campaigns: IMPACTS and HALO-(AC)3
The Investigation of Microphysics and Precipitation for Atlantic Coast-Threatening Snowstorms (IMPACTS, McMurdie et al., 2022) campaign was a field campaign sponsored by the National Aeronautics and Space Administration (NASA) to study wintertime snowstorms with a focus on precipitation variability in US East Coast cyclones. Here, we use data collected during the winter of 2020, where a variety of storms from the Midwest to the US East Coast were sampled.
The German Research Foundation (DFG) funded the field campaign HALO-(AC)3 (Wendisch et al., 2024, HALO, High Altitude and Long Range Research Aircraft – (AC)3 Project on Arctic Amplification Climate Relevant Atmospheric and Surface Processes and Feedback Mechanisms; see https://halo-ac3.de/, last access: 8 October 2024), which took place in March and April 2022 and aimed to investigate Arctic air mass transformations. In this study, we analyze data collected during MCAO conditions over the Fram Strait west of Svalbard.
Common to both aircraft campaigns was the use of two aircraft to perform colocated in situ and remote sensing measurements. During IMPACTS, the ER-2 aircraft flew above clouds carrying a variety of passive and active remote sensing instruments, including multi-frequency Doppler radars. Simultaneously, the NASA P-3 aircraft collected measurements of microphysical cloud properties in situ while flying inside clouds. During HALO-(AC)3, the AWI aircraft Polar 5 and Polar 6 performed similar measurements. Polar 5, equipped with a W-band radar among other remote sensing instruments, flew above Polar 6, which performed in situ measurements in clouds.
However, both campaigns covered different observation areas and sampled at different frequency rates, i.e., different spatial resolutions. With a typical flight speed of 200 (150) m s−1, the ER-2 (P-3) covered a larger spatial scale with a coarser resolution than Polar 5 and Polar 6, which flew at 60–80 m s−1. While the ER-2 and Polar 5 flew at a constant altitude of 20 and 3 km, respectively, P-3 and Polar 6 sampled at different altitudes up to 8.5 and 3 km, respectively. In this study, we investigate data collected during the flight days listed in Table 1. We selected these days because of the good colocation (which we define as maximum spatial offsets of 5 km and temporal offsets of 5 min; see Sect. 2.4) between the respective remote sensing and in situ aircraft and because of data availability. Figure 1 shows all coordinated flight tracks.
Table 1Overview of analyzed flight days including campaign, measurement area, and synoptic situation.

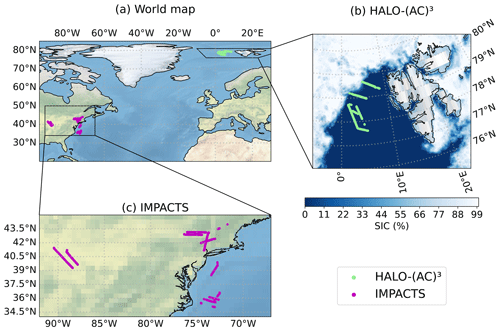
Figure 1Flight tracks of (a) all analyzed coordinated flight segments and a zoomed-in view of the (b) HALO-(AC)3 and (c) IMPACTS measurement areas. In (b), the sea ice concentration (SIC) derived from the Advanced Microwave Scanning Radiometer 2 (AMSR2) onboard the GCOM-W1 satellite on 1 April 2022 is shaded in blue.
2.2 Instruments
The equivalent radar reflectivity factor Ze was measured by multiple radars during IMPACTS: X-band (9.6 GHz, EXRAD, Heymsfield et al., 1996, 2022), Ku and Ka band (13.6 and 35.6 GHz, HIWRAP, Li et al., 2016, 2022), and W band (94 GHz, CRS, McLinden et al., 2021, 2022). EXRAD consists of a nadir-pointing beam and a conically scanning beam, but only the nadir-pointing beam is used in this study. EXRAD, HIWRAP, and CRS sampled at 4, 2, and 4 Hz with vertical resolutions of 19, 26, and 26 m, respectively. EXRAD, HIWRAP Ku band, HIWRAP Ka band, and CRS have sensitivity limits of −15, 0, −5, and −28 dBZ at 10 km range, respectively. During HALO-(AC)3, a W-band radar (94 GHz, MiRAC-A, Mech et al., 2019, 2024a) was deployed. MiRAC-A was mounted with a 25° backwards inclination sampled at 1 Hz, and Ze data are available with 5 m vertical resolution. For the scattering calculations performed within this study, the 25° inclination is negligible (not shown). MiRAC-A has a sensitivity limit of about −40 dBZ at 3 km range. For both campaigns, Ze data are quality controlled and corrected for instrument orientation and aircraft motion (for MiRAC-A; see Mech et al., 2019). Uncertainties in Ze due to radar calibration are estimated to be below 1 and 0.5 dB for IMPACTS and HALO-(AC)3 data, respectively (Finlon et al., 2022; Mech et al., 2019). MiRAC-A Ze is corrected for attenuation due to liquid water content (LWC) as described in Maherndl et al. (2024); CRS Ze is as described in Finlon et al. (2022). Attenuation due to water vapor and atmospheric gases is below 0.5 dB for all radars and is therefore neglected.
During HALO-(AC)3, brightness temperature TB measurements at 89 GHz were collected and are used to derive the liquid water path (LWP). Differences in TB for clear-sky and cloudy conditions are used to retrieve LWP over the open ocean via a regression approach (Ruiz-Donoso et al., 2020; Maherndl et al., 2024). Lidar measurement of backscattered intensities at 532 nm (parallel and perpendicular polarized) and 355 nm (non-polarized; Stachlewska et al., 2010) are used to derive cloud top height (CTH) during HALO-(AC)3 (Mech et al., 2022a, 2024b; Schirmacher et al., 2023; Maherndl et al., 2024).
Cloud particle observations obtained with a variety of cloud probes cover a size range from 2 µm to about 2 cm for IMPACTS and 2.8 µm to 6.4 mm for HALO-(AC)3. For IMPACTS, we use data from a fast-cloud droplet probe (Fast-CDP, 2–50 µm, Lawson et al., 2017), a two-dimensional stereo (2D-S, Lawson et al., 2006) probe (10–2000 µm with a pixel resolution of 10 µm), and one horizontally oriented and one vertically oriented high-volume precipitation spectrometer version 3 (HVPS-3, Lawson et al., 1998) probe (0.3–19.2 mm, pixel resolution of 150 µm). For HALO-(AC)3, we use data from a cloud droplet probe (CDP, 2.8–50 µm, Lance et al., 2010), a cloud imaging probe (CIP, 15–960 µm, pixel resolution of 15 µm, Baumgardner et al., 2001), and a precipitation imaging probe (PIP, 103–6400 µm, pixel resolution of 103 µm, Baumgardner et al., 2001). Here, we use merged particle size distribution (PSD) data from the respective campaign (Bansemer et al., 2022; Moser et al., 2023a), which are derived from the instruments listed above. As in Moser et al. (2023b) and Maherndl et al. (2024), we assume all particles larger than 50 µm in MPCs to be ice particles. As in Maherndl et al. (2024), we only include data up to −1 °C to avoid melting ice particles, which are not represented well in the scattering simulations that we perform. In addition, we manually looked through in situ images of all remaining flight segments and removed two IMPACTS segments where we could identify supercooled droplets larger than 50 µm. LWC was measured in situ with a King probe (King et al., 1978) and a Nevzorov probe (Korolev et al., 1998; Lucke et al., 2022, 2024) during IMPACTS and HALO-(AC)3, respectively. Due to the poor data availability1 and high uncertainties in IWC measurements, IWC is calculated from the PSD as described in more detail in Sect. 3.2. For more details on IMPACTS and HALO-(AC)3 instrumentation and data processing, we refer the reader to McMurdie et al. (2022) and Moser et al. (2023b), Mech et al. (2022a), and Maherndl et al. (2024), respectively.
2.3 Synoptic situation
In this section, we give a brief overview of the typical synoptic situations encountered during the different field campaigns to provide context for the types of MPCs that we analyze. We use an example flight segment for each campaign, which we describe in detail in Sects. 4.1.1 and 4.1.2.
During IMPACTS, a variety of mid-latitude wintertime storms in different development stages were observed. The focus was on the observation of banded precipitation structures. Observations range from a relatively weak and warm developing Atlantic low systems without major banding structures (1 February 2020) to rapidly deepening cyclones with significant snowfall and snow bands (5 February 2020). The majority of the measurements stem from the Midwest and close to the US East Coast (both over ocean and land), ranging up to southern parts of Canada (Fig. 1). The coordinated ER-2 and P-3 flights on 5 February sampled an elevated warm front over shallow, pre-existing cold air as a low-pressure center developed over Louisiana and Mississippi. The developing circulation around the low produced a low-level northeasterly flow across the Midwest. Precipitation formed as rain (in the south) and snow (in the north) due to the overflow of warm, moist air from the south. During the observation period, snow band structures were observed.
Measurements during HALO-(AC)3 were conducted west of Svalbard over both open ocean and sea ice. However, clouds over the sea ice were very thin to non-existent during all three flights used here. Northerly to northeasterly flow brought cold air masses from the sea ice of the higher Arctic to the comparatively warm open ocean. This led to the formation of roll cloud streets. On 1 April 2022, the MCAO was especially strong, meaning that the difference between the potential temperature at sea surface and the potential temperature at 850 hPa was large (about 8 K). On 28 March and 4 April 2022, weaker MCAO conditions were observed due to convection of air masses from North America over Siberia (28 March) or the central Arctic (4 April) to Svalbard (Walbröl et al., 2024).
2.4 Colocation
To combine in situ and remote sensing observations of the two aircraft, we use the same colocation criterion as in Maherndl et al. (2024), which is also extended to the IMPACTS data. In summary, following Chase et al. (2018) and Nguyen et al. (2022), the closest radar data point to the in situ measurements is selected. Each 1, 2, or 4 Hz radar aircraft (Polar 5 and ER-2) data point is matched with the spatially closest in situ aircraft (Polar 6 and P-3) data point within a 5 min time window. We consider data with a maximum spatial offset of 5 km to be “colocated”. The closest radar range gate to the flight altitude of the in situ aircraft is chosen. Averaging over certain height ranges did not lead to significant improvements.
Rolling averages were applied to Ze and in situ data to obtain more robust statistics for the latter. To cover approximately the same spatial scales, averaging windows of 10 and 30 s are chosen for IMPACTS and HALO-(AC)3, respectively. With typical flight speeds of 180–200 m s−1 and 60–80 m s−1 during IMPACTS and HALO-(AC)3, respectively, this corresponds to spatial scales of 1.8–2.0 km and 1.8–2.4 km, respectively. We assume the in situ measurement is representative of the entire matched radar volume. Possible implications of this assumption for the riming retrieval are discussed in Maherndl et al. (2024).
3.1 Retrieving ice particle riming
We use the normalized rime mass M (Seifert et al., 2019) to describe riming. M is defined as the particle's rime mass mrime divided by the mass of a size-equivalent spherical graupel particle mg, where we assume a rime density of ρrime=700 kg m−3:
where
The maximum dimension Dmax is defined as the diameter of the smallest circle encompassing the cloud particle in meters and is used to parameterize particle sizes.
We retrieve M using the two methods introduced in Maherndl et al. (2024), which are termed the combined method and the in situ method. The methods in Maherndl et al. (2024) were developed for HALO-(AC)3, but we apply them to IMPACTS data with slight adjustments due to different instrumentation. In the following, we give a brief explanation of both methods and describe the adjustments for IMPACTS data. For more details, we refer the reader to Maherndl et al. (2024).
The combined method derives M along the flight track of the in situ airplane from colocated PSD and radar reflectivity Ze measurements. It therefore relies on colocated in situ and remote sensing flights. An optimal estimation (Rodgers, 2000) algorithm is used to retrieve M by matching simulated radar reflectivities Ze obtained from observed in situ PSD with the spatially and temporally closest measured Ze. As forward operator we use the Passive and Active Microwave radiative TRAnsfer tool (PAMTRA, Mech et al., 2020), which includes empirical relationships Maherndl et al. (2023a) for estimating particle scattering properties as a function of M. For IMPACTS, the combined method is applied (separately) to X-, Ku-, Ka-, and W-band Ze (see Sect. 4.1.3). As in Maherndl et al. (2024), we use the riming-dependent mass–size parameter relation for dendrites from Maherndl et al. (2023a) that were estimated for different degrees of riming, i.e., M values. Dendrites were chosen because 86.2 % of the data during the analyzed IMPACTS segments are within the temperature ranges of −20 to −10 °C and −5 to 0 °C, where plate-like growth of ice crystals is favored (only 13.8 % of the data are between −10 and −5 °C, where column-like growth dominates). We assume dendrite shapes for the entire dataset for two reasons. The first reason is that Maherndl et al. (2024) found that assuming plates or dendrites gives the same results within uncertainty estimates, and the second reason is that we want to keep the analysis of IMPACTS and HALO-(AC)3 data as consistent as possible.
The in situ method uses in situ measurements of ice particle area A, perimeter P, and Dmax to derive M for individual ice particles, from which an average M for the particle population is derived. The in situ method is applied to 2D-S and HVPS-3 data for IMPACTS as was done with CIP and PIP data for HALO-(AC)3 in Maherndl et al. (2024). P and A in the unit of pixel and are used to calculate complexity . Simulated rimed aggregates from Maherndl et al. (2023b) are used to derive empirical functions relating χ and Dmax to M, where χ and Dmax are derived using the same processing steps as for the respective cloud probes. Because these processing steps were slightly different for 2D-S and HVPS-3 operated during IMPACTS2 from those for CIP and PIP during HALO-(AC)3, new fit functions (based on 18 352 simulated dendrites, with R2=0.92) had to be derived for IMPACTS:
Only a subset of ice particles can be used to derive M with the in situ method because particles cannot touch edges to derive P and must be large enough to derive meaningful χ. Because of these two criteria, ice particles with Dmax in the range of about 1.0–1.4 and 2.0–6.0 mm are neglected by the in situ method when using the HALO-(AC)3 and IMPACTS particle probes, respectively. Therefore, we assume that the combined method – which uses the full PSD – gives more reliable results if the aircraft are reasonably colocated, as shown in Maherndl et al. (2024) for HALO-(AC)3. We use M derived with the combined method for all further analysis steps. For reference and uncertainty estimation, we show the in situ method M results in Sect. 4.1.1 and 4.1.2 and in Appendix A.
3.2 Deriving ice water content (IWC)
IWC is calculated by summing the product of ice particle mass m(Dmax) and N(Dmax) for the lower to upper size ranges of the probes, Dlower to Dupper:
where ΔDmax is the size bin width. Here, m(Dmax) is approximated by a power law relation with prefactor am and exponent bm:
Here, am scales the density of ice particles (independent of particle size), while bm modulates the size dependence of particle mass, which is related to particle shape and growth processes. In addition, am and bm depend strongly on riming (e.g., Mitchell, 1996), and reported values in the literature range from 0.0058 to 466 for am and 1.8 to 3.0 for bm in SI units (e.g., discussed by Mason et al., 2018). As shown by Maherndl et al. (2023a), am and bm strongly depend on the amount of riming, which increases particle densities. Maherndl et al. (2023a) provide am and bm values for discrete M, which are interpolated in this study to obtain parameters for a continuous M. We derive am and bm for each time step as a function of the retrieved M. IWC is then calculated using Eq. (4) for each time step based on the measured PSD and the derived am and bm parameters. We refer to this quantity as IWCr (IWC accounting for riming).
To estimate the contribution of the riming process to IWC, we also calculate IWC using fixed mass–size parameters am and bm for unrimed particles (also taken from Maherndl et al., 2023a), thereby neglecting density changes (e.g., due to riming). We call this quantity IWCu. IWCu can be seen as the “theoretical” IWC where the ice particles were unrimed, meaning that the riming contribution can be estimated from the difference between IWC and IWCu. However, this implies that riming does not affect the size of the unrimed ice particle, which is not necessarily the case in nature. Riming typically leads to an increase in not only ice particle density but also ice particle size (Seifert et al., 2019). Therefore, we likely underestimate the contribution of riming to particle mass when comparing IWCu to IWC. Since we are interested in the contribution of riming to IWC variability, this approach likely results in a conservative estimate of the contribution of riming to IWC variability.
3.3 Characterizing scales of IWC variability in clouds
Similar to Deng et al. (2024), we use the pair correlation function (PCF) to quantify the spatial inhomogeneity of ice water in the observed clouds. In discrete systems, the PCF describes the degree of deviation from the homogeneous Poisson process. In clouds, the PCF can be used to quantify the degree of clustering or variability of a certain parameter such as the number concentration of liquid droplets, the number concentration of ice particles, LWC, or IWC (e.g., Shaw et al., 2002; Saw et al., 2012a; Deng et al., 2024). The PCF applied to a one-dimensional parameter p is given by
where p(0) is the parameter at a given point, p(r) is the parameter at the lag r from that point, and is the average of p (Kostinski and Jameson, 2000; Shaw et al., 2002). Thus, η(r) is a measure of the probability of finding clusters of p as a function of lag r compared to . Positive values indicate the presence of clusters and the higher η(r) is, the higher the probability of finding clusters at that scale will be. If p follows a homogeneous Poisson distribution, which PCF assumes to be statistically homogeneous, then η(r)=0. Negative values indicate that the probability of finding clusters at that scale is lower than on average for the whole segment.
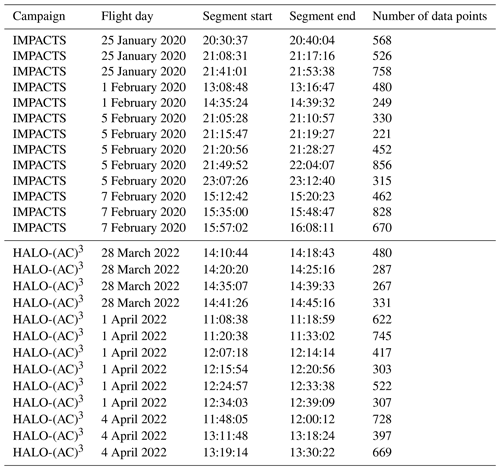
In this study, only straight flight segments with a minimum of 200 s of continuous in-cloud measurements are used to calculate η(r). The respective radar sensitivity limits are used to define “in cloud”. We allow measurement gaps with a maximum length of 5 s, which are linearly interpolated. Table 2 gives an overview of all segments we analyze, including duration and data amount. Because IWC is derived using running averages of 10 and 30 s for IMPACTS and HALO-(AC)3 data, respectively, we investigated the impact of the window size of the moving average on η(r). We found that increasing the window size from 1 to 10 (30) s for IMPACTS (HALO-(AC)3) decreases the absolute value of η(r). However, the lags r at which r η(r) is positive do not change (not shown). This is because applying a moving average smooths peaks in the 1 Hz signal but does not necessarily change their periodicity as long as the window size is reasonably small.
Table 2Overview of analyzed segments including campaign, flight day, start and end times in UTC, and number of 1 s data points.
Additionally, we use power spectra in order to gain insight into scales of variability of CTH and LWP during HALO-(AC)3. To do this, each data segment is mean centered and linearly detrended. A Hann window is applied to each segment to minimize edge effects. Frequency is converted to wavelength using the aircraft speed vair. With a minimum time range of 200 s per segment, we capture spatial scales of 12 km for HALO-(AC)3, meaning that we do not capture synoptic-scale motions. We interpret results up to 0.1 Hz, i.e., spatial scales of 600 m.
Figure 2 visualizes the PCF and power spectra for synthetic data. For a homogeneous Poisson process (Fig. 2a), η(r)=0 (Fig. 2d), and the power spectral density shows no significant peaks (Fig. 2g). For a periodic sine function with Poisson noise added (Fig. 2b), η(r) is positive for small lags and oscillates around 0 for larger lags with peaks occurring at multiples of the wavelength λ of the sine function (Fig. 2e). The power spectrum shows a peak at λ (Fig. 2h). When the modulus function is applied to the sine curve (Fig. 2c), η(r) (Fig. 2f) is smaller than in Fig. 2e due to the lower signal-to-noise ratio, and the oscillation occurs at . The power spectrum also shows a peak at (Fig. 2i).
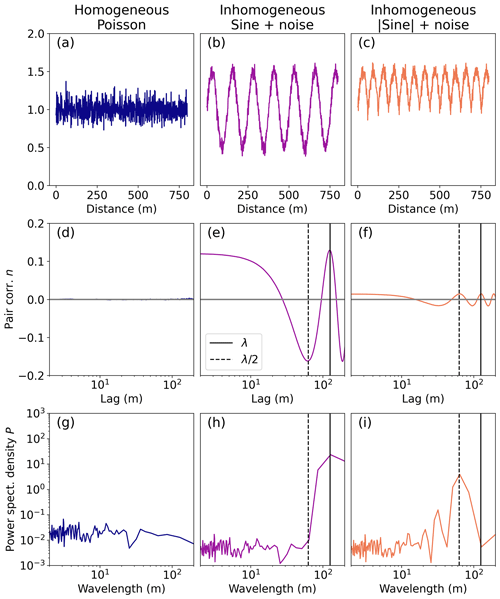
Figure 2Schematic diagram introducing the pair correlation function (PCF) and power spectral density for (a) a homogeneous Poisson distribution signal, (b) a sine curve with wavelength λ and Poisson noise added, and (c) the same sine curve but mirrored upwards along x=1 to show the impact of λ and signal-to-noise ratio. The respective PCF η as a function of lag is shown in (d)–(f), while the power spectra density as a function of wavelength is shown in (g)–(i). The solid and dashed lines indicate λ and of the sine curve in (b), respectively.
To characterize the influence of riming on the spatial variability of ice clusters in clouds, we first need to know the amount of riming and its impact on IWC. Second, we need to know spatial IWC cluster scales with and without riming. Therefore, this section is structured as follows. First, we quantify the amount of riming observed during the both campaigns (Sect. 4.1). We then show that the retrieved amounts of riming have a significant impact on IWC (Sect. 4.2). Finally, we quantify in-cloud IWC variability (Sect. 4.3) and discuss the impact of riming on spatial scales and the probability of IWC clustering in clouds.
4.1 Riming occurrence
MPC properties, synoptic situations (Sect. 2.3), and measurement locations (Fig. 1) vary between IMPACTS and HALO-(AC)3. Clouds during colocated IMPACTS segments have much larger vertical extents than during HALO-(AC)3 segments. The median CTH during IMPACTS segments is 7.3 km (25 %–75 % quantile range: 6.3–7.8 km). Here, we define CTH as the height of the highest radar range gate with continuous Ze above the in situ aircraft altitude.
Clouds observed during colocated HALO-(AC)3 segments were predominately shallow roll clouds that formed during MCAOs. The maximum CTH during all segments was 2.2 km (25 %–75 % percentile range: 0.69–1.1 km). Cloud properties during 1 and 4 April 2022 are described in detail in Schirmacher et al. (2024).
In the following, we give a brief overview of the differences in MPCs between the two campaigns using two typical example cases. We show a flight segment from 5 February 2020 for IMPACTS (Sect. 4.1.1) and from 1 April 2022 for HALO-(AC)3 (Sect. 4.1.2). We present M retrieved with combined and in situ methods and discuss uncertainties. We then extend this to data from all colocated segments (Sect. 4.1.3).
4.1.1 Case study 1: mid-latitude winter storm on 5 February 2020
Figure 3 shows a 64 km segment from 5 February, where ER-2 and P-3 sampled a developing low-pressure system over Illinois from 23:07:26 to 23:12:40 UTC. According to the level-2 Moderate-resolution Imaging Spectroradiometer (MODIS) cloud product (NASA Worldview, 2024), the cloud top temperature (CTT) was −33 ± 5 °C. W-band Ze shows the deep cloud with convective-cell structures near cloud top from which sheared fall streaks extend downward (Fig. 3a). P-3 measured the number of ice particles larger than 50 µm Ni in the range of 910 to 2800 m3 (Fig. 3b). Here we show D32 (Fig. 3b), which is the proxy for the mean mass-weighted diameter (e.g., Maahn et al., 2015). D32 is defined as the ratio of the third to the second measured PSD moments (e.g., Mitchell, 1996). During the first 20 km of the segment, ice particles had D32 of about 3 mm and were lightly rimed with M of about 0.02 (Fig. 3c). Following this, D32 increases up to 8 mm, indicating aggregates, and M drops below the riming threshold of 0.01. From −88.9° E onward, D32 decreases and M increases. Combined-method M results using the different frequencies show good agreement between X, Ku, and Ka band. W-band results are likely biased high due to the high D32, as will be discussed in Sect. 4.1.3. IWC is calculated with Eq. (4) using (1) the measured PSD and mass–size parameters am and bm for unrimed particles (blue line) and (2) am and bm based on lookup tables (Maherndl et al., 2023a) for each time step depending on the retrieved M for each frequency (black lines). The derived IWC from Ku-band M varies between 0.015 and 0.31 gm−3 (Fig. 3d). If riming is neglected, i.e., mass–size parameters for unrimed particles are used in the IWC calculation, IWC is on average lower by a factor of 3.7.
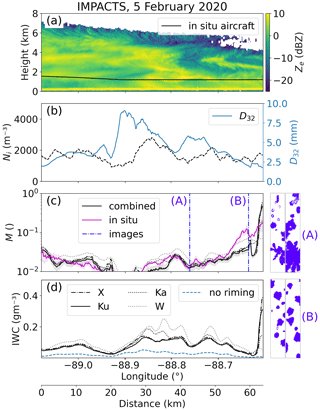
Figure 3Colocated flight segment from 23:07:26 to 23:12.40 UTC on 5 February 2020 during IMPACTS. (a) W-band radar reflectivity Ze and P-3 flight altitude; (b) ice number concentration Ni and mass-weighted diameter D32 derived from the 10 s running averaged particle size distribution (PSD); (c) normalized rime mass M from the combined (black) and in situ (magenta) methods, including uncertainty estimates (combined: optimal estimation (OE) standard deviation; in situ: 10 s running standard deviation), where the combined method was applied to X-, Ku-, Ka-, and W-band Ze (Ku-band results, which are used in the further analysis, are shown as solid lines); (d) ice water content (IWC) derived from the 10 s running averaged PSD, combined method M (black), and assuming M=0 (blue). Combined method results for different radar frequencies are drawn as dashed lines. The 2-DS images for (A) −88.78° E and (B) −88.69° E are shown in blue next to panels (c) and (d).
The increase in M starting at −88.7° E could be related to the decrease in CTH (as seen by the radar). Some particles are possibly rimed in liquid layers near cloud top and fall down to the measurement location. On their way down, they may undergo additional growth processes (condensational growth or aggregation), leading to a decrease in M, since M is normalized to particle size. However, King probe measurements show that liquid water also occurs at the P-3 position. Therefore, additional riming may occur at the P-3 location and possibly in cloud layers above. The 2-DS images (Fig. 3) show a change from large, lightly rimed aggregates to small, more heavily rimed particles.
4.1.2 Case study 2: Arctic roll clouds on 1 April 2022
Figure 4 shows a 35 km segment from 1 April, where Polar 5 and Polar 6 sampled perpendicular to the roll cloud structures formed during MCAO conditions over the Fram Strait from 11:20:38 to 11:33:02 UTC (see Maherndl et al., 2024, for a detailed discussion of the case and particle images). The MODIS CTT was −18 ± 5 °C. W-band Ze shows the vertical structure of the individual cloud rolls (Fig. 4a). While Polar 6 was flying close to cloud top, Ni was high with a maximum of 27 300 m−3, and D32 was low with a minimum of 0.077 mm (Fig. 4b). As Polar 6 descended, Ni dropped to a minimum of 4600 m3, while D32 increased up to 1.4 mm (Fig. 4b). M oscillates between 0.01 and 0.1, with peaks occurring in streaks of high Ze (Fig. 4c). The resulting IWC is between 0.022 and 0.084 g m−3. This is a factor of 2.8 higher than using a mass–size parameterization for unrimed particles (Fig. 4d).
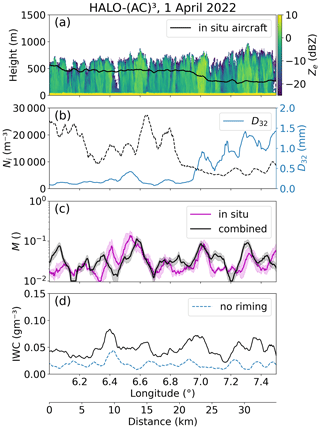
Figure 4The same as Fig. 3 but for the colocated flight segment from 11:20:38–11:33:02 UTC on 1 April 2022 during HALO-(AC)3. Only W-band radar reflectivities are available.
Both methods used to derive M agree well for this segment in terms of M distributions and location and extent of maxima (R2=0.52). Statistical agreement between the two methods was achieved for all HALO-(AC)3 segments used in this study. However, spatiotemporal agreement could not be achieved for inhomogeneous cloud observations (e.g., when Polar 6 was flying in and out of cloud near the CTH), as discussed in Maherndl et al. (2024).
4.1.3 Riming product statistics and discussion
In the previous section, two case studies were used to show differences between clouds observed during the two campaigns, especially in terms of vertical extent, structure, and riming. Despite these differences, normalized rime mass M distributions derived for IMPACTS and HALO-(AC)3 are similar (Fig. 5a and b). Median M values for all colocated IMPACTS segments are 0.024, 0.022, 0.025, and 0.034 when derived with X-, Ku-, Ka-, and W-band Ze, respectively. During colocated HALO-(AC)3 segments, median M is 0.024. For IMPACTS, the discrepancy between the W-band results and the other frequency bands is due to the occurrence of large ice particle sizes. Because of saturation effects, the riming-dependent parameterization (Maherndl et al., 2023a) has a positive Ze bias for large relative sizes of scattering particles. The relative size of a scattering particle is defined by its size parameter , where αe is the effective aspect ratio of the ice particle, and λ the radar wavelength. Positive biases occur for x>4. The positive Ze bias for x>4 results in a positive bias of M. For IMPACTS, 25 % of the data have D32>3.2 mm, which corresponds to x=4 at 94 GHz assuming a typical value of αe=0.6. Therefore, W-band results for IMPACTS are not as trustworthy as the other wavelengths and are not used in the following analysis. Unlike IMPACTS, the M bias is negligible for HALO-(AC)3 due to the smaller particle sizes, and D32<3.2 holds for 90 % of the data. Appendix A gives an overview of microphysical parameters during each analyzed segment.
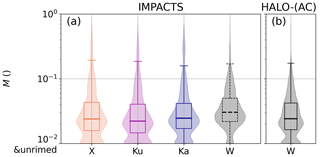
Figure 5Boxplots and superimposed violin plots showing normalized rime mass M results obtained from a closure of colocated radar reflectivity Ze and in situ particle size distribution (“combined method” from Maherndl et al., 2024) for radar reflectivities available during (a) IMPACTS and (b) HALO-(AC)3. W-band results during IMPACTS are dashed due to biases (see text). M<0.01 is plotted at 0.01 to be visible on the logarithmic scale.
4.2 Sensitivity study
To show the effect of expected M on Ze and to evaluate whether the retrieved amounts of riming significantly impact IWC, we conduct a sensitivity study.
We assume that N(Dmax) follows a modified gamma distribution and use the normalized form introduced by Delanoë et al. (2005, 2014) and extended by Maahn et al. (2015) for the maximum dimension Dmax:
where is the overall scaling parameter, μ is the shape parameter, and Dm is the “mass-weighted” scaling parameter for the particle size. We vary and Dm – which can be calculated from PSD moments (see Maahn et al., 2015) – based on 10 % to 90 % quantile values derived from all measured PSDs during IMPACTS. Only IMPACTS data were chosen because larger particles and higher number concentrations were measured during IMPACTS than during HALO-(AC)3. Here, μ is varied from 0 to 64 based on extreme values reported in the literature (Tridon et al., 2022). M is varied from 0.005 to 1, corresponding to the 10 % quantile of M retrieval results from both campaigns and the maximum “physical” M based on its definition.
We find that although the median M is below 0.03 for both campaigns, even small amounts of riming – or rather changes in ice particle density – can result in large changes in IWC. Figure 6 shows IWC calculations assuming gamma PSDs with varying (left column) and M (right column) as a function of Dm. Similar to Maahn and Löhnert (2017), we find that the shape parameter μ does not significantly impact IWC or Ze, and therefore only μ=0 is shown. Dm, which can be seen as a proxy for particle size, has the largest effect on IWC. Changing Dm from 1 to 8 mm changes IWC by 3 orders of magnitude. IWC increases by about 1 order of magnitude, when – the proxy for the total number concentration of particles – is increased by 1 order of magnitude. Depending on Dm, varying M can result in IWC changes of up to 2 orders of magnitude. Considering only M values encountered during the campaigns analyzed, the change in IWC reaches 1 order of magnitude.
In order to show the effect of riming on radar reflectivity Ze, which can be considered a proxy for IWC, we conduct a sensitivity study for Ku- and Ka-band Ze. The aim is to highlight the importance of accounting for riming in radar retrievals. Ze is forward simulated using the same PSDs with PAMTRA assuming a temperature of −10 °C. Particle scattering is parameterized with the riming-dependent parameterization (Maherndl et al., 2023a). X band is not shown due to being nearly identical to Ku band;, and W band is not shown due to the riming-dependent parameterization bias for large Dm at W band (see Sect. 4.1.3). Varying M within the observed ranges results in Ze changes of up to 20 dB depending on Dm for both Ku and Ka band, albeit with a slightly larger spread at Ka band. Similar to Fig. 6, varying Dm results in the largest Ze changes. Observed ranges of M result in larger Ze changes than observed ranges of . Thus, in our dataset Ze depends more on riming than on number concentration.
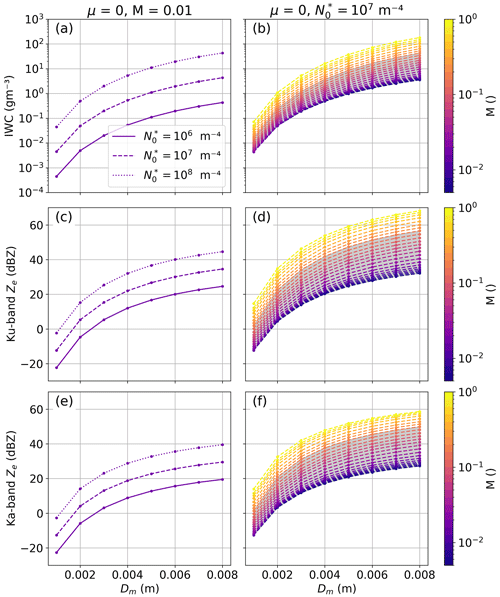
Figure 6Ice water content (IWC) (a, b), Ku-band Ze (c, d), and Ka-band Ze (e, f) calculated from gamma particle size distributions as functions of Dm parameter. Results for varying parameters are shown as solid and dashed lines in (a), (c), and (e), while results for varying normalized rime mass M are shown with different colors in (b), (d), and (f). Shaded areas in (b), (d), and (f) indicate M ranges observed during IMPACTS (90 % range: ).
We therefore conclude that the effect of riming on IWC should not be neglected for the range of M observed during HALO-(AC)3 and IMPACTS to avoid biases of up to 1 order of magnitude in IWC.
4.3 Quantifying in-cloud IWC variability with and without riming
Because even small amounts of riming have a significant effect on IWC, in the following we evaluate the differences in IWC variability when riming is considered versus when riming is neglected. As described in Sect. 3.2, IWC is calculated with Eq. (4) based on the measured PSD and (1) using mass–size parameters am and bm for unrimed particles (IWCu) and (2) varying am and bm for each time step as a function of the retrieved M (IWCr). During all analyzed IMPACTS flight segments, the rime mass (IWCr−IWCu) makes up 68.6 %, 65.7 %, and 68.8 % of IWCr based on X-, Ku-, and Ka-band results, respectively. During HALO-(AC)3, the rime mass makes up 62.7 %.
Figure 7 shows the average PCF η over all analyzed IMPACTS and HALO-(AC)3 segments for Ni (Fig. 7, first column), IWCr, and IWCu (Fig. 7, second column). To visualize the difference between IWCr and IWCu, the third column of Fig. 7 shows . This allows us to isolate the contribution of the riming process to IWC. Positive values of indicate that riming increases the variability of IWC clusters at the given lag, while negative values are related to riming smoothing out IWC variability. Because we are interested in the spatial scales at which riming influences IWC variability, we only discuss the differences greater than zero.
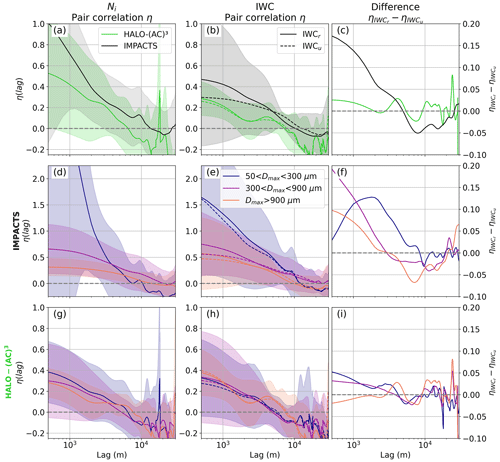
Figure 7Average pair correlation function (PCF) η as a function of lag calculated for (a) ice number concentration Ni and (b) ice water content (IWC) during IMPACTS (black) and HALO-(AC)3 (green) segments. IWC is calculated with (solid line) and without (dashed line) accounting for riming, and differences are plotted in (c). Shaded areas show standard deviations. In (d)–(i), the particle size distributions are split into small ( µm), medium ( µm), and large (Dmax>900 µm) particle sizes. Panels (d)–(f) and (g)–(i) are as in panels (a)–(c) but show the size dependency of η during IMPACTS and HALO-(AC)3, respectively. Note the different scales on the y axes.
For both Ni and IWC, IMPACTS segments have higher η on average than HALO-(AC)3 segments, implying that Ni and IWC have more variability on the spatial scales examined (Fig. 7a and b). Note that both quantities are calculated from running PSD averages of 10 and 30 s for IMPACTS and HALO-(AC)3, respectively, to cover similar spatial scales (about 1.8 km) given the different flight speeds. The smaller number of data points averaged for IMPACTS could lead to higher variability. However, computing η for 30 s running averages results in similar curves with nearly the same lags, where η=0, and slightly lower η, but this value is still higher than for HALO-(AC)3 (not shown).
During IMPACTS, variability occurred at larger spatial scales than during HALO-(AC)3, as indicated by positive η at larger lags (Fig. 7a and b). Differences between η for Ni and IWC indicate that ice growth processes play a large role in IWC variability in addition to ice formation processes. For both campaigns, η>0 for IWC is shifted to larger spatial scales than for Ni, indicating that ice growth processes lead to increased variability at large spatial scales. For IMPACTS, accounting for riming shifts the scales of IWC variability to slightly smaller lags and increases η significantly at small lags, meaning that riming increases IWC variability at lags <5 km (Fig. 7c). For HALO-(AC)3, riming leads to IWC variability at lags below 1 km and between 3–5 km. (Fig. 7c) However, the differences between and are smaller than for IMPACTS.
4.3.1 Dependency on particle size
To identify which particle size range contributes most to the Ni and IWC variability, we split the PSD into small ( µm), medium ( µm), and large (Dmax>900 µm) particle sizes to calculate Ni and IWC (Fig. 7d–i). For IMPACTS, the probability of small-particle Ni (IWC) clusters is higher than for medium and large particles below 3.5 km (10 km). During HALO-(AC)3, η is similar regardless of size. However, positive ηIWC values – indicating the occurrence of IWC clusters – are shifted to slightly larger lags for large particles (9 km as opposed to 5–6 km for small and medium sizes).
The in-cloud measurement location could influence the dependence of Ni and IWC variability on particle size due to size sorting, i.e., more small particles near the CTH and larger particles at lower heights. During the analyzed HALO-(AC)3 segments, clouds were shallow, and Polar 6 measurements took place on average 440 m below the CTH (as measured by W-band radar). During IMPACTS, much deeper cloud systems were observed, and P-3 on average sampled at larger vertical distances from the cloud top (3.3 km) than during HALO-(AC)3. W-band radar reflectivity Ze – which can be seen as a proxy for IWC – shows higher variability near CTH for both IMPACTS and HALO-(AC)3 clouds (Fig. 8). Similar to Fig. 7, we use PCF to characterize the variability of Ze in linear units. For each IMPACTS (HALO-(AC)3) flight segment, η is calculated for Ze cross sections in 100 m (50 m) steps from the average CTH downward. In general, Ze variability is larger near CTH at lags below 5 and 2 km for IMPACTS and HALO-(AC)3, respectively. The higher variability is likely linked to cloud top generating cells, as seen in case study 1 (Fig. 3a). Generating cells contain more liquid and ice and have stronger updrafts than adjacent cloud regions. HALO-(AC)3 clouds show less variability and are homogeneous at smaller spatial scales (η=0 is at smaller lags) than clouds during IMPACTS. Size sorting may play a larger role in IMPACTS due to the larger cloud depths compared to the shallow MCAO clouds during HALO-(AC)3. However, the Ni and IWC distributions as functions of distance to CTH indicate the opposite (Appendix B). Nevertheless, Ni and IWC derived for small particles only show much more variability as a function of the distance to CTH for IMPACTS (Appendix B).
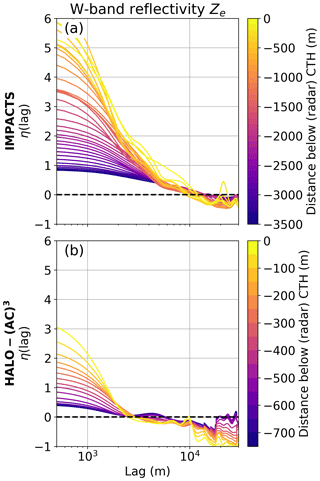
Figure 8Average pair correlation function (PCF) η as a function of lag calculated for horizontal cross section of W-band Ze (in linear units) during (a) IMPACTS and (b) HALO-(AC)3 flight segments. Cross sections are taken in 100 and 50 m steps from the average cloud top height (CTH) of each segment downward for IMPACTS and HALO-(AC)3 data, respectively. Note the different color bar scales.
The higher variability of small particle counts during IMPACTS is therefore likely due to higher numbers of ice-nucleating particles (INPs) available at mid-latitudes (Petters and Wright, 2015). During the analyzed HALO-(AC)3 flight days, INP concentrations collected with filters on board Polar 6 were very low, often below the detection threshold (Wendisch et al., 2024). No INP measurements were conducted during IMPACTS, and therefore a direct comparison cannot be made. Another explanation could be that there is more secondary ice production (SIP) occurring during IMPACTS than during HALO-(AC)3.
Differences between η computed for IWCr and IWCu using the different size bins (Fig. 7f) show that riming increases the probability of IWC clusters for lags smaller than 9 km for small particles during IMPACTS. For medium and large particles, riming increases the probability of IWC clusters at lags smaller than 3 km. For medium and large particles, the enhancement increases as the lag decreases, while for small particles the maximum enhancement occurs at a lag of about 2 km. An enhancement for small particles may indicate SIP associated with riming, such as rime splintering. During HALO-(AC)3 (Fig. 7i), riming enhances the probability of IWC clusters for lags smaller than 4 km for small and medium particles, and the enhancement is generally larger the smaller the lag. For large particles, only lags of about 3–5 km lead to an increase in IWC variability.
4.3.2 Dependency on riming
To understand which spatial scales dominate the riming-driven IWC variability, we perform a Monte Carlo random test for specific sampling distances following Deng et al. (2024). This approach allows us first to handle the flight segments of different lengths in a statistically robust manner and second to analyze the dependence on flight segment distance. For each flight segment, we randomly select a sub-segment with a distance of d km, where we vary d in 1 km steps from 1 to 15 km. We then calculate η for that segment. This is repeated 100 times, and the average η over all (sub)segments of the respective campaign is calculated. In principle, parts of sub-segments can be resampled. However, the sampling process is random. To perform the averaging, we divide η into 200 and 60 m bins for IMPACTS and HALO-(AC)3, respectively, corresponding to the respective distances covered in 1 s for the respective typical flight speeds. The results are shown in Fig. 9, where the average η for Ni, IWCr, and IWCu are plotted as a function of distance d and lag. Curves (shaded) where η=0 are included to show the maximum spatial scales at which ice clusters are likely to occur, given a sampling distance d.
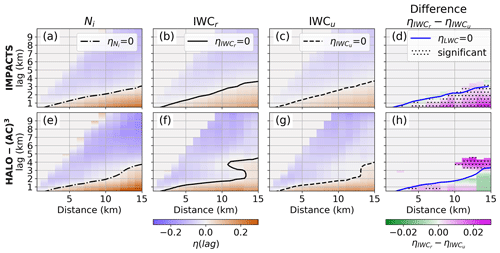
Figure 9Average pair correlation function (PCF) η as a function of distance and lag calculated using all (a–c) IMPACTS and (e–g) HALO-(AC)3 flight segments for (a, e) Ni, (b, f) ice water content (IWC) accounting for riming IWCr, and (c, g) IWC assuming no riming IWCu. The difference between (b) and (c) is shown in (d). The difference between (f) and (g) is shown in (h). Differences in (d) and (h) are only shown where . Areas where differences are significant according to a Student's t test (95 % significance threshold) are hatched. Here, η=0 is drawn as shaded lines for the ice number concentration Ni (dashed–dotted black), IWCr (solid black), IWCu (dashed black), and liquid water content (LWC, solid blue), where LWC measurements from King probe (Nevzorov probe) measurements obtained during IMPACTS (HALO-(AC)3) are used.
During IMPACTS, the maximum Ni cluster spatial scale in clouds increases from 0.6 to 3.1 km at distances d of 2 to 15 km (Fig. 9a). LWC cluster scales measured by the King probe behave similarly to Ni (not shown), and the maximum cluster scales increase from 0.6 to 3.0 km. This suggests simultaneous liquid and ice formation in regions of high supersaturation with respect to ice. Maximum IWC cluster scales (whether or not riming is considered) increase from 0.6 to 3.6 km (Fig. 9b and c). At distances less than 6 km, Ni and IWC have roughly the same cluster scales; at distances greater than 10 km, IWC clusters occur at larger spatial scales. Differences between positive values of IWCr and IWCu (Fig. 9d) reveal that riming enhances the probability of ice clusters for distances greater than 6 km for lags from about 1 to 10 km (at distances of 12 km). To show the statistical significance of this enhancement, a one-sided Student's t test with a significance threshold of 95 % is used. Areas where differences are significant are hatched (Fig. 9d). The enhancement occurs at similar spatial scales as for LWC clusters, suggesting that riming is driven by LWC variability.
During HALO-(AC)3, the maximum Ni cluster spatial scale in clouds increases from 0.5 to 3.7 km at distances of 2 to 15 km (Fig. 9e). Similar to IMPACTS data, LWC clusters measured by the Nevzorov probe behave similarly to Ni clusters, increasing from 0.5 to 3.3 km, but they have slightly smaller spatial scales. Maximum IWC cluster scales, assuming no riming, increase from 0.6 to 3.8 km and thus occur at about the same spatial scales as Ni clusters (Fig. 9g). Accounting for riming, the maximum IWC cluster scales show a distinct behavior for distances larger than 10 km: η increases at 3–5 km, indicating that riming increases variability at these scales (Fig. 9f), which cannot be explained by the LWC variability. Statistically significant differences between positive IWCr and IWCu (Fig. 9h) further highlight this feature.
To explain the different spatial scales at which riming increases IWC variability, we look at lidar-derived CTH. In previous sections, we derived CTH from radar measurements to make IMPACTS and HALO-(AC)3 comparable. For HALO-(AC)3, a more sophisticated CTH product based on lidar – which is more sensitive to liquid layers at cloud top than the radar – is available and is used below. The lidar detects small liquid droplets at cloud top, which follow vertical motions, therefore leading to higher CTH in updraft regions (Abel et al., 2017). When computing the average power spectrum of CTH observed during the flight days studied, distinct peaks at wavelengths of 750 m and 1.2 km occur for all days. These wavelengths correspond to the typical roll cloud and circulation wavelengths as derived by Schirmacher et al. (2024) (Fig. 10a, d, g). At these wavelengths, peaks in LWP also occur for all days (Fig. 10b, e, and h), further indicating enhanced formation and growth of liquid droplets in the updraft regions of the convectional cell cloud structures. On 28 March, a prominent peak in the CTH spectrum at 3–5 km indicates additional mesoscale updraft features (Fig. 10a). However, the LWP spectrum shows only a weak peak around 5 km (Fig. 10b). On 1 April, both CTH and LWP power spectra have peaks at 3–5 km (Fig. 10d and e). On 4 April, there are no prominent peaks at wavelengths of 3–5 km (Fig. 10g and h). Given that the least (most) amount of riming (Fig. 10c, f, and i) occurred on 4 (1) April, we conclude that in the studied MCAO clouds, mesoscale updraft features likely enhance riming at spatial scales of 3–5 km. The enhancement could be due to prolonged lifetimes of ice crystals in clouds (28 March), increased amounts of liquid water, or both (1 April), and this leads to an increase in IWC amount and variability.
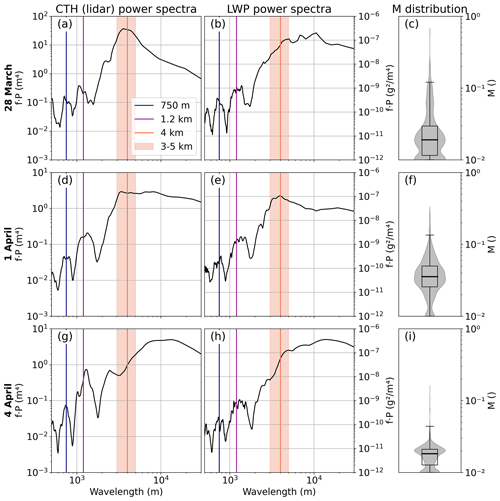
Figure 10Power spectra of (a), (d), and (g) cloud top height (CTH) as derived from lidar and (b), (e), and (h) liquid water path (LWP) during colocated HALO-(AC)3 flight days. The wavelength has been calculated based on the aircraft flight speed. The blue and purple lines show the typical roll cloud and circulation wavelengths as derived by Schirmacher et al. (2024). The shaded orange area shows the 3–5 km range, where riming causes additional IWC clustering. Panels (c), (f), and (i) show the corresponding normalized rime mass M distributions.
4.4 A conceptual model of how riming impacts IWC clusters in MCAO roll clouds
The results discussed above help to better understand scales of in-cloud IWC clustering in different types of MPCs and link them to some of the microphysical processes involved. Although there are significant unknowns, the following summarizes our findings from the perspective of colocated remote sensing and in situ measurements.
In the analyzed segments of winter storm clouds measured during IMPACTS, IWC clusters occur at spatial scales smaller than about 3 km for segment distances of 15 km. Accounting for riming increases the probability of ice clusters (Fig. 9d). However, riming does not significantly increase the occurrences of IWC clusters at specific scales. LWC clusters for segment distances of 15 km occur at the same spatial scales of about 3 km as clusters of Ni. Therefore, liquid droplets and ice particles are likely to form together in regions of supersaturation with respect to liquid and ice. Since LWC clusters and the IWC cluster enhancement by riming occur at similar spatial scales, we hypothesize that LWC variability (at least in part) drives riming. By increasing IWC, riming leads to increased probabilities of IWC clusters for IMPACTS.
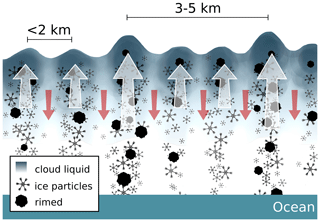
For HALO-(AC)3, Fig. 11 shows a sketch of the maximum spatial scales, where we found ice clusters to occur for MPCs observed during MCAOs. In these MCAO roll clouds, ice clusters occur on spatial scales of the roll cloud wavelengths. In the updraft regions of the convective cells, which occurred on average every 750 m and 1.2 km, liquid droplets and ice particles are formed. LWP and CTH are increased by vertical motions and condensational growth. Ice particles grow through depositional growth and riming, leading to enhanced probabilities of ice clusters at these scales. When an ice particle's mass has increased sufficiently, it may precipitate or sublimate below cloud. Aggregation can occur when ice particles collide. In the presence of additional mesoscale updraft features, IWC clusters also occur at spatial scales of 3–5 km (Fig. 9h). Due to the increased vertical motion, ice particles are suspended longer, have more time to rime, and can reach higher masses before precipitating. Increased LWP may enhance the amount of riming but is not a necessary criterion based on the cases analyzed. This hypothesis is supported by the fact that the observed LWP is not sufficient to explain the retrieved rime masses, assuming that particles continuously collect liquid water by falling through the liquid layer, as we show in Appendix C. The enhanced occurrence of riming drives the additional increase in IWC cluster probability on spatial scales of 3–5 km.
In this study, we use airborne measurements of mid-latitude and high-latitude mixed-phase clouds (MPCs) to investigate the spatial variability of ice clusters within clouds. We further investigate how this variability is linked to riming, which we quantify through the closure of colocated cloud radar reflectivity and in situ particle size distribution (PSD) measurements. The pair correlation function (PCF) is used to quantify the spatial scales of ice clusters and the variability of ice water content (IWC) when accounting for riming (IWCr) and neglecting riming (IWCu). The main findings are as follows.
-
Although the synoptic situations and the resulting cloud systems were vastly different during the two aircraft campaigns analyzed, the retrieved amounts of riming were similar. The median normalized rime mass M was 0.023 and 0.024 during IMPACTS (mid-latitude winter storms) and HALO-(AC)3 (Arctic MCAO roll clouds) segments, respectively (Fig. 5). Clouds were deep (shallow) during IMPACTS (HALO-(AC)3) segments, and in situ measurements were conducted at an average vertical distance of 3.3 km (440 m) from the cloud top.
-
The observed spread of M can increase IWC by up to 2 orders of magnitude, depending on the size of the particle population (Fig. 6). In sum, the rime mass makes up about 66 % and 63 % of the total IWC during the analyzed IMPACTS and HALO-(AC)3 flight segments, respectively. Therefore, riming has a similar impact on IWC to the observed spread of number concentration and should not be neglected when estimating IWC.
-
PCF revealed that Ni clusters occur with increased probability at spatial scales smaller than 10.5 and 6.5 km within clouds during IMPACTS and HALO-(AC)3, respectively. IWC clusters dominate for spatial scales of 10 and 7 km. For IMPACTS, small particles dominate Ni and IWC variability on small spatial scales, while for HALO-(AC)3 there is no particle size dependence (Fig. 7). This could be related to ice formation processes and the higher availability of INP at mid-latitudes. However, this hypothesis could not be confirmed with the available data.
-
During IMPACTS, the maximum spatial scales of Ni, IWC, and LWC clusters inside clouds are 0.6–3 km for distances of 2–15 km. During HALO-(AC)3, the maximum spatial scales of Ni, IWC, and LWC clusters are similar, with about 0.5 km for distances of 2 km and about 4 km for 15 km. However, for IWC during HALO-(AC)3, the probability of cluster occurrence is increased on scales of 3–5 km when segment distances are larger than 10 km (Fig. 9).
-
During IMPACTS, accounting for riming does not significantly change IWC cluster scales in clouds but increases the probability of clusters for segment distances larger than 6 km (Fig. 9d). This enhancement occurs at scales similar to LWC variability. More riming is likely to occur in regions of enhanced LWC, increasing IWC. Since clusters of IWC neglecting riming have similar spatial scales to Ni, LWC, and IWC accounting for riming, ice clustering is likely linked to ice formation processes in regions of high supersaturation with respect to liquid and ice.
-
In contrast, riming impacts IWC clustering in clouds at two distinct scales during HALO-(AC)3 (Fig. 9h). First, riming increases the probability of IWC clusters at spatial scales below 2 km, which corresponds to the wavelength of the roll cloud updraft features. Ni, IWCr, IWCu, and LWC all have similar spatial variability, indicating simultaneous ice and liquid formation and growth in these regions. Increased LWC again increases riming, which increases IWC. Second, riming leads to IWC clustering on spatial scales of 3–5 km, which cannot be explained by the typical roll cloud and roll circulation wavelengths. Power spectra of CTH show peaks at these spatial scales on the flight days with enhanced riming (Fig. 10). This suggests that the presence of mesoscale updraft features – which cause greater CTH through lifting of small particles near cloud top – leads to enhanced occurrence of riming and hence additional IWC clustering. Increased LWP may enhance the effect but is not a necessary criterion based on the cases analyzed. Theoretical analysis shows that updrafts are likely necessary to explain the observed riming values (Fig. C1).
These results help to improve our understanding of how riming is linked to in-cloud IWC variability and can be used to evaluate and constrain models' representations of MPCs. While we have shown that riming enhances in-cloud IWC variability and causes additional IWC clustering at large spatial scales of 3–5 km in Arctic MCAO clouds, further research is needed to link these results to surface precipitation. Future studies should investigate the link between riming-driven IWC variability and snowfall variability. In addition, profiles of vertical wind speed and turbulence are needed to better understand their importance for riming.
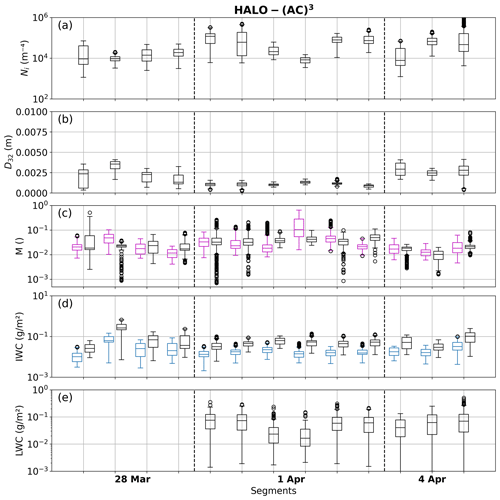
Figure A1 (Fig. A2) presents an overview of microphysical parameters (Ni, D32, M, IWC, LWC) observed during each analyzed IMPACTS (HALO-(AC)3) segment. Case study 1 (case study 2) is the fifth segment on 5 February (second segment on 1 April).
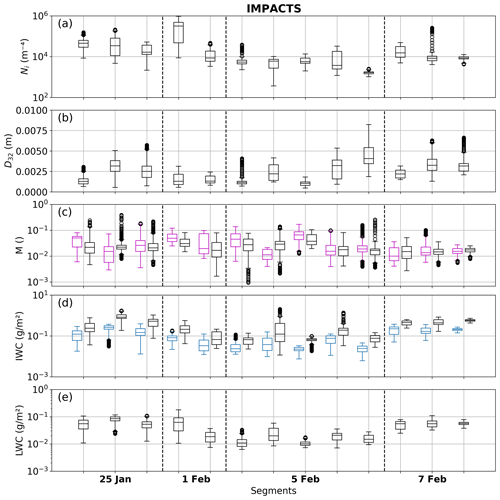
Figure A1Boxplots of (a) ice number concentration Ni, (b) mass-weighted diameter D32, (c) normalized rime mass M, (d) ice water content (IWC), and (e) liquid water content (LWC) derived during each IMPACTS segment. In (c) combined (Ku band) and in situ method results are shown in black and magenta, respectively. In (d) IWC is calculated when accounting for riming (using the combined method M; black) and neglecting riming (M=0, blue).
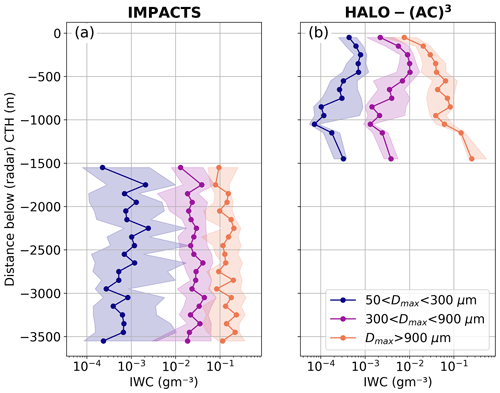
To investigate whether size sorting is the reason for the particle size dependence of Ni and IWC variability (Sect. 4.3.1), we show vertical distributions of Ni and IWC for the different size ranges in Figs. B1 and B2, respectively. Data during colocated segments are binned by their distance to CTH (as derived from radar measurements) in 100 m bins. Only bins with at least 100 data points are shown. This leaves no data for 1.5 km below cloud top during IMPACTS. While HALO-(AC)3 data show size sorting near the cloud top for both Ni and IWC, this is not the case for IMPACTS. However, size sorting could have occurred in the vertical region where we lack data. Nevertheless, Ni and IWC for small particles show much larger variability during IMPACTS than during HALO-(AC)3, regardless of the distance to cloud top.
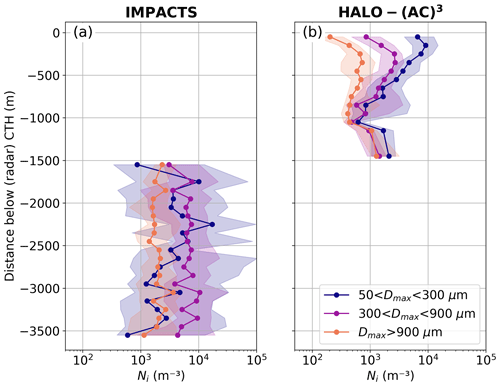
Figure B1Distribution of ice number concentration Ni as a function of distance to cloud top height (CTH, derived by radar) for (a) IMPACTS and (b) HALO-(AC)3. Lines and markers show median values, while 25 %–75 % quantiles are shaded. Contributions of small (50–300 µm), medium (300–900 µm), and large (>900 µm) particles are shown in blue, purple, and orange, respectively.
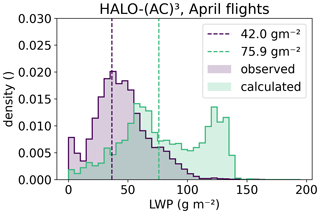
This section shows the need for updrafts to explain the retrieved amounts of riming given the observed LWPs. We use simple calculations based on Fitch and Garrett (2022). Assuming that a particle collects rime by falling through a liquid layer, the mass of rime accumulated can be approximated by
where Ap is the cross-sectional area of the particle, Ec is the combined collection and collision efficiency, and LWP is the liquid water path of the liquid layer. By inserting the definition of M; approximating Ap by a power law function of Dmax with prefactor aA and exponent bA following Maherndl et al. (2023a); and solving for LWP, we derive
Here, Ec is assumed to be 1 as a worst-case estimate, although lower values are more realistic in the Arctic (Fitch and Garrett, 2022). Equation (C2) applies only for ice particles that have finished the riming process. It is therefore only applied to HALO-(AC)3 data, where LWC=0 was measured, thus excluding 28 March data, where LWC measurements are not available. Because ice particles occur in PSDs, we apply Eq. (C2) to D32 as a proxy for the characteristic size and the respective M we retrieved for each time step. Compared to LWP observations during 1 and 4 April, the calculated LWP is much higher (Fig. C1). Therefore, it is evident that the particles must have been exposed to the liquid layer multiple times, e.g., by cycling through updraft and downdraft regions.
Processed in situ data (https://doi.org/10.1594/PANGAEA.963247, Moser et al., 2023a), Nevzorov probe data (https://doi.org/10.1594/PANGAEA.963628, Lucke et al., 2024), MiRAC-A data (https://doi.org/10.1594/PANGAEA.964977, Mech et al., 2024a), and AMALi CTH data (https://doi.org/10.1594/PANGAEA.96498, Mech et al., 2024b) from the HALO-(AC)3 campaign are available on PANGAEA. The IMPACTS data (https://doi.org/10.5067/IMPACTS/DATA101, McMurdie et al., 2019) and the individual datasets cited within this paper can be found at the NASA Global Hydrology Resource Center's DAAC. The dataset of simulated rimed aggregates generated for Maherndl et al. (2023a) is available at https://doi.org/10.5281/zenodo.7757034 (Maherndl et al., 2023b). HALO-(AC)3 datasets used in this study can be accessed via the ac3airborne intake catalog (https://doi.org/10.5281/zenodo.7305586, Mech et al., 2022b). Processing routines to read IMPACTS data are available via the impacts_tools repository (https://github.com/joefinlon/impacts_tools, IMPACTS contributors, 2024).
NM conceptualized the study, analyzed and plotted the data, and wrote the paper. MMa contributed to the concept, acquired funding, and supervised the research project. MMo and CV collected and processed CDP, CIP, and PIP data during HALO-(AC)3 and provided combined size distributions. JL collected and processed Nevzorov probe data during HALO-(AC)3. IS collected and processed AMALi data during HALO-(AC)3 and retrieved the CTH product. AB collected and processed CDP, Fast-CDP, 2D-S, and HVPS-3 data during IMPACTS and provided combined size distributions. All authors reviewed and edited the draft.
The contact author has declared that none of the authors has any competing interests.
Publisher's note: Copernicus Publications remains neutral with regard to jurisdictional claims made in the text, published maps, institutional affiliations, or any other geographical representation in this paper. While Copernicus Publications makes every effort to include appropriate place names, the final responsibility lies with the authors.
This article is part of the special issue “HALO-(AC)3 – an airborne campaign to study air mass transformations during warm-air intrusions and cold-air outbreaks”. It is not associated with a conference.
We gratefully acknowledge funding from the Deutsche Forschungsgemeinschaft (DFG, German Research Foundation) within the framework of the Transregional Collaborative Research Center “Arctic Amplification: Climate Relevant Atmospheric and Surface Processes, and Feedback Mechanisms” project ((AC)3; grant no. 268020496–TRR 172).
Sea ice concentration data from 20 March to 10 April 2022 were obtained from https://www.meereisportal.de (last access: 2 June 2023) (grant no. REKLIM-2013-04).
We thank Mario Mech and Nils Risse from the University of Cologne for providing processed MiRAC-A and AMALi data (together with Imke Schirmacher) and the retrieved LWP product during HALO-(AC)3. Further, we thank Christof Lüpkes and Jörg Hartmann from the Alfred Wegener Institute (AWI) for providing Polar 6 nose boom air temperature measurements. We also thank Gerald M. Heymsfield, Matthew Walker McLinden, and Li Lihua from the NASA Goddard Space Flight Center for providing EXRAD, HIWRAP, and CRS data during IMPACTS. We are grateful to Joseph A. Finlon from the University of Washington for providing processing routines for the IMPACTS data. Further, we would like to acknowledge discussions with Matthew D. Shupe (University of Colorado and National Oceanographic and Atmospheric Administration), Heike Kalesse-Los (Leipzig University), and Patric Seifert (Leibniz Institute for Tropospheric Research), among others, whose feedback helped to shape the analysis.
This research has been supported by the Deutsche Forschungsgemeinschaft (grant no. 268020496-TRR 172).
This paper was edited by Yi Huang and reviewed by two anonymous referees.
Abel, S. J., Boutle, I. A., Waite, K., Fox, S., Brown, P. R. A., Cotton, R., Lloyd, G., Choularton, T. W., and Bower, K. N.: The Role of Precipitation in Controlling the Transition from Stratocumulus to Cumulus Clouds in a Northern Hemisphere Cold-Air Outbreak, J. Atmos. Sci., 74, 2293–2314, https://doi.org/10.1175/JAS-D-16-0362.1, 2017. a
Baker, B. and Lawson, R. P.: Analysis of Tools Used to Quantify Droplet Clustering in Clouds, J. Atmos. Sci., 67, 3355–3367, https://doi.org/10.1175/2010JAS3409.1, 2010. a
Bansemer, A., Delene, D., Heymsfield, A. J., O'Brien, J., Poellot, M. R., Sand, K., Sova, G., Moore, J., and Nairy, C.: NCAR Particle Probes IMPACTS.Dataset available online from the NASA Global Hydrometeorology Resource Center DAAC, Huntsville, Alabama, U.S.A. [data set], https://doi.org/10.5067/IMPACTS/PROBES/DATA101, 2022. a
Baumgardner, D., Jonsson, H., Dawson, W., O'Connor, D., and Newton, R.: The Cloud, Aerosol and Precipitation Spectrometer: A New Instrument for Cloud Investigations, Atmos. Res., 59–60, 251–264, https://doi.org/10.1016/S0169-8095(01)00119-3, 2001. a, b
Baumgardner, D., Abel, S. J., Axisa, D., Cotton, R., Crosier, J., Field, P., Gurganus, C., Heymsfield, A., Korolev, A., Krämer, M., Lawson, P., McFarquhar, G., Ulanowski, Z., and Um, J.: Cloud Ice Properties: In Situ Measurement Challenges, Meteor. Mon., 58, 9.1–9.23, https://doi.org/10.1175/AMSMONOGRAPHS-D-16-0011.1, 2017. a
Bjordal, J., Storelvmo, T., Alterskjær, K., and Carlsen, T.: Equilibrium Climate Sensitivity above 5 °C Plausible Due to State-Dependent Cloud Feedback, Nat. Geosci., 13, 718–721, https://doi.org/10.1038/s41561-020-00649-1, 2020. a
Bock, J., Michou, M., Nabat, P., Abe, M., Mulcahy, J. P., Olivié, D. J. L., Schwinger, J., Suntharalingam, P., Tjiputra, J., van Hulten, M., Watanabe, M., Yool, A., and Séférian, R.: Evaluation of ocean dimethylsulfide concentration and emission in CMIP6 models, Biogeosciences, 18, 3823–3860, https://doi.org/10.5194/bg-18-3823-2021, 2021. a
Cao, Q., Huang, Y., Zou, J., Lin, W., Zhou, X., Li, H., and Zhang, X.: Predicted Particle Properties (P3) Microphysics Scheme Coupled With WRF-Chem Model: Evaluation With Convective and Stratiform Cases, J. Geophys. Res.-Atmos., 128, e2022JD037685, https://doi.org/10.1029/2022JD037685, 2023. a
Chase, R. J., Finlon, J. A., Borque, P., McFarquhar, G. M., Nesbitt, S. W., Tanelli, S., Sy, O. O., Durden, S. L., and Poellot, M. R.: Evaluation of Triple-Frequency Radar Retrieval of Snowfall Properties Using Coincident Airborne In Situ Observations During OLYMPEX, Geophys. Res. Lett., 45, 5752–5760, https://doi.org/10.1029/2018GL077997, 2018. a
Choi, Y.-S., Ho, C.-H., Park, C.-E., Storelvmo, T., and Tan, I.: Influence of Cloud Phase Composition on Climate Feedbacks, J. Geophys. Res.-Atmos., 119, 3687–3700, https://doi.org/10.1002/2013JD020582, 2014. a
Connelly, R. and Colle, B. A.: Validation of Snow Multibands in the Comma Head of an Extratropical Cyclone Using a 40-Member Ensemble, Weather Forecast., 34, 1343–1363, https://doi.org/10.1175/WAF-D-18-0182.1, 2019. a
Delanoë, J., Protat, A., Testud, J., Bouniol, D., Heymsfield, A. J., Bansemer, A., Brown, P. R. A., and Forbes, R. M.: Statistical Properties of the Normalized Ice Particle Size Distribution, J. Geophys. Res.-Atmos., 110, D10201, https://doi.org/10.1029/2004JD005405, 2005. a
Delanoë, J. M. E., Heymsfield, A. J., Protat, A., Bansemer, A., and Hogan, R. J.: Normalized Particle Size Distribution for Remote Sensing Application, J. Geophys. Res.-Atmos., 119, 4204–4227, https://doi.org/10.1002/2013JD020700, 2014. a
Deng, Y., Yang, J., Yin, Y., Cui, S., Zhang, B., Bao, X., Chen, B., Li, J., Gao, W., and Jing, X.: Quantifying the Spatial Inhomogeneity of Ice Concentration in Mixed-Phase Stratiform Cloud Using Airborne Observation, Atmos. Res., 298, 107153, https://doi.org/10.1016/j.atmosres.2023.107153, 2024. a, b, c, d, e, f, g
Erfani, E. and Mitchell, D. L.: Growth of ice particle mass and projected area during riming, Atmos. Chem. Phys., 17, 1241–1257, https://doi.org/10.5194/acp-17-1241-2017, 2017. a, b
Field, P. R., Hogan, R. J., Brown, P. R. A., Illingworth, A. J., Choularton, T. W., Kaye, P. H., Hirst, E., and Greenaway, R.: Simultaneous Radar and Aircraft Observations of Mixed-Phase Cloud at the 100 m Scale, Q. J. Roy. Meteor. Soc., 130, 1877–1904, https://doi.org/10.1256/qj.03.102, 2004. a
Finlon, J. A., McMurdie, L. A., and Chase, R. J.: Investigation of Microphysical Properties within Regions of Enhanced Dual-Frequency Ratio during the IMPACTS Field Campaign, J. Atmos. Sci., 79, 2773–2795, https://doi.org/10.1175/JAS-D-21-0311.1, 2022. a, b
Fitch, K. E. and Garrett, T. J.: Graupel Precipitating From Thin Arctic Clouds With Liquid Water Paths Less Than 50 g m−2, Geophys. Res. Lett., 49, e2021GL094075, https://doi.org/10.1029/2021GL094075, 2022. a, b, c
Harimaya, T. and Sato, M.: Measurement of the Riming Amount on Snowflakes, Journal of the Faculty of Science, Hokkaido University, 8, 355–366, 1989. a
Heymsfield, A. J.: A Comparative Study of the Rates of Development of Potential Graupel and Hail Embryos in High Plains Storms, J. Atmos. Sci., 39, 2867–2897, https://doi.org/10.1175/1520-0469(1982)039<2867:ACSOTR>2.0.CO;2, 1982. a
Heymsfield, A. J., Schmitt, C., Bansemer, A., and Twohy, C. H.: Improved Representation of Ice Particle Masses Based on Observations in Natural Clouds, J. Atmos. Sci., 67, 3303–3318, https://doi.org/10.1175/2010JAS3507.1, 2010. a, b
Heymsfield, G. M., Bidwell, S. W., Caylor, I. J., Ameen, S., Nicholson, S., Boncyk, W., Miller, L., Vandemark, D., Racette, P. E., and Dod, L. R.: The EDOP Radar System on the High-Altitude NASA ER-2 Aircraft, J. Atmos. Ocean. Tech., 13, 795–809, https://doi.org/10.1175/1520-0426(1996)013<0795:TERSOT>2.0.CO;2, 1996. a
Heymsfield, G. M., Li, L., and McLinden, M.: ER-2 X-Band Doppler Radar (EXRAD) IMPACTS. Dataset available online from the NASA Global Hydrometeorology Resource Center DAAC, Huntsville, Alabama, U.S.A. [data set], https://doi.org/10.5067/IMPACTS/EXRAD/DATA101, 2022. a
Houze, R. A., McMurdie, L. A., Petersen, W. A., Schwaller, M. R., Baccus, W., Lundquist, J. D., Mass, C. F., Nijssen, B., Rutledge, S. A., Hudak, D. R., Tanelli, S., Mace, G. G., Poellot, M. R., Lettenmaier, D. P., Zagrodnik, J. P., Rowe, A. K., DeHart, J. C., Madaus, L. E., Barnes, H. C., and Chandrasekar, V.: The Olympic Mountains Experiment (OLYMPEX), B. Am. Meteorol. Soc., 98, 2167–2188, https://doi.org/10.1175/BAMS-D-16-0182.1, 2017. a
IMPACTS contributors: impacts_tools, GitHub [code], https://github.com/joefinlon/impacts_tools, last access: 18 April 2024. a
King, W. D., Parkin, D. A., and Handsworth, R. J.: A Hot-Wire Liquid Water Device Having Fully Calculable Response Characteristics, J. Appl. Meteorol. Clim., 17, 1809–1813, https://doi.org/10.1175/1520-0450(1978)017<1809:AHWLWD>2.0.CO;2, 1978. a
Kirschler, S., Voigt, C., Anderson, B. E., Chen, G., Crosbie, E. C., Ferrare, R. A., Hahn, V., Hair, J. W., Kaufmann, S., Moore, R. H., Painemal, D., Robinson, C. E., Sanchez, K. J., Scarino, A. J., Shingler, T. J., Shook, M. A., Thornhill, K. L., Winstead, E. L., Ziemba, L. D., and Sorooshian, A.: Overview and statistical analysis of boundary layer clouds and precipitation over the western North Atlantic Ocean, Atmos. Chem. Phys., 23, 10731–10750, https://doi.org/10.5194/acp-23-10731-2023, 2023. a
Kneifel, S. and Moisseev, D.: Long-Term Statistics of Riming in Nonconvective Clouds Derived from Ground-Based Doppler Cloud Radar Observations, J. Atmos. Sci., 77, 3495–3508, https://doi.org/10.1175/JAS-D-20-0007.1, 2020. a
Korolev, A. and Milbrandt, J.: How Are Mixed-Phase Clouds Mixed?, Geophys. Res. Lett., 49, e2022GL099578, https://doi.org/10.1029/2022GL099578, 2022. a, b
Korolev, A., Emery, E., and Creelman, K.: Modification and Tests of Particle Probe Tips to Mitigate Effects of Ice Shattering, J. Atmos. Ocean. Tech., 30, 690–708, https://doi.org/10.1175/JTECH-D-12-00142.1, 2013. a
Korolev, A., McFarquhar, G., Field, P. R., Franklin, C., Lawson, P., Wang, Z., Williams, E., Abel, S. J., Axisa, D., Borrmann, S., Crosier, J., Fugal, J., Krämer, M., Lohmann, U., Schlenczek, O., Schnaiter, M., and Wendisch, M.: Mixed-Phase Clouds: Progress and Challenges, Meteor. Mon., 58, 5.1–5.50, https://doi.org/10.1175/AMSMONOGRAPHS-D-17-0001.1, 2017. a
Korolev, A. V., Strapp, J. W., Isaac, G. A., and Nevzorov, A. N.: The Nevzorov Airborne Hot-Wire LWC–TWC Probe: Principle of Operation and Performance Characteristics, J. Atmos. Ocean. Tech., 15, 1495–1510, https://doi.org/10.1175/1520-0426(1998)015<1495:TNAHWL>2.0.CO;2, 1998. a
Korolev, A. V., Isaac, G. A., Cober, S. G., Strapp, J. W., and Hallett, J.: Microphysical Characterization of Mixed-Phase Clouds, Q. J. Roy. Meteor. Soc., 129, 39–65, https://doi.org/10.1256/qj.01.204, 2003. a
Kostinski, A. B. and Jameson, A. R.: On the Spatial Distribution of Cloud Particles, J. Atmos. Sci., 57, 901–915, https://doi.org/10.1175/1520-0469(2000)057<0901:OTSDOC>2.0.CO;2, 2000. a
Kostinski, A. B. and Shaw, R. A.: Scale-Dependent Droplet Clustering in Turbulent Clouds, J. Fluid Mech., 434, 389–398, https://doi.org/10.1017/S0022112001004001, 2001. a
Lance, S., Brock, C. A., Rogers, D., and Gordon, J. A.: Water droplet calibration of the Cloud Droplet Probe (CDP) and in-flight performance in liquid, ice and mixed-phase clouds during ARCPAC, Atmos. Meas. Tech., 3, 1683–1706, https://doi.org/10.5194/amt-3-1683-2010, 2010. a
Lawson, P., Gurganus, C., Woods, S., and Bruintjes, R.: Aircraft Observations of Cumulus Microphysics Ranging from the Tropics to Midlatitudes: Implications for a “New” Secondary Ice Process, J. Atmos. Sci., 74, 2899–2920, https://doi.org/10.1175/JAS-D-17-0033.1, 2017. a
Lawson, R. P., Stewart, R. E., and Angus, L. J.: Observations and Numerical Simulations of the Origin and Development of Very Large Snowflakes, J. Atmos. Sci., 55, 3209–3229, https://doi.org/10.1175/1520-0469(1998)055<3209:OANSOT>2.0.CO;2, 1998. a
Lawson, R. P., O'Connor, D., Zmarzly, P., Weaver, K., Baker, B., Mo, Q., and Jonsson, H.: The 2D-S (Stereo) Probe: Design and Preliminary Tests of a New Airborne, High-Speed, High-Resolution Particle Imaging Probe, J. Atmos. Ocean. Tech., 23, 1462–1477, https://doi.org/10.1175/JTECH1927.1, 2006. a
Li, L., Heymsfield, G., Carswell, J., Schaubert, D. H., McLinden, M. L., Creticos, J., Perrine, M., Coon, M., Cervantes, J. I., Vega, M., Guimond, S., Tian, L., and Emory, A.: The NASA High-Altitude Imaging Wind and Rain Airborne Profiler, IEEE T. Geosci. Remote, 54, 298–310, https://doi.org/10.1109/TGRS.2015.2456501, 2016. a
Li, L., McLinden, M., and Heymsfield, G. M.: High Altitude Imaging Wind and Rain Airborne Profiler (HIWRAP) IMPACTS. Dataset available online from the NASA Global Hydrometeorology Resource Center DAAC, Huntsville, Alabama, U.S.A. [data set], https://doi.org/10.5067/IMPACTS/HIWRAP/DATA101, 2022. a
Lucke, J., Jurkat-Witschas, T., Heller, R., Hahn, V., Hamman, M., Breitfuss, W., Bora, V. R., Moser, M., and Voigt, C.: Icing wind tunnel measurements of supercooled large droplets using the 12 mm total water content cone of the Nevzorov probe, Atmos. Meas. Tech., 15, 7375–7394, https://doi.org/10.5194/amt-15-7375-2022, 2022. a
Lucke, J., Moser, M., De La Torre Castro, E., Mayer, J., and Voigt, C.: Nevzorov LWC and TWC data from the HALO-AC3 campaign in March and April 2022, PANGAEA [data set], https://doi.org/10.1594/PANGAEA.963628, 2024. a, b
Maahn, M. and Löhnert, U.: Potential of Higher-Order Moments and Slopes of the Radar Doppler Spectrum for Retrieving Microphysical and Kinematic Properties of Arctic Ice Clouds, J. Appl. Meteorol. Clim., 56, 263–282, https://doi.org/10.1175/JAMC-D-16-0020.1, 2017. a
Maahn, M., Löhnert, U., Kollias, P., Jackson, R. C., and McFarquhar, G. M.: Developing and Evaluating Ice Cloud Parameterizations for Forward Modeling of Radar Moments Using in Situ Aircraft Observations, J. Atmos. Ocean. Tech., 32, 880–903, https://doi.org/10.1175/JTECH-D-14-00112.1, 2015. a, b, c
Maherndl, N., Maahn, M., Tridon, F., Leinonen, J., Ori, D., and Kneifel, S.: A Riming-Dependent Parameterization of Scattering by Snowflakes Using the Self-Similar Rayleigh–Gans Approximation, Q. J. Roy. Meteor. Soc., 149, 3562–3581, https://doi.org/10.1002/qj.4573, 2023a. a, b, c, d, e, f, g, h, i, j
Maherndl, N., Maahn, M., Tridon, F., Leinonen, J., Ori, D., and Kneifel, S.: Data set of simulated rimed aggregates for “A riming-dependent parameterization of scattering by snowflakes using the self-similar Rayleigh-Gans approximation”, Zenodo [data set], https://doi.org/10.5281/zenodo.7757034, 2023b. a, b
Maherndl, N., Moser, M., Lucke, J., Mech, M., Risse, N., Schirmacher, I., and Maahn, M.: Quantifying riming from airborne data during the HALO-(AC)3 campaign, Atmos. Meas. Tech., 17, 1475–1495, https://doi.org/10.5194/amt-17-1475-2024, 2024. a, b, c, d, e, f, g, h, i, j, k, l, m, n, o, p, q, r, s, t
Mason, S. L., Chiu, C. J., Hogan, R. J., Moisseev, D., and Kneifel, S.: Retrievals of Riming and Snow Density From Vertically Pointing Doppler Radars, J. Geophys. Res.-Atmos., 123, 13807–13834, https://doi.org/10.1029/2018JD028603, 2018. a
McLinden, M., Li, L., and Heymsfield, G. M.: Cloud Radar System (CRS) IMPACTS. Dataset available online from the NASA Global Hydrometeorology Resource Center DAAC, Huntsville, Alabama, U.S.A. [data set], https://doi.org/10.5067/IMPACTS/CRS/DATA101, 2022. a
McLinden, M. L. W., Li, L., Heymsfield, G. M., Coon, M., and Emory, A.: The NASA GSFC 94-GHz Airborne Solid-State Cloud Radar System (CRS), J. Atmos. Ocean. Tech., 38, 1001–1017, https://doi.org/10.1175/JTECH-D-20-0127.1, 2021. a
McMurdie, L. A., Heymsfield, G., Yorks, J. E., and Braun, S. A.: Investigation of Microphysics and Precipitation for Atlantic Coast-Threatening Snowstorms (IMPACTS) Collection, https://ghrc.nsstc.nasa.gov/home/field-campaigns/impacts, last access: 8 October 2024, NASA EOSDIS Global Hydrology Resource Center Distributed Active Archive Center, Huntsville, Alabama, U.S.A. [data set], https://doi.org/10.5067/IMPACTS/DATA101, 2019. a
McMurdie, L. A., Heymsfield, G. M., Yorks, J. E., Braun, S. A., Skofronick-Jackson, G., Rauber, R. M., Yuter, S., Colle, B., McFarquhar, G. M., Poellot, M., Novak, D. R., Lang, T. J., Kroodsma, R., McLinden, M., Oue, M., Kollias, P., Kumjian, M. R., Greybush, S. J., Heymsfield, A. J., Finlon, J. A., McDonald, V. L., and Nicholls, S.: Chasing Snowstorms: The Investigation of Microphysics and Precipitation for Atlantic Coast-Threatening Snowstorms (IMPACTS) Campaign, B. Am. Meteorol. Soc., 103, E1243–E1269, https://doi.org/10.1175/BAMS-D-20-0246.1, 2022. a, b, c, d
Mech, M., Kliesch, L.-L., Anhäuser, A., Rose, T., Kollias, P., and Crewell, S.: Microwave Radar/radiometer for Arctic Clouds (MiRAC): first insights from the ACLOUD campaign, Atmos. Meas. Tech., 12, 5019–5037, https://doi.org/10.5194/amt-12-5019-2019, 2019. a, b, c
Mech, M., Maahn, M., Kneifel, S., Ori, D., Orlandi, E., Kollias, P., Schemann, V., and Crewell, S.: PAMTRA 1.0: the Passive and Active Microwave radiative TRAnsfer tool for simulating radiometer and radar measurements of the cloudy atmosphere, Geosci. Model Dev., 13, 4229–4251, https://doi.org/10.5194/gmd-13-4229-2020, 2020. a
Mech, M., Ehrlich, A., Herber, A., Lüpkes, C., Wendisch, M., Becker, S., Boose, Y., Chechin, D., Crewell, S., Dupuy, R., Gourbeyre, C., Hartmann, J., Jäkel, E., Jourdan, O., Kliesch, L.-L., Klingebiel, M., Kulla, B. S., Mioche, G., Moser, M., Risse, N., Ruiz-Donoso, E., Schäfer, M., Stapf, J., and Voigt, C.: MOSAiC-ACA and AFLUX – Arctic Airborne Campaigns Characterizing the Exit Area of MOSAiC, Scientific Data, 9, 790, https://doi.org/10.1038/s41597-022-01900-7, 2022a. a, b
Mech, M., Risse, N., Marrollo, G., and Paul, D.: ac3airborne, Zenodo [data set] https://doi.org/10.5281/zenodo.7305586, 2022b. a
Mech, M., Risse, N., Krobot, P., Paul, D., Schirmacher, I., Schnitt, S., and Crewell, S.: Radar reflectivities at 94 GHz and microwave brightness temperature measurements at 89 GHz during the HALO-AC3 Arctic airborne campaign, PANGAEA [data set], https://doi.org/10.1594/PANGAEA.964977, 2024a. a, b
Mech, M., Risse, N., Ritter, C., Schirmacher, I., and Schween, J. H.: Cloud mask and cloud top altitude from the AMALi airborne lidar on Polar 5 during HALO-AC3 in spring 2022, PANGAEA [data set], https://doi.org/10.1594/PANGAEA.964985, 2024b. a, b
Mitchell, D. L.: Use of Mass- and Area-Dimensional Power Laws for Determining Precipitation Particle Terminal Velocities, J. Atmos. Sci., 53, 1710–1723, https://doi.org/10.1175/1520-0469(1996)053<1710:UOMAAD>2.0.CO;2, 1996. a, b
Moisseev, D., von Lerber, A., and Tiira, J.: Quantifying the Effect of Riming on Snowfall Using Ground-Based Observations, J. Geophys. Res.-Atmos., 122, 4019–4037, https://doi.org/10.1002/2016JD026272, 2017. a
Morrison, H. and Milbrandt, J. A.: Parameterization of Cloud Microphysics Based on the Prediction of Bulk Ice Particle Properties. Part I: Scheme Description and Idealized Tests, J. Atmos. Sci., 72, 287–311, https://doi.org/10.1175/JAS-D-14-0065.1, 2015. a
Morrison, H., de Boer, G., Feingold, G., Harrington, J., Shupe, M. D., and Sulia, K.: Resilience of Persistent Arctic Mixed-Phase Clouds, Nat. Geosci., 5, 11–17, https://doi.org/10.1038/ngeo1332, 2012. a, b
Morrison, H., van Lier-Walqui, M., Fridlind, A. M., Grabowski, W. W., Harrington, J. Y., Hoose, C., Korolev, A., Kumjian, M. R., Milbrandt, J. A., Pawlowska, H., Posselt, D. J., Prat, O. P., Reimel, K. J., Shima, S.-I., van Diedenhoven, B., and Xue, L.: Confronting the Challenge of Modeling Cloud and Precipitation Microphysics, J. Adv. Model. Earth Sy., 12, e2019MS001689, https://doi.org/10.1029/2019MS001689, 2020. a
Moser, M., Lucke, J., De La Torre Castro, E., Mayer, J., and Voigt, C.: DLR in situ cloud measurements during HALO-(AC)3 Arctic airborne campaign, PANGAEA [data set], https://doi.org/10.1594/PANGAEA.963247, 2023a. a, b
Moser, M., Voigt, C., Jurkat-Witschas, T., Hahn, V., Mioche, G., Jourdan, O., Dupuy, R., Gourbeyre, C., Schwarzenboeck, A., Lucke, J., Boose, Y., Mech, M., Borrmann, S., Ehrlich, A., Herber, A., Lüpkes, C., and Wendisch, M.: Microphysical and thermodynamic phase analyses of Arctic low-level clouds measured above the sea ice and the open ocean in spring and summer, Atmos. Chem. Phys., 23, 7257–7280, https://doi.org/10.5194/acp-23-7257-2023, 2023b. a, b, c
Mróz, K., Battaglia, A., Kneifel, S., von Terzi, L., Karrer, M., and Ori, D.: Linking rain into ice microphysics across the melting layer in stratiform rain: a closure study, Atmos. Meas. Tech., 14, 511–529, https://doi.org/10.5194/amt-14-511-2021, 2021. a
Mülmenstädt, J., Sourdeval, O., Delanoë, J., and Quaas, J.: Frequency of Occurrence of Rain from Liquid-, Mixed-, and Ice-Phase Clouds Derived from A-Train Satellite Retrievals, Geophys. Res. Lett., 42, 6502–6509, https://doi.org/10.1002/2015GL064604, 2015. a
NASA Worldview: MODIS level-2 cloud product, https://worldview.earthdata.nasa.gov, last access: 23 April 2024. a
Nguyen, C. M., Wolde, M., Battaglia, A., Nichman, L., Bliankinshtein, N., Haimov, S., Bala, K., and Schuettemeyer, D.: Coincident in situ and triple-frequency radar airborne observations in the Arctic, Atmos. Meas. Tech., 15, 775–795, https://doi.org/10.5194/amt-15-775-2022, 2022. a, b, c
Ong, C. R., Koike, M., Hashino, T., and Miura, H.: Responses of Simulated Arctic Mixed-Phase Clouds to Parameterized Ice Particle Shape, J. Atmos. Sci., 81, 125–152, https://doi.org/10.1175/JAS-D-23-0015.1, 2024. a
Petters, M. D. and Wright, T. P.: Revisiting Ice Nucleation from Precipitation Samples, Geophys. Res. Lett., 42, 8758–8766, https://doi.org/10.1002/2015GL065733, 2015. a
Rodgers, C. D.: Inverse Methods for Atmospheric Sounding: Theory and Practice, World Scientific, https://doi.org/10.1142/3171, 2000. a
Ruiz-Donoso, E., Ehrlich, A., Schäfer, M., Jäkel, E., Schemann, V., Crewell, S., Mech, M., Kulla, B. S., Kliesch, L.-L., Neuber, R., and Wendisch, M.: Small-scale structure of thermodynamic phase in Arctic mixed-phase clouds observed by airborne remote sensing during a cold air outbreak and a warm air advection event, Atmos. Chem. Phys., 20, 5487–5511, https://doi.org/10.5194/acp-20-5487-2020, 2020. a
Saw, E.-W., Salazar, J. P. L. C., Collins, L. R., and Shaw, R. A.: Spatial Clustering of Polydisperse Inertial Particles in Turbulence: I. Comparing Simulation with Theory, New J. Phys., 14, 105030, https://doi.org/10.1088/1367-2630/14/10/105030, 2012a. a, b
Saw, E.-W., Shaw, R. A., Salazar, J. P. L. C., and Collins, L. R.: Spatial Clustering of Polydisperse Inertial Particles in Turbulence: II. Comparing Simulation with Experiment, New J. Phys., 14, 105031, https://doi.org/10.1088/1367-2630/14/10/105031, 2012b. a
Schirmacher, I., Kollias, P., Lamer, K., Mech, M., Pfitzenmaier, L., Wendisch, M., and Crewell, S.: Assessing Arctic low-level clouds and precipitation from above – a radar perspective, Atmos. Meas. Tech., 16, 4081–4100, https://doi.org/10.5194/amt-16-4081-2023, 2023. a
Schirmacher, I., Schnitt, S., Klingebiel, M., Maherndl, N., Kirbus, B., Ehrlich, A., Mech, M., and Crewell, S.: Clouds and precipitation in the initial phase of marine cold-air outbreaks as observed by airborne remote sensing, Atmos. Chem. Phys., 24, 12823–12842, https://doi.org/10.5194/acp-24-12823-2024, 2024. a, b, c
Seifert, A., Leinonen, J., Siewert, C., and Kneifel, S.: The Geometry of Rimed Aggregate Snowflakes: A Modeling Study, J. Adv. Model. Earth Sy., 11, 712–731, https://doi.org/10.1029/2018MS001519, 2019. a, b, c, d
Shaw, R. A., Kostinski, A. B., and Larsen, M. L.: Towards Quantifying Droplet Clustering in Clouds, Q. J. Roy. Meteor. Soc., 128, 1043–1057, https://doi.org/10.1256/003590002320373193, 2002. a, b, c
Shupe, M. D. and Intrieri, J. M.: Cloud Radiative Forcing of the Arctic Surface: The Influence of Cloud Properties, Surface Albedo, and Solar Zenith Angle, J. Climate, 17, 616–628, https://doi.org/10.1175/1520-0442(2004)017<0616:CRFOTA>2.0.CO;2, 2004. a
Sorooshian, A., Alexandrov, M. D., Bell, A. D., Bennett, R., Betito, G., Burton, S. P., Buzanowicz, M. E., Cairns, B., Chemyakin, E. V., Chen, G., Choi, Y., Collister, B. L., Cook, A. L., Corral, A. F., Crosbie, E. C., van Diedenhoven, B., DiGangi, J. P., Diskin, G. S., Dmitrovic, S., Edwards, E.-L., Fenn, M. A., Ferrare, R. A., van Gilst, D., Hair, J. W., Harper, D. B., Hilario, M. R. A., Hostetler, C. A., Jester, N., Jones, M., Kirschler, S., Kleb, M. M., Kusterer, J. M., Leavor, S., Lee, J. W., Liu, H., McCauley, K., Moore, R. H., Nied, J., Notari, A., Nowak, J. B., Painemal, D., Phillips, K. E., Robinson, C. E., Scarino, A. J., Schlosser, J. S., Seaman, S. T., Seethala, C., Shingler, T. J., Shook, M. A., Sinclair, K. A., Smith Jr., W. L., Spangenberg, D. A., Stamnes, S. A., Thornhill, K. L., Voigt, C., Vömel, H., Wasilewski, A. P., Wang, H., Winstead, E. L., Zeider, K., Zeng, X., Zhang, B., Ziemba, L. D., and Zuidema, P.: Spatially coordinated airborne data and complementary products for aerosol, gas, cloud, and meteorological studies: the NASA ACTIVATE dataset, Earth Syst. Sci. Data, 15, 3419–3472, https://doi.org/10.5194/essd-15-3419-2023, 2023. a
Stachlewska, I. S., Neuber, R., Lampert, A., Ritter, C., and Wehrle, G.: AMALi – the Airborne Mobile Aerosol Lidar for Arctic research, Atmos. Chem. Phys., 10, 2947–2963, https://doi.org/10.5194/acp-10-2947-2010, 2010. a
Sun, Z. and Shine, K. P.: Studies of the Radiative Properties of Ice and Mixed-Phase Clouds, Q. J. Roy. Meteor. Soc., 120, 111–137, https://doi.org/10.1002/qj.49712051508, 1994. a
Toohey, D., Noone, D., and Wein, E.: Water Isotope System for Precipitation and Entrainment Research (WISPER) IMPACTS. Dataset available online from the NASA Global Hydrometeorology Resource Center DAAC, Huntsville, Alabama, U.S.A. [data set], https://doi.org/10.5067/IMPACTS/WISPER/DATA101, 2022. a
Tridon, F., Battaglia, A., Chase, R. J., Turk, F. J., Leinonen, J., Kneifel, S., Mroz, K., Finlon, J., Bansemer, A., Tanelli, S., Heymsfield, A. J., and Nesbitt, S. W.: The Microphysics of Stratiform Precipitation During OLYMPEX: Compatibility Between Triple-Frequency Radar and Airborne In Situ Observations, J. Geophys. Res.-Atmos., 124, 8764–8792, https://doi.org/10.1029/2018JD029858, 2019. a
Tridon, F., Silber, I., Battaglia, A., Kneifel, S., Fridlind, A., Kalogeras, P., and Dhillon, R.: Highly supercooled riming and unusual triple-frequency radar signatures over McMurdo Station, Antarctica, Atmos. Chem. Phys., 22, 12467–12491, https://doi.org/10.5194/acp-22-12467-2022, 2022. a
Turner, D. D.: Arctic Mixed-Phase Cloud Properties from AERI Lidar Observations: Algorithm and Results from SHEBA, J. Appl. Meteorol. Clim., 44, 427–444, https://doi.org/10.1175/JAM2208.1, 2005. a
Waitz, F., Schnaiter, M., Leisner, T., and Järvinen, E.: In situ observation of riming in mixed-phase clouds using the PHIPS probe, Atmos. Chem. Phys., 22, 7087–7103, https://doi.org/10.5194/acp-22-7087-2022, 2022. a
Walbröl, A., Michaelis, J., Becker, S., Dorff, H., Ebell, K., Gorodetskaya, I., Heinold, B., Kirbus, B., Lauer, M., Maherndl, N., Maturilli, M., Mayer, J., Müller, H., Neggers, R. A. J., Paulus, F. M., Röttenbacher, J., Rückert, J. E., Schirmacher, I., Slättberg, N., Ehrlich, A., Wendisch, M., and Crewell, S.: Contrasting extremely warm and long-lasting cold air anomalies in the North Atlantic sector of the Arctic during the HALO-(𝒜𝒞)3 campaign, Atmos. Chem. Phys., 24, 8007–8029, https://doi.org/10.5194/acp-24-8007-2024, 2024. a
Wendisch, M., Crewell, S., Ehrlich, A., Herber, A., Kirbus, B., Lüpkes, C., Mech, M., Abel, S. J., Akansu, E. F., Ament, F., Aubry, C., Becker, S., Borrmann, S., Bozem, H., Brückner, M., Clemen, H.-C., Dahlke, S., Dekoutsidis, G., Delanoë, J., De La Torre Castro, E., Dorff, H., Dupuy, R., Eppers, O., Ewald, F., George, G., Gorodetskaya, I. V., Grawe, S., Groß, S., Hartmann, J., Henning, S., Hirsch, L., Jäkel, E., Joppe, P., Jourdan, O., Jurányi, Z., Karalis, M., Kellermann, M., Klingebiel, M., Lonardi, M., Lucke, J., Luebke, A. E., Maahn, M., Maherndl, N., Maturilli, M., Mayer, B., Mayer, J., Mertes, S., Michaelis, J., Michalkov, M., Mioche, G., Moser, M., Müller, H., Neggers, R., Ori, D., Paul, D., Paulus, F. M., Pilz, C., Pithan, F., Pöhlker, M., Pörtge, V., Ringel, M., Risse, N., Roberts, G. C., Rosenburg, S., Röttenbacher, J., Rückert, J., Schäfer, M., Schaefer, J., Schemann, V., Schirmacher, I., Schmidt, J., Schmidt, S., Schneider, J., Schnitt, S., Schwarz, A., Siebert, H., Sodemann, H., Sperzel, T., Spreen, G., Stevens, B., Stratmann, F., Svensson, G., Tatzelt, C., Tuch, T., Vihma, T., Voigt, C., Volkmer, L., Walbröl, A., Weber, A., Wehner, B., Wetzel, B., Wirth, M., and Zinner, T.: Overview: quasi-Lagrangian observations of Arctic air mass transformations – introduction and initial results of the HALO–𝒜𝒞)3 aircraft campaign, Atmos. Chem. Phys., 24, 8865–8892, https://doi.org/10.5194/acp-24-8865-2024, 2024. a, b, c, d
Wood, A. M., Hwang, W., and Eaton, J. K.: Preferential Concentration of Particles in Homogeneous and Isotropic Turbulence, Int. J. Multiphas. Flow, 31, 1220–1230, https://doi.org/10.1016/j.ijmultiphaseflow.2005.07.001, 2005. a
The IMPACTS (2020) Water Isotope System for Precipitation and Entrainment Research (WISPER, Toohey et al., 2022) data product is available but unreliable under riming and icing conditions, while the HALO-(AC)3 Nevzorov probe data product is only available for April flights.
The number of the perimeter pixel P is computed by using the sum of all pixels eroded when applying a plus-shaped erosion kernel without performing dilation or erosion sequences as was done during HALO-(AC)3.
- Abstract
- Introduction
- Data
- Methods
- Results and discussion
- Conclusions
- Appendix A: Microphysical overview of analyzed segments
- Appendix B: Vertical distribution of Ni and IWC
- Appendix C: LWP riming calculations
- Data availability
- Author contributions
- Competing interests
- Disclaimer
- Special issue statement
- Acknowledgements
- Financial support
- Review statement
- References


