the Creative Commons Attribution 4.0 License.
the Creative Commons Attribution 4.0 License.
Ozone deposition measurements over wheat fields in the North China Plain: variability and related factors of deposition flux and velocity
Xiaoyi Zhang
Wanyun Xu
Weili Lin
Gen Zhang
Jinjian Geng
Li Zhou
Huarong Zhao
Sanxue Ren
Guangsheng Zhou
Jianmin Chen
Ozone (O3) deposition is the main sink of surface O3, exerting great influences on air quality and ecosystems. Due to instrument limitations and method shortages, O3 deposition was less observed and investigated in China, where O3 has been reported to be continuously and significantly rising. Here, we conducted comprehensive measurements of O3 deposition over a wheat canopy at a typical polluted agricultural site in the North China Plain using a newly developed relaxed eddy accumulation system. For the main wheat growing season in 2023, O3 deposition flux and velocity (Vd) averaged −0.25 ± 0.39 and 0.29 ± 0.33 cm s−1, respectively. Daytime Vd (0.40 ± 0.38 cm s−1) was obviously higher than in the nighttime (0.17 ± 0.26 cm s−1). The temporal changes in Vd were mainly determined by crop growth, and Vd significantly increased with decreasing relative humidity and increasing friction velocity and soil water content, enhanced by a higher leaf area index. With rapid increases in soil moisture, simultaneous and following overall increments in Vd were detected, attributed to remarkably strengthening O3 stomatal uptake under increased stomatal conductance and extended opening into the night, and more non-stomatal O3 removal at night resulted from strengthened soil NO emission in moist conditions. This study confirms the leading effects of crop growth on O3 deposition modulated by environmental conditions and the non-negligible influences of nocturnal plant activities, and it emphasizes the need for O3 deposition observation over different surfaces and accurate evaluation of O3 agricultural impacts based on deposition fluxes.
- Article
(9522 KB) - Full-text XML
-
Supplement
(1526 KB) - BibTeX
- EndNote
Surface ozone (O3) is a key secondary air pollutant, generated in photochemical reactions involving volatile organic compounds (VOCs) and nitrogen oxides () (Seinfeld et al., 2006). Over the past 2 decades, China's rapid economic development and increasing anthropogenic emissions of NOx and VOCs have led to significantly upward trends in O3 concentrations (Monks et al., 2015; Li et al., 2019; Lu et al., 2020; Xu et al., 2020), especially in the North China Plain (NCP) (Tai et al., 2014; Ma et al., 2016; Wang et al., 2017, 2022; Lu et al., 2020; Xu, 2021; Lyu et al., 2023). Dry deposition plays one of the key roles in removing surface O3 (e.g., Tang et al., 2017) and contributes about 20 % to the annual global tropospheric O3 loss (Lelieveld and Dentener, 2000; Wild, 2007; Hardacre et al., 2015). Over vegetated areas, stomatal and non-stomatal uptake of O3 may represent a major part of the total dry deposition (Fowler et al., 2001). Plant uptake of large amounts of O3 may cause a series of deleterious oxidative reactions, damaging vegetation and threatening crop quality and production (Ainsworth, 2017; Harmens et al., 2018; Mills et al., 2018; Feng et al., 2019a). In addition, O3 deposition to the ground surfaces (including soil, snow and water) is closely related to tropospheric chemistry, air quality and ecosystems (Clifton et al., 2020b; Stella et al., 2019; Helmig et al., 2012; Stocker et al., 1995). Under the rapid expansion of population and growing demands for food, China has become the world's largest crop producer, as well as importer (Dong et al., 2021). O3 deposition is thus of great importance, and its accurate quantification is urgently needed to evaluate the impact of increasing O3 levels on agricultural production, ecosystems, air quality, human health and global climate.
O3 deposition has been measured over various ecosystems, including forest, grassland, cropland and bare-soil environments (Table S1 in the Supplement), in order to understand deposition mechanisms and evaluate its potential effects (Stella et al., 2019; Xu et al., 2018; Zhu et al., 2015; Helmig et al., 2012; Mészáros et al., 2009; Lamaud et al., 2009; Coyle et al., 2009). However, the deposition processes are controlled by various biotic (stomatal uptake) and abiotic (non-stomatal removal) activities that are simultaneously modulated by environmental factors. The relative contributions of stomatal and non-stomatal O3 deposition varied with land cover, plant species and growth stages, as well as environmental factors. Stomatal uptake of O3 depends on the opening and closure of stomata on leaf surfaces. For example, the fraction of diurnal maximum stomatal O3 deposition over boreal forests ranged from 56 % to 74 % (Rannik et al., 2012) while only accounting for 31.2 % in a wheat field (Xu et al., 2018), with both of them peaking at midday during the most rigorous growth stage of vegetation (Xu et al., 2018; Rannik et al., 2012). Non-stomatal resistance of O3 decreased with the increasing temperature and friction velocity and was ∼50 % lower under wet conditions than under dry conditions over the same potato canopy (Coyle et al., 2009). Thus, O3 deposition is dominated by distinct deposition processes over different surfaces in different environments.
Currently, the eddy covariance (EC) method and flux-gradient (FG) approach are the most commonly used micrometeorological techniques for measuring O3 vertical fluxes (Businger and Oncley, 1990; Altimir et al., 2006; Wu et al., 2015; Clifton et al., 2020a). However, EC requires robust fast-response measurement instruments (≥10 Hz) (Hicks and Wesely, 1978; Muller et al., 2009), while the assumption of the FG approach is dependent on surface roughness and the photochemical reactions of O3 and its precursors (Raupach and Thom, 1981; Vilà-Guerau De Arellano and Duynkerke, 1992). These relatively high requirements have more or less limited the application of traditional micrometeorological methods to measurements of O3 flux. The relaxed eddy accumulation (REA) method is another important micrometeorological method for observing the air–surface exchange of substances of interest over ecosystems (Desjardins, 1977; Businger and Oncley, 1990). REA overcomes the need for fast-response gas sensors and is based on the same physical principle as EC without introducing other uncertainties (Pattey et al., 1993). REA relies on the conditional sampling of air at a constant flow rate according to the instantaneous vertical velocity, which requires high-response sampling valves (∼10 Hz). The air samples associated with updrafts and downdrafts are accumulated into two separate reservoirs and accurately measured with slow-response gas analyzers (Businger and Oncley, 1990). In addition, REA sampling systems are low-cost; easily portable; and simple to operate at remote locations such as forests, croplands and grassland surfaces (Sarkar et al., 2020). Thus, REA methods have been widely applied in flux measurements of various species, such as biogenic VOCs (Mochizuki et al., 2014), reduced sulfur gases (Xu et al., 2002), HONO (Ren et al., 2011) and aerosols (Matsuda et al., 2015; Xu et al., 2021) above forest canopies; peroxyacetyl nitrate at a grassland site (Moravek et al., 2014); NH3 above fertilized corn (Nelson et al., 2017); and Hg at an urban site and over a boreal peatland (Osterwalder et al., 2016). To the best of our knowledge, the REA method has not been applied to O3 deposition flux measurements so far.
Although many regions in China have been experiencing severe O3 pollution during growing seasons, measurements of O3 flux over crop fields in the country have only been sporadically reported and were made using either chamber techniques (e.g., Tong et al., 2015) or micrometeorological approaches (Zhu et al., 2014, 2015; Xu et al., 2018). In this study, we developed a new REA flux system and applied it to obtain O3 deposition fluxes over wheat fields in the NCP during the springtime growing season. Based on these in situ observations, we evaluated the feasibility of O3 flux measurements using the REA method, analyzed the variation characteristics of O3 deposition during the wheat growing season, and identified the key drivers in the variability in daytime and nighttime O3 deposition during distinct crop growth stages and under different environmental conditions.
2.1 Site description
The flux observations were conducted at the Gucheng site (39°08′ N, 115°40′ E; GC), an integrated ecological–meteorological observation and research station of the Chinese Academy of Meteorological Sciences, located 35 km to the northeast of the city of Baoding, Hebei Province, and 100 km southwest of urban Beijing. The site is mainly surrounded by irrigated high-yield agricultural lands with small villages and a highway connecting Beijing and Shijiazhuang 7 km to the west of the site (Fig. S1 in the Supplement). The fields within and surrounding the yard of GC are on a winter wheat–summer maize rotation, which is typical in northern China. Observations at the site have revealed good regional representativeness of the agricultural areas in the NCP that are heavily impacted by the severe regional air pollution (Lin et al., 2009; Xu et al., 2019; Kuang et al., 2020; Zhang et al., 2022a, b).
2.2 Relaxed eddy accumulation (REA) technique
2.2.1 Theory
A self-assembled relaxed eddy accumulation system for O3 dry deposition measurements (REA-O3 flux system) was deployed at GC. In the REA-O3 flux system, conditional sampling is conducted according to the direction of vertical wind (w), which separates sampled air into updraft and downdraft reservoirs at a constant flow rate (Desjardins, 1977; Businger and Oncley, 1990). The vertical fluxes of O3 (, in ) are calculated by the concentration differences between two reservoirs following Eq. (1):
where σw is the standard deviation of vertical wind (in m s−1); and are the averaged O3 concentrations in the updraft and downdraft reservoirs, respectively (in µg m−3); and b is the eddy accumulation coefficient. The latter is obtained from CO2 flux measured using the EC method and is calculated using Eq. (2):
where and are averaged CO2 concentration observed under upward and downward vertical winds, respectively (in mg m−3), and represents the EC CO2 flux (in ). Based on the measurements from February to June 2023, b revealed an average ± standard deviation of 0.55 ± 0.09, ranging from 0.16 to 0.80.
O3 deposition velocity (Vd, cm s−1) is estimated based on O3 flux and concentrations using Eq. (3):
where is the 30 min averaged O3 concentration (in µg m−3).
2.2.2 System setup and verification
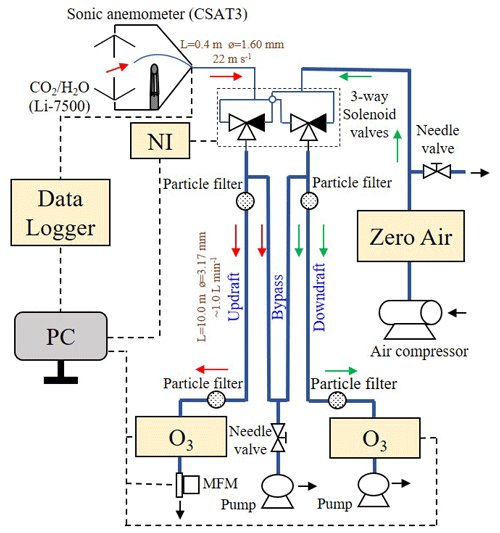
The setup of the REA-O3 flux system is depicted in Fig. 1. A 3-D sonic anemometer (CSAT3, Campbell Scientific, Inc., USA) was used for measuring the three wind components (u, v, w) at 10 Hz, which was mounted at the height of 4.5 m on an eddy covariance tower, located in the middle of a cropland. The height of the flux tower was designed according to the result of the fetch and footprint analysis. The range of the flux source region was about 400 m, which is covered by the crop field within the GC station. The inlet (0.125 in. o.d. Teflon tubing) of the REA system was installed in the center of the anemometer. The 10 Hz wind signals, together with the signals from the analyzer (LI-7500, LI-COR, Inc., USA), were collected by a data logger (CR1000, Campbell Scientific, Inc., USA) and sent to a PC. The wind signals were processed by a program written in Python, which also sent a switch command to two fast-response three-way solenoid valves (LVM105R-5C, SMC Corporation, Japan) according to the vertical wind direction. Based on the direction of instantaneous vertical winds, sample air was drawn alternatively through updraft or downdraft sample tubes (0.25 in. o.d. Teflon) wrapped in aluminum foil and was analyzed by the two UV photometric O3 analyzers (TE 49i, Thermo Fisher Scientific Inc., USA) installed at the ends of updraft and downdraft channels, respectively. Coarse particulate matter was filtered out of air samples using two particle filters (47 mm single-stage filter assembly, Savillex, LLC., USA) before entering the O3 analyzers (Fig. 1). To ensure the stability of airflow in the O3 analyzers and sampling system, zero air was supplied to the channel that was not sampling ambient air. The zero air was generated by an external air compressor (M104, Gast Manufacturing Inc., USA) and a zero-air generator (model 111, Thermo Fisher Scientific Inc., USA), which removes O3, NO, NO2, CO and hydrocarbons from ambient air but not water vapor. In addition, both sampling tubes were bypassed through a piston pump (Thomas 617CD22, Gardner Denver Inc., USA) in order to increase the inlet sample flow and avoid axial mixing in front of the solenoid valves. The linear velocity of the air sample in the inlet tubing was set to 22 m s−1, and airflow was at the turbulent state with a Reynolds number over 2300. The estimated residence time from system inlet to the valves was 18 ms, while the response time of the fast-response sampling valves was less than 10 ms, leading to total time delays from the inlet to individual sampling tubes of below 10 ms; thus the REA system could work at a sample frequency of 10 Hz (100 ms). Total residence time of air samples from the tip of the inlet to the point of O3 detection was about 10 s, which was much shorter that the lifetime of O3 reacting with NO (“Supplementary Method” in the Supplement), suggesting the chemical reaction in the two channels could be neglected. The O3 analyzers recorded 1 min averaged O3 concentrations, which were downloaded by the PC. O3 data were synchronized with wind data as well as sample time according to the PC time. The actual averaged O3 concentrations under updraft and downdraft conditions were calculated according to Eq. (4) using the sample time, sample flow and 1 min averaged O3 concentrations:
where ci is the 1 min averaged O3 concentration (in µg m−3), flowi is the 1 min averaged sample flow (in slpm) measured by the mass flow meter (MFM) and tsample gas,i is the real time for analyzing air sample within the ith minute (in fractions of a minute). The O3 concentration was calculated by averaging O3 concentrations under updraft and downdraft conditions using Eq. (5).
To increase the concentration difference between updraft and downdraft, a wind speed threshold called the wind dead band (w0) was used in the REA system to discard air samples associated with w close to 0. The application of w0 promotes the sampling of larger eddies that contribute more to gas fluxes. If a proper w0 is used, the eddy frequency spectrum shifts to the low frequencies in the sample but does not cut off all the high-frequency signals, only filtering out samples with small vertical displacements that have relatively small impacts on the overall flux (Bowling et al., 1999; Held et al., 2008; Tsai et al., 2012; Moravek et al., 2014; Grelle and Keck, 2021). Conditional sampling using w0 also prolongs the lifetime of the fast-response solenoid valves (Pattey et al., 1993) and effectively avoids sampling error around w=0 due to the limitation of the sonic anemometer (Grelle and Keck, 2021). In the REA-O3 system, we adopted fixed wind dead bands during the daytime (from 08:00 to 18:00 local time (LT, GMT + 8); w0=0.05 m s−1) and nighttime (from 19:00 to 07:00 LT; w0=0.01 m s−1), considering that wind speeds during the daytime were generally larger than those at night. The concentration difference increased with w0 and led to an increase in measured fluxes. Using raw EC data, the REA CO2, H2O and heat fluxes were calculated using w0 in this study (0.05 m s−1 for daytime and 0.01 m s−1 for nighttime) and w0=0, respectively, with a constant b of 0.60 (Businger and Oncley, 1990). As shown in Fig. S2 in the Supplement, the two flux datasets revealed excellent correlations during the whole observation period, with a correlation coefficient close to 1, confirming the reliability and stability of the REA flux measurement system. Compared with the fluxes without w0, CO2, H2O and heat fluxes with w0 exhibited similar small overestimations, reaching around 10 %–13 % during the daytime and 4 %–10 % at night, which were comparable with the influence of a dynamic dead band () in Grelle and Keck's (2021) REA system for H2O, CO2, CH4 and N2O flux measurements. This indicates that adopting the wind dead band in our REA system only had a marginal impact on observed fluxes.
To identify potential flux errors induced by any differences between updraft and downdraft channels in the REA-O3 system (including valves, sample tubes and O3 analyzers), the parallelism of the two sampling channels was checked through simultaneous direct sampling of ambient O3 from the REA system inlet during 10–11 May. As shown in Fig. S3 in the Supplement, O3 data points obtained from the two channels all aligned close to the 1:1 line (slope=1.02, p<0.01), suggesting that the difference in measured O3 was minimal between updraft and downdraft reservoirs and that its impact on flux measurement could be ignored. Moreover, synchronous multipoint calibrations of the two channels were conducted monthly. Different O3 concentrations generated by an O3 calibrator (TE 49C PS, Thermo Fisher Scientific Inc., USA) were introduced into the system from the zero-air inlet and simultaneously measured by the two O3 analyzers. Figure S4 in the Supplement presents the results of multipoint calibration, with determination coefficients (R2) reaching 1.000, indicating high stability of the two channels and O3 instruments. O3 concentrations in the two channels were adjusted based on the results of parallel experiments and standard calibrations.
To further verify the reliability of the REA system, the flux data derived from the REA technique were compared with those based on the EC theory. For CO2, H2O and heat, the averaged ratios of REA to EC fluxes were all slightly larger than 1, indicating small overestimates in the REA flux measurement system, which were expected due to the use of w0. Most of the flux data maintained high consistency, with correlation coefficients close to 1 (Fig. S5 in the Supplement), confirming that the REA system performed reliably under most conditions.
2.3 Field measurements and ancillary data
Measurements of O3 flux were conducted during the main wheat growing season in 2023, from the late dormancy stage (13 February 2023) to wheat harvest (18 June 2023). According to the winter wheat phenology at GC (Table S1), its entire growth season could be divided into three stages: the over-wintering (O-W, 13 February–5 March), green-flowering (G-F, 6 March–28 May) and ripening-harvest (R-H, 29 May–18 June) stages. The wheat height increased from 6.0 cm during the O-W stage to 61.2 cm at the R-H stage. Ancillary data were obtained for further analysis, including meteorology data, soil parameters, plant growth indicators and O3-related trace gas measurement data. Meteorological variables including air temperature (TAir), relative humidity (RH), precipitation, soil temperature (TSoil) and volumetric water content (soil VWC) at 20 cm, global solar radiation (G), photosynthetic active radiation (PAR), and the sun elevation angle were measured by an automatic weather station at GC. The 30 min CO2, H2O, heat and momentum fluxes were measured by the EC system, which includes a 3-D sonic anemometer, an open-path analyzer and a data logger. The friction velocity (u∗) was calculated using the three wind components (u, v, w) following Eq. (6), and the vapor pressure deficit (VPD) was estimated as in Eq. (7).
The leaf area index (LAI) and the fraction of photosynthetically active radiation (FPAR) were obtained from the Moderate Resolution Imaging Spectroradiometer (MODIS) Level 4 product (MCD15A3H) with a spatial resolution of 500 m and temporal resolution of 4 d (Myneni et al., 2015).
NOx () concentrations were monitored from 18 March to 2 June by a trace level analyzer (model 42C-TL, Thermo Fisher Scientific Inc., USA). The analyzer is installed in an air-conditioned container on the northern edge of the cropland, which is located 200 m north of the eddy covariance tower. The air inlet is 1.8 m above the roof of the container and ∼4.5 m above ground level, with an estimated residence time of less than 3 s. Multipoint calibrations of NOx were made using a NO standard gas obtained from National Institute of Metrology, Beijing, China. A total set of 3631 data points of 30 min averaged NOx were obtained, as shown in Fig. S6 in the Supplement. During the measurement period, NO concentration ranged from 0.1 to 23.3 ppb with an average of 0.8 ± 1.8 ppb, while NO2 ranged from 0.5 to 6.6 ppb with an overall average of 2.3 ± 0.9 ppb.
2.4 Stepwise multiple linear regression (MLR) model
Stepwise multiple linear regression (MLR) models were applied to identify the key environmental factors influencing O3 deposition in the daytime (sun elevation angle >0°) and at nighttime (sun elevation angle <0°), respectively. MLR is a commonly used approach to describe the relationship between air pollution and its influencing factors (Zhang et al., 2022b; Han et al., 2020; Fu and Tai, 2015; Rannik et al., 2012). The stepwise MLR model takes the following form:
where y is the observed Vd, xk is the selected normalized environmental parameter, β0 is the regression constant, βk is the regression coefficient and n is the number of selected terms. βk is determined by a forward stepwise method to add and delete terms to obtain the best model fit based on Akaike information criterion (AIC) statistics (Venables and Ripley, 2003). The Z-score normalization method was adopted according to the following equation:
where xobserved, xmean and xstandard deviation are the observed parameters, its overall average and its standard deviation, respectively. Environmental parameters including seven meteorological and soil factors (TAir, RH, VPD, u∗, TSoil, soil VWC, PAR) and two crop-related factors (LAI, FPAR) were considered during the daytime, while PAR was unaccounted for during the nighttime. The selected variables in the stepwise MLR were considered to be the environmental factors critical for O3 deposition at GC during the wheat growing season.
3.1 Meteorological conditions
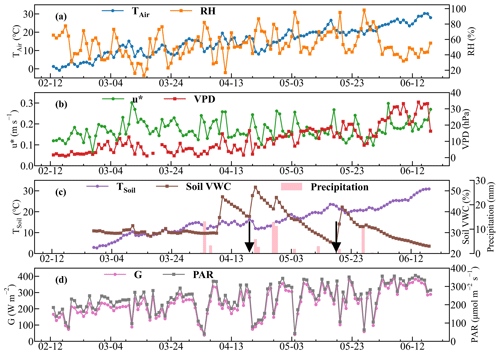
Figure 2 shows the temporal variations in daily meteorological and soil conditions during the whole period. Air and soil temperatures gradually increased from the lowest values (TAir: −0.8 °C; TSoil: 2.9 °C) in February to the highest ones (TAir: 30.2 °C; TSoil: 30.9 °C) in June. RH varied around a higher level before the latter part of April and at a lower level after that, with an average of 64 % ± 17 %. Calculated u∗ fluctuated in the range of 0.05–0.30 m s−1, with an average of 0.17 ± 0.04 m s−1. Daily VPD was relatively stable during February–early April, with an average of 5.9 ± 4.0 hPa, and rose obviously afterwards, reaching an averaged value of 19.9 ± 7.4 hPa during May to June. During the wheat growth stage, the cropland experienced two irrigation events, occurring on 19–21 April and 18–22 May, respectively (Fig. 2c). The irrigation system mainly consists of an irrigation pump with an outlet flow of 50 m3 h−1 and a total of 20 sprinklers. The total irrigation water volume was approximately 3600 m3 for 3333 m2 cropland, and the duration was 3 d. Soil VWC stayed flat before the middle of April and showed dramatic boosts caused by strong precipitation or irrigation events during 9–10, 20–21 and 28–29 April and 19–20 May (Fig. 2c), followed by slow declines due to evapotranspiration under higher temperatures. Both PAR and G exhibited great fluctuations with slight increases from February to June.
3.2 O3 flux, deposition and concentration
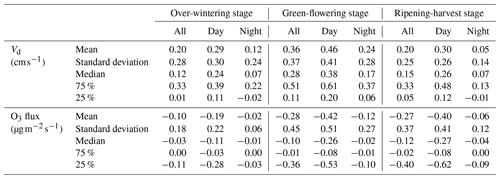
In total, 2728 pairs of O3 deposition flux and velocity were obtained for the wheat growing season, which are presented in Fig. 3, along with 30 min and daily average O3 concentrations. O3 deposition flux averaged −0.25 ± 0.39 , with larger deposition during the daytime (−0.39 ± 0.45 ) and smaller deposition during the nighttime (−0.08 ± 0.21 ). The largest negative (−3.20 ) and positive (0.14 ) fluxes were measured around noontime on 29 April and around midnight on 15 March, respectively. Daytime Vd averaged 0.40 ± 0.38 cm s−1 and was distinctly higher than nighttime Vd values (0.17 ± 0.26 cm s−1). The averages of daytime and nighttime Vd obtained in this study were comparable to those from previous EC-based observations (0.42 and 0.14 cm s−1) during the wheat growing season and higher than those (0.29 and 0.09 cm s−1) during the maize growing season (Table S2 in the Supplement) in Shandong Province, China (Zhu et al., 2015, 2014). Vd averaged 0.29 ± 0.33 cm s−1 over the whole observation period, ranging from −0.39 to 2.65 cm s−1. The average O3 deposition velocities observed over the wheat canopy did not show substantial differences from those previously reported for grasslands (Mészáros et al., 2009; Coyle, 2006), forests (Wu et al., 2015; Rannik et al., 2012) and bare soil (Stella et al., 2019) (Table S2). O3 concentrations over the wheat canopy were significantly enhanced after April, with an overall average of 61.8 ± 34.6 µg m−3. In general, O3 deposition velocities were more pronounced from mid-April to late May (Fig. 3b), when wheat was growing vigorously, while deposition fluxes were higher after late May due to overall higher O3 concentration (Fig. 3a and c). Thus, O3 concentration was more determinative of O3 deposition flux than Vd on longer timescales.
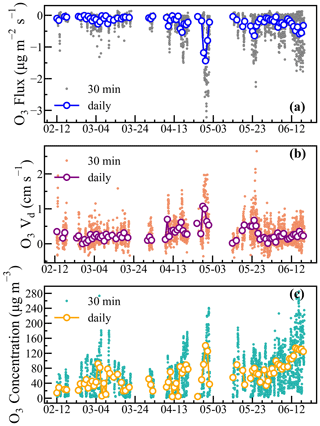
Figure 3Time series of O3 deposition flux (a), Vd (b) and concentration (c) during the wheat growing season.
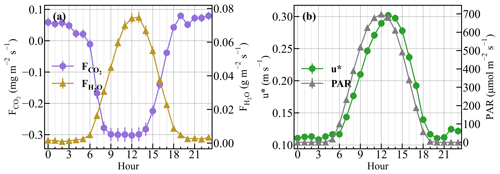
The averaged diurnal patterns of O3 deposition flux, velocity and O3 concentration are depicted in Fig. 4. With solar radiation and atmospheric turbulence increasing after sunrise, plant stomatal conductance increased along with H2O and CO2 fluxes over the cropland, reaching peaks at noon (Fig. 5). O3 deposition rapidly rose during the morning (06:00–10:00 LT). Deposition flux and velocity both reached their peaks (−0.62 and 0.54 cm s−1) by 13:00 LT, when stomatal conductance and gas–leaf exchange also reached the diurnal maximums (Rannik et al., 2012; Otu-Larbi et al., 2021). O3 deposition quickly decreased from 14:00 to 18:00 LT despite high levels of O3 (Fig. 4). At night, atmospheric turbulence weakened and leaf stomata closed, resulting in reduced H2O and CO2 fluxes remaining steady throughout the night (Fig. 5). Nighttime O3 deposition remained at relatively low levels and exhibited weak changes, with an averaged flux and Vd of −0.09 ± 0.04 and 0.17 ± 0.02 cm s−1, respectively. Therefore, diel variations in O3 deposition over the wheat fields were mainly driven by stomatal opening and closing, with O3 deposition velocity being decisive in deposition flux diurnal variations.
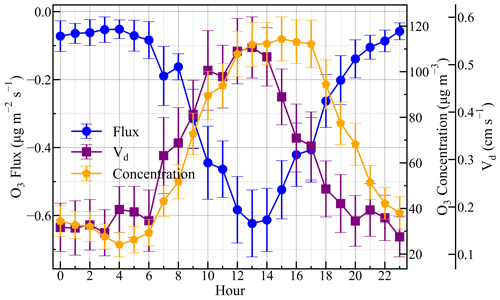
Figure 4Diurnal variations in the O3 deposition flux, Vd and concentration during the wheat growing season, with error bars representing average ± 0.2 × standard deviation values.
3.3 O3 deposition in different stages of wheat growth
To investigate the influences of wheat growth on O3 deposition, the characteristics of O3 deposition were further examined in connection to the different growth stages. During the O-W stage, wheat was in dormancy and leaves had not begun to turn green (LAI<0.5, Fig. 6b), with CO2 flux in the agricultural ecosystem close to zero (Fig. 6c). Vd in the O-W stage barely changed, exhibiting a low average value of 0.20 ± 0.28 cm s−1 and a median of 0.12 cm s−1 (Table 1). Wheat grew vigorously in the G-F stage, with LAI and CO2 assimilation flux exhibiting rapid increases until the early and late flowering stages, respectively, after which both of them gradually decreased (Fig. 6b and c). O3 deposition varied nearly in synchronization with LAI and wheat growth, with Vd reaching a peak when cropland CO2 assimilation was the highest during the G-F stage (Fig. 6a), reaching highest daytime and nighttime averages of 0.46 ± 0.41 cm s−1 and 0.24 ± 0.28 cm s−1, respectively (Table 1). Afterwards, with the maturing of wheat and the aging of leaves in the R-H stage, Vd quickly dropped back to a low average level of 0.20 ± 0.25 cm s−1, which is similar to that observed in the O-W stage. It can be seen that the temporal variation in O3 deposition velocity over wheat fields was predominantly determined by crop growth at GC. As for the deposition flux, both the daily and the daytime average fluxes during the G-F stage were comparable with those in the R-H stage (Table 1), which can be attributed to the high O3 concentrations in the summer months (Zhang et al., 2022a; Lin et al., 2009). Although nighttime O3 concentration during the G-F stage was also 58 % lower than that in the R-H stage, nighttime O3 deposition flux during the G-F stage was still the highest among the three stages, which was related to the remarkably high nighttime deposition velocities during the G-F stage (Table 1).
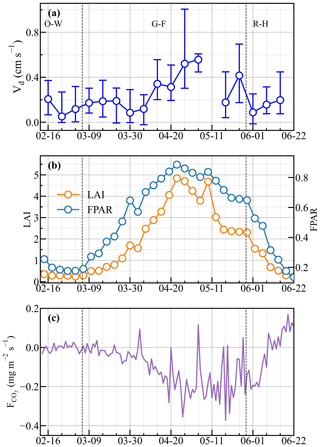
Figure 6(a) O3 Vd, (b) LAI and FPAR, and (c) CO2 flux () in different wheat growing stages. The circles and error bars in (a) denote the weekly medians and quantiles of Vd, respectively. O-W, G-F and R-H represent the over-wintering, green-flowering and ripening-harvest stages, respectively.
3.4 O3 deposition relation to environmental factors
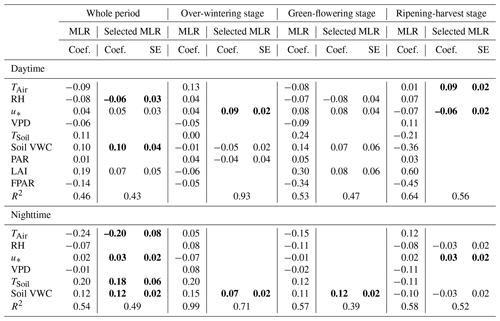
To gain deeper insights into the responses of O3 deposition (including stomatal and non-stomatal) to environmental factors in agricultural areas, stepwise MLR models were conducted to see which factors potentially played more important roles in O3 deposition at GC during the daytime and nighttime, respectively. As shown in Table 2, RH, u∗, soil VWC and LAI were identified as significant environmental factors in explaining daytime O3 deposition changes during the entire observation period. Additionally, the coefficient of determination (R2) of the linear model between all environmental factors and Vd was 0.46, implying that these meteorological and plant-growth-related factors could explain approximately 46 % of the variance of daytime O3 deposition, while R2 was only slightly lower (0.43) with the four selected factors. Distinct key environmental factors for O3 deposition were identified for different wheat growth stages, while LAI was only among the most important factors during the G-F stage (Table 2), confirming the significant effect of crops on O3 deposition during its most vigorous growing stage. During the O-W stage, wheat played a minor role in O3 deposition as LAI<0.5. Solar radiation (PAR) and wind (u∗) supplied energy for atmospheric turbulence, which transported O3 to the soil surface, while soil moisture (soil VWC) largely affected the diffusion and absorption of O3 in soil (Stella et al., 2011a). Therefore, O3 deposition was more sensitive to u∗, soil VWC and PAR during the O-W stage. In the R-H stage, the land surface was covered by ripe wheat, which reduced LAI and stomatal conductance. O3 deposition was therefore mainly dependent on turbulent transport, which was more affected by TAir and u∗ under sufficient solar radiation (Fig. 2d). During the nighttime, O3 deposition mainly commenced through non-stomatal pathways such as cuticular and soil deposition (Xu et al., 2018), which are affected by turbulence strength and surface conditions. The most significant influencing factors for O3 deposition were TAir, u∗, TSoil and soil VWC for the whole observation period (Table 2). However, temperatures (TAir and TSoil) were not selected as the key factors when the stepwise MLR was separately performed for the three growth stages. Compared with the R2 of the daytime MLR model, meteorological and soil conditions could explain more variance of the nighttime O3 deposition (54 %), implying that nighttime O3 deposition processes were less complicated than daytime ones.
Table 2Results of the MLR models for the O-W, G-F and R-H stages. Daytime MLR models represent multiple linear regression between daily average environmental variables and daytime O3 Vd, while nighttime models represent nighttime environmental variables and Vd. The selected MLR models refer to the stepwise MLR model based on AIC statistics. Bold numbers denote those with p value<0.05.
Further, we explored how the selected key factors controlled the temporal variability in Vd during the three wheat growth stages (Figs. 7–9). In general, the responses of both daytime and nighttime Vd to the meteorological factors were consistent throughout the entire wheat growth season (Figs. 7 and 9).
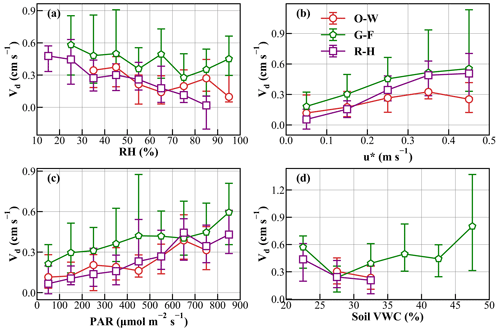
Figure 7Dependencies of daytime O3 Vd on (a) RH, (b) u∗, (c) PAR and (d) soil VWC during the O-W, G-F and R-H stages. Medians of 30 min Vd with quartiles are presented.
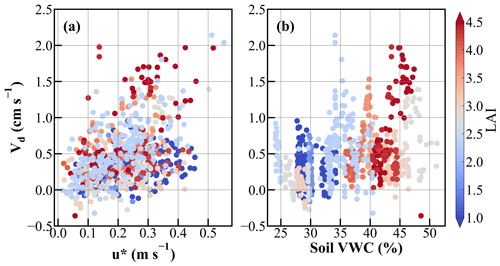
Figure 8The variation in daytime Vd with (a) u∗ and (b) soil VWC under changing LAI during the G-F stage.
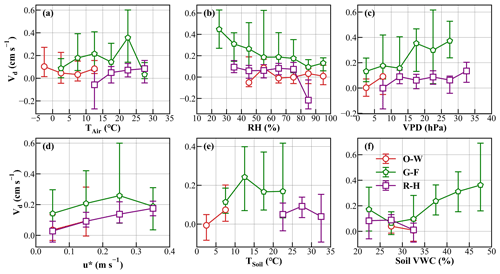
Figure 9Dependencies of O3 Vd on (a) TAir, (b) RH, (c) VPD, (d) u∗, (e) TSoil and (f) soil VWC in the nighttime during the O-W, G-F and R-H stages. Medians of 30 min Vd with quartiles are presented.
Ambient RH influences the relative contributions of stomatal and non-stomatal processes to O3 deposition. A clear negative variation in Vd with increasing RH was observed at GC for both daytime and nighttime (Figs. 7a and 9b). Due to the negative correlation of VPD to RH (Eq. 7), high VPD was conducive to high nighttime Vd (Fig. 9c). During the daytime, this negative relationship was detected for all growth stages, while during the nighttime the decrease with RH was most evident during the G-F stage. At RH above 60 %–70 %, leaf surfaces are frequently covered by a thin liquid film or by dew water, which would inhibit stomatal dry deposition but enhance aqueous reactions of O3, leading to an enhanced relative contribution of non-stomatal deposition, albeit with high variability (Coyle et al., 2009; Lamaud et al., 2009). Under RH below 60 %, stomatal conductance contributes more to O3 deposition, which might also be negatively dependent on RH. For instance, similar negative correlations of Vd and RH were observed over wheat and maize canopies in the NCP (Zhu et al., 2014, 2015), while O3 deposition to a boreal forest revealed strong positive correlation with RH (Rannik et al., 2012), which was attributed to differences in plant varieties and the growth environment. The response of stomata to the changes in humidity is largely dependent on plant cultivars and plant water stress (Camacho et al., 1974; Rawson et al., 1977; Fanourakis et al., 2020). For example, the stomata of a drought-tolerant wheat cultivar closed rapidly with reduced humidity, whereas high-yield-cultivar stomatal conductance increased against decreasing humidity (Kudoyarova et al., 2007). The growth environment affects the aerodynamic roughness of the earth surfaces. Increased roughness could induce stronger turbulent transfer under low-humidity conditions, transporting gases more effectively to the leaf surfaces, thereby promoting O3 deposition (Liao et al., 2022).
Strong turbulence (represented by elevated u∗) can transport O3 more efficiently to the surface (Cape et al., 2009); thus Vd almost linearly increased with u∗ (Figs. 7b and 9d). The sensitivity of Vd to u∗ was also affected by LAI, with daytime Vd under similar levels of u∗ being significantly higher under higher LAI (Fig. 8a and Table S3 in the Supplement). High LAI indicates dense vegetation coverage and potential large stomatal conductance, which can provide more active (stomatal and cuticular) areas for the uptake of O3, further promoting O3 deposition. PAR had a positive effect on O3 deposition during the observation period (Fig. 7c). On the one hand, increasing PAR induces automatic leaf stomatal opening, thereby determining stomatal conductance and net photosynthesis (Yu et al., 2004) and affecting the stomatal O3 uptake (Tong et al., 2015). On the other hand, PAR (also reflecting radiation intensity) affects O3 photochemistry directly by accelerating atmospheric photolysis reactions both above and within the canopy and indirectly by influencing the emission of biogenic VOCs (Yang et al., 2021; van Meeningen et al., 2017; Yuan et al., 2016), thus disturbing the distributions of O3 and its precursors and contributing to non-stomatal O3 fluxes through surface processes (Fares et al., 2008; Cape et al., 2009). Positive dependencies of Vd on u∗ and PAR were observed over other crop fields (such as wheat, maize and potato) (Coyle et al., 2009; Zhu et al., 2014, 2015). In addition, both TAir and TSoil exhibited weak relationships with nighttime Vd (Fig. 9a and e), which were different from the reported positive correlations between temperature and Vd (Coyle et al., 2009; Rannik et al., 2012). These imply the variability and complexity of O3 deposition affected by the combined influences of various environmental factors.
During the O-W and R-H stages, soil VWC was at relatively low levels. During the G-F stage, soil VWC reached beyond 0.30 % and Vd rose significantly with rising soil VWC (Figs. 7d and 9f). Although soil moisture blocks the diffusion of O3 in soil and reduces reactive spaces for O3 absorption, suppressing O3 soil deposition (Stella et al., 2011b), it can also promote total O3 deposition through several indirect pathways. From the plant physiological aspect, stomatal conductance and plant net photosynthesis are both promoted by higher soil VWC (Otu-Larbi et al., 2021; Anav et al., 2018; Medlyn et al., 2011; Jarvis et al., 1997; Ball et al., 1987). Stomatal conductance revealed overshoots after the watering of dry soil; accordingly, significantly increased transpiration and photosynthesis of crops or vegetation were detected (Wu et al., 2021; Reich et al., 2018; Ramírez et al., 2018; Rawson and Clarke, 1988; Popescu, 1967). This effect was reflected at GC by the more obvious response of Vd to soil VWC changes under higher LAI (Fig. 8b and Table S3), confirming again that O3 deposition during the G-F stage was mainly driven by stomatal deposition rather than soil deposition. Consequently, soil VWC revealed positive coefficients in the MLR models for the G-F period at GC. Our result is qualitatively consistent with the observation-based estimation of stomatal and soil O3 deposition relative contributions over a wheat canopy in the city of Nanjing, China, which accounted for 41.2 % and 15.4 %, respectively (Xu et al., 2018).
Overall, soil VWC at GC stayed low except for four abruptly increasing events that occurred during the G-F stage, with the highest soil VWC reaching 0.55 % (Fig. 2c). The three most prominent episodes induced by farm field irrigation were more thoroughly investigated to uncover how soil moisture affected O3 deposition at GC. Interestingly, simultaneous increments in Vd were detected upon the increase in soil VWC, with Vd being distinctly elevated within days afterwards (Fig. 10). Soil VWC increased from 0.32 % to 0.51 % at noontime on 9 April, and Vd rapidly rose from 0.16 to 0.64 cm s−1 at the same time. Dramatic increments in both averaged nighttime and averaged daytime Vd were detected on the following days. During the nighttime, Vd reached an average of 0.30 cm s−1, significantly higher than the average daytime level (0.18 cm s−1) on 9 April, and a maximum of 0.76 cm s−1, which also exceeded the maximum of 0.64 cm s−1 observed during the daytime on 9 April (Fig. 10a). The dramatic rise in Vd on 10 April resulted in a 317 % increase in daytime O3 deposition flux (from 0.12 to 0.50 ), with only a small change in daytime O3 concentration from 9 April (41.4 µg m−3) to 10 April (48.2 µg m−3, Fig. S7a in the Supplement). In addition, drastic elevations in Vd during the night and morning periods were also observed following other episodes of sudden increases in soil VWC (Fig. 10b and c). Similar enhancements and disrupted daily cycles of O3 deposition were also observed over the canopy of a pine forest during rainfall events (Altimir et al., 2006).
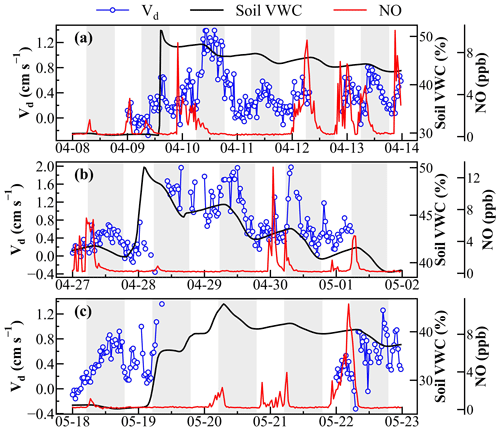
Figure 10Variations in O3 Vd (blue lines with circles), soil VWC (black lines) and NO concentration (red lines) during (a) 8–13 April, (b) 27 April–1 May and (c) 18–22 May. The shading represents the daytime.
Considering the direct effect of soil moisture on plant physiology, the temporal variations in CO2 and H2O fluxes were examined to characterize changes in the transpiration and photosynthesis of wheat affected by the abrupt increases in soil water contents. As shown in Fig. 11, both CO2 and H2O fluxes exhibited obvious increases on the days following the soil VWC increments. The daily peaks of H2O fluxes increased from 0.08 to 0.13 between 9 and 10 April and from 0.12 to 0.19 between 28 and 29 April, while daily averaged CO2 fluxes before and after the abruptly increasing events rose from 0.28 to 0.55 and from 0.51 to 0.55 , respectively (Fig. 11a and b). Subsequently, CO2 and H2O fluxes, as well as Vd of O3, exhibited declines with the slow loss in soil moisture (Figs. 10 and 11). This indicates that the transpiration and photosynthesis of wheat were sharply enhanced after soil water contents increased, leading to larger leaf stomatal conductance and strengthening O3 stomatal uptake. These results were consistent with those obtained in previous conditional control experiments and field observations (Wu et al., 2021; Reich et al., 2018; Ramírez et al., 2018; Rawson and Clarke, 1988; Popescu, 1967). In addition, moist soil can extend the time window of wheat leaves' stomatal opening, both in the hours after sunset and in the hours before dawn (Schoppach et al., 2020; Ramírez et al., 2018). Stomata can even stay open during the nighttime after precipitation or irrigation events (Kobayashi et al., 2007; Rawson and Clarke, 1988). During the irrigation-induced high-soil-VWC episodes, positive H2O fluxes were also observed at GC during the night, such as on 10 April and 28 April (Fig. 11a and b), implying that wheat transpiration might not stop over the course of the night and that leaf stomata might have not completely closed, continuing to take up O3 at night and significantly enhancing nocturnal O3 deposition.
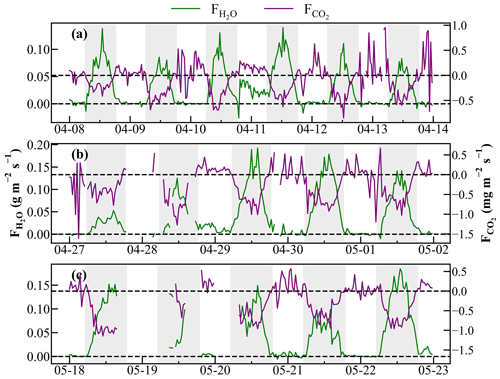
Figure 11Variations in H2O flux (, green lines) and CO2 flux (, purple lines) during (a) 8–13 April, (b) 27 April–1 May and (c) 18–22 May, with shading representing daytime hours.
Additionally, the phenomenon of high nighttime O3 deposition (Vd) was always accompanied by positive water vapor fluxes and high NO concentrations and occurred mainly after the rapid increase in soil VWC (Fig. S8 in the Supplement). As shown in Fig. 10, high NO became more frequent at night during the high-soil-VWC events, and nighttime Vd dramatically increased when NOx (NO and NO2) fluctuated at obviously higher levels and nighttime O3 concentration was still at a low level (Fig. S7), indicating more intensive titration consumption of O3 at night. This might be attributable to the fact that soil NO emissions were promoted by the watering process, as soil water content is a decisive factor in the transformation and emission of reactive nitrogen within soils (Schindlbacher et al., 2004; Ghude et al., 2010; Kim et al., 2012; Weber et al., 2015; Zörner et al., 2016). Enhanced nighttime soil NO emissions may inevitably cause stronger NO titration with O3 within wheat canopies, facilitating the non-stomatal O3 deposition at night.
In summary, both daytime and nighttime O3 deposition fluxes and Vd were significantly affected by environmental conditions, through stomatal and non-stomatal pathways, with crop growth playing a critical role. Abrupt increments in soil moisture induced dramatic changes in Vd, which not only altered the diurnal cycle of O3 deposition, but also caused large fluctuations in averaged O3 deposition flux on longer timescales.
In this study, we developed a relaxed eddy accumulation (REA) O3 flux measurement system, verified its reliability and conducted measurements of O3 deposition using this newly developed REA system over the wheat canopy at a polluted agricultural site (GC) in the NCP during the main wheat growth season. Ancillary data related to O3 deposition were used in an integrated analysis of the influencing environmental factors. The observed O3 deposition flux and velocity over the wheat fields at GC reached averages of −0.25 ± 0.39 and 0.29 ± 0.33 cm s−1, respectively. The diurnal cycle of Vd was controlled by the crop stomatal opening and turbulent transport during the day. Vd was obviously higher during the daytime (0.40 ± 0.38 cm s−1) than nighttime (0.17 ± 0.26 cm s−1). Vd played a decisive role in the diel pattern of O3 deposition flux, while O3 concentrations determined the flux variability on longer timescales. The temporal changes in Vd were synchronous with the evolutions of LAI, wheat growth and cropland CO2 flux, suggesting the determining and enhancement effect of crop growth on O3 deposition and the predominant contribution of stomatal uptake over wheat fields during its growth season. However, the relative contributions of stomatal and non-stomatal O3 deposition pathways, which are of crucial importance for studies on O3 removal and vegetation health impacts, need to be further quantified in our future investigations. While the influence of crops on O3 deposition through stomatal uptake or surface removal has been extensively investigated in previous studies (Ainsworth, 2017; Aunan et al., 2000; Bender and Weigel, 2011; Biswas et al., 2008; Epa, 2013; Felzer et al., 2005; Harmens et al., 2018; Piikki et al., 2008), the influence of O3 deposition on crop growth and yield under currently rising O3 levels in the NCP remains an unsolved issue. Many researchers have assessed the crop yield loss induced by O3 pollution based on exposure–response functions (Feng et al., 2019b, 2020; Hu et al., 2020). However, the actual exposure is more related to direct deposition flux measurements rather than concentration-based indicators (Zhu et al., 2015). Therefore, agricultural impacts of O3 should be more accurately quantified in our following studies using stomatal O3 deposition fluxes that might be obtained from current total O3 deposition flux measurements using partitioning methods such as those in Fares et al. (2013).
During the wheat growth season, RH, u∗, soil VWC and LAI were identified as the most significant factors in explaining the changes in O3 deposition during the daytime through stomatal and non-stomatal pathways, while u∗ and soil VWC were more important for nocturnal O3 deposition, which mainly commenced through non-stomatal deposition. Vd significantly increased with the decrease in RH and the increases in u∗, PAR and soil VWC, especially under higher LAI. Rapid increases in soil VWC after strong precipitation or irrigation events extended stomatal opening to nighttime hours, leading to increased stomatal conductance and enhanced transpiration and photosynthesis of wheat, which remarkably strengthened O3 stomatal uptake during the daytime and nighttime. Stomatal opening and transpiration are typically assumed to occur specifically during the daytime. However, an increasing number of studies have shown the non-negligible effects of unclosed nocturnal stomata and transpiration for a wide range of plant species (Kukal and Irmak, 2022; Schoppach et al., 2020; Tamang et al., 2019; Ramírez et al., 2018; Hoshika et al., 2018). Therefore, how nocturnal plant activities might interact with the significantly increasing nighttime O3 levels in China during recent years (Agathokleous et al., 2023; He et al., 2022) is also worth deeper investigation. Aside from influencing stomata opening, drastic changes in soil humidity also strengthened NO soil emissions, facilitating NO titration of O3 within the canopy and enhancing non-stomatal O3 removal at night. Therefore, drastically increasing soil moisture simultaneously led to strong increments in Vd. Under current climate-warming trends, extreme weather events (such as extreme precipitation and drought) have increased in frequency in agricultural areas (Yuan et al., 2016), and their effect on agriculture, NOx emissions, O3 formation and O3 deposition requires future attention.
During the entire wheat growth season, O3 deposition velocity exhibited large fluctuations under changing environmental conditions, with distinct factors determining Vd variability during different wheat growth stages. These key influencing factors and their effects on O3 deposition would also vary with different canopy types and ground surface conditions. Aside from environmental conditions, agricultural activities also significantly affect O3 deposition (Mészáros et al., 2009). Therefore, the actual O3 deposition process bears large uncertainties and varies greatly in space and time. More O3 deposition observations over different types of land surfaces and vegetation are urgently needed to facilitate the exploration of O3 dry deposition mechanisms and to optimize current model parameterizations, whose results largely deviate from observed O3 dry deposition fluxes in crop growth seasons (Clifton et al., 2020a; Hardacre et al., 2015).
The data used in this study are available in the Supplement and can also be made available from the corresponding authors upon request.
The supplement related to this article is available online at: https://doi.org/10.5194/acp-24-12323-2024-supplement.
XZ and WX designed the experiment, and XX led the research. XZ conducted the O3 deposition measurements with the help of WL, WX, GeZ, XX and JC. JG, LZ, SR, HZ and GuZ were responsible for the EC flux measurement. XZ analyzed the data and wrote the paper with the help of WL, WX and XX.
The contact author has declared that none of the authors has any competing interests.
Publisher's note: Copernicus Publications remains neutral with regard to jurisdictional claims made in the text, published maps, institutional affiliations, or any other geographical representation in this paper. While Copernicus Publications makes every effort to include appropriate place names, the final responsibility lies with the authors.
This work is supported by the National Natural Science Foundation of China (grant nos. 42375117 and 42175127), the Beijing Natural Science Foundation (grant no. 8222078), CAMS projects (grant nos. 2024KJ026 and 2023Z012), and the China Meteorological Administration Innovation and Development Project (grant no. CXFZ2024J039).
This work is supported by the National Natural Science Foundation of China (grant nos. 42375117 and 42175127), the Beijing Natural Science Foundation (grant no. 8222078), CAMS projects (grant nos. 2024KJ026 and 2023Z012), and the China Meteorological Administration Innovation and Development Project (grant no. CXFZ2024J039).
This paper was edited by Carl Percival and reviewed by two anonymous referees.
Agathokleous, E., Feng, Z., and Sicard, P.: Surge in nocturnal ozone pollution, Science, 382, 1131–1131, https://doi.org/10.1126/science.adm7628, 2023.
Ainsworth, E. A.: Understanding and improving global crop response to ozone pollution, Plant J., 90, 886–897, https://doi.org/10.1111/tpj.13298, 2017.
Altimir, N., Kolari, P., Tuovinen, J.-P., Vesala, T., Bäck, J., Suni, T., Kulmala, M., and Hari, P.: Foliage surface ozone deposition: a role for surface moisture?, Biogeosciences, 3, 209–228, https://doi.org/10.5194/bg-3-209-2006, 2006.
Anav, A., Proietti, C., Menut, L., Carnicelli, S., De Marco, A., and Paoletti, E.: Sensitivity of stomatal conductance to soil moisture: implications for tropospheric ozone, Atmos. Chem. Phys., 18, 5747–5763, https://doi.org/10.5194/acp-18-5747-2018, 2018.
Aunan, K., Berntsen, T., and Seip, H.: Surface Ozone in China and its Possible Impact on Agricultural Crop Yields, Ambio, 29, 294–301, https://doi.org/10.1639/0044-7447(2000)029[0294:SOICAI]2.0.CO;2, 2000.
Ball, J. T., Woodrow, I. E., and Berry, J. A.: A Model Predicting Stomatal Conductance and its Contribution to the Control of Photosynthesis under Different Environmental Conditions, in: Progress in Photosynthesis Research: Vol. 4, Proceedings of the VIIth International Congress on Photosynthesis, edited by: Biggins, J., Providence, Rhode Island, USA, 10–15 August 1986, Springer Netherlands, Dordrecht, 221–224, https://doi.org/10.1007/978-94-017-0519-6_48, 1987.
Bender, J. and Weigel, H.-J.: Changes in atmospheric chemistry and crop health: A review, Agron. Sustain. Dev., 31, 81, https://doi.org/10.1051/agro/2010013, 2011. .
Biswas, D. K., Xu, H., Li, Y. G., Sun, J. Z., Wang, X. Z., Han, X. G., and Jiang, G. M.: Genotypic differences in leaf biochemical, physiological and growth responses to ozone in 20 winter wheat cultivars released over the past 60 years, Global Change Biol., 14, 46–59, https://doi.org/10.1111/j.1365-2486.2007.01477.x, 2008.
Bowling, D. R., Delany, A. C., Turnipseed, A. A., Baldocchi, D. D., and Monson, R. K.: Modification of the relaxed eddy accumulation technique to maximize measured scalar mixing ratio differences in updrafts and downdrafts, J. Geophys. Res.-Atmos., 104, 9121–9133, https://doi.org/10.1029/1999JD900013, 1999.
Businger, J. A. and Oncley, S. P.: Flux Measurement with Conditional Sampling, J. Atmos. Ocean. Tech., 7, 349–352, https://doi.org/10.1175/1520-0426(1990)007<0349:FMWCS>2.0.CO;2, 1990.
Camacho, B. S., Hall, A. E., and Kaufmann, M. R.: Efficiency and regulation of water transport in some woody and herbaceous species, Plant Physiol., 54, 169–172, https://doi.org/10.1104/pp.54.2.169, 1974.
Cape, J. N., Hamilton, R., and Heal, M. R.: Reactive uptake of ozone at simulated leaf surfaces: Implications for “non-stomatal” ozone flux, Atmos. Environ., 43, 1116–1123, https://doi.org/10.1016/j.atmosenv.2008.11.007, 2009.
Clifton, O. E., Fiore, A. M., Massman, W. J., Baublitz, C. B., Coyle, M., Emberson, L., Fares, S., Farmer, D. K., Gentine, P., Gerosa, G., Guenther, A. B., Helmig, D., Lombardozzi, D. L., Munger, J. W., Patton, E. G., Pusede, S. E., Schwede, D. B., Silva, S. J., Sörgel, M., Steiner, A. L., and Tai, A. P. K.: Dry Deposition of Ozone Over Land: Processes, Measurement, and Modeling, Rev. Geophys., 58, e2019RG000670, https://doi.org/10.1029/2019RG000670, 2020a.
Clifton, O. E., Paulot, F., Fiore, A. M., Horowitz, L. W., Correa, G., Baublitz, C. B., Fares, S., Goded, I., Goldstein, A. H., Gruening, C., Hogg, A. J., Loubet, B., Mammarella, I., Munger, J. W., Neil, L., Stella, P., Uddling, J., Vesala, T., and Weng, E.: Influence of Dynamic Ozone Dry Deposition on Ozone Pollution, J. Geophys. Res.-Atmos., 125, e2020JD032398, https://doi.org/10.1029/2020JD032398, 2020b.
Coyle, M.: The gaseous exchange of ozone at terrestrial surfaces: non-stomatal deposition to grassland, University of Edinburgh, PhD Thesis, https://nora.nerc.ac.uk/id/eprint/4016 (last access: 5 November 2024), 2006.
Coyle, M., Nemitz, E., Storeton-West, R., Fowler, D., and Cape, J. N.: Measurements of ozone deposition to a potato canopy, Agr. Forest Meteorol., 149, 655–666, https://doi.org/10.1016/j.agrformet.2008.10.020, 2009.
Desjardins, R. L.: Description and evaluation of a sensible heat flux detector, Bound.-Lay. Meteorol., 11, 147–154, https://doi.org/10.1007/BF02166801, 1977.
Dong, C., Gao, R., Zhang, X., Li, H., Wang, W., and Xue, L.: Assessment of O3-induced crop yield losses in northern China during 2013–2018 using high-resolution air quality reanalysis data, Atmos. Environ., 259, 118527, https://doi.org/10.1016/j.atmosenv.2021.118527, 2021.
EPA: Integrated Science Assessment (ISA) for Ozone and Related Photochemical Oxidants, Final Report, February 2013, Environmental Protection Agency, Washington, DC, U.S., https://assessments.epa.gov/isa/document/&deid=247492#record_history (last access: 5 November 2024), 2013.
Fanourakis, D., Aliniaeifard, S., Sellin, A., Giday, H., Körner, O., Rezaei Nejad, A., Delis, C., Bouranis, D., Koubouris, G., Kambourakis, E., Nikoloudakis, N., and Tsaniklidis, G.: Stomatal behavior following mid- or long-term exposure to high relative air humidity: A review, Plant Physiol. Bioch., 153, 92–105, https://doi.org/10.1016/j.plaphy.2020.05.024, 2020.
Fares, S., Loreto, F., Kleist, E., and Wildt, J.: Stomatal uptake and stomatal deposition of ozone in isoprene and monoterpene emitting plants, Plant Biol., 10, 44–54, https://doi.org/10.1055/s-2007-965257, 2008.
Fares, S., Matteucci, G., Scarascia Mugnozza, G., Morani, A., Calfapietra, C., Salvatori, E., Fusaro, L., Manes, F., and Loreto, F.: Testing of models of stomatal ozone fluxes with field measurements in a mixed Mediterranean forest, Atmos. Environ., 67, 242–251, https://doi.org/10.1016/j.atmosenv.2012.11.007, 2013.
Felzer, B., Reilly, J., Melillo, J., Kicklighter, D., Sarofim, M., Wang, C., Prinn, R., and Zhuang, Q.: Future Effects of Ozone on Carbon Sequestration and Climate Change Policy Using a Global Biogeochemical Model, Climatic Change, 73, 345–373, https://doi.org/10.1007/s10584-005-6776-4, 2005.
Feng, Z., De Marco, A., Anav, A., Gualtieri, M., Sicard, P., Tian, H., Fornasier, F., Tao, F., Guo, A., and Paoletti, E.: Economic losses due to ozone impacts on human health, forest productivity and crop yield across China, Environ. Int., 131, 104966, https://doi.org/10.1016/j.envint.2019.104966, 2019a.
Feng, Z., Kobayashi, K., Li, P., Xu, Y., Tang, H., Guo, A., Paoletti, E., and Calatayud, V.: Impacts of current ozone pollution on wheat yield in China as estimated with observed ozone, meteorology and day of flowering, Atmos. Environ., 217, 116945, https://doi.org/10.1016/j.atmosenv.2019.116945, 2019b.
Feng, Z., Hu, T., Tai, A. P. K., and Calatayud, V.: Yield and economic losses in maize caused by ambient ozone in the North China Plain (2014–2017), Sci. Total Environ., 722, 137958, https://doi.org/10.1016/j.scitotenv.2020.137958, 2020.
Fowler, D., Flechard, C., Cape, J. N., Storeton-West, R. L., and Coyle, M.: Measurements of Ozone Deposition to Vegetation Quantifying the Flux, the Stomatal and Non-Stomatal Components, Water Air Soil Poll., 130, 63–74, https://doi.org/10.1023/A:1012243317471, 2001.
Fu, Y. and Tai, A. P. K.: Impact of climate and land cover changes on tropospheric ozone air quality and public health in East Asia between 1980 and 2010, Atmos. Chem. Phys., 15, 10093–10106, https://doi.org/10.5194/acp-15-10093-2015, 2015.
Ghude, S. D., Lal, D. M., Beig, G., van der A, R., and Sable, D.: Rain-Induced Soil NOx Emission From India During the Onset of the Summer Monsoon: A Satellite Perspective, J. Geophys. Res.-Atmos., 115, D16304, https://doi.org/10.1029/2009JD013367, 2010.
Grelle, A. and Keck, H.: Affordable relaxed eddy accumulation system to measure fluxes of H2O, CO2, CH4 and N2O from ecosystems, Agr. Forest Meteorol., 307, 108514, https://doi.org/10.1016/j.agrformet.2021.108514, 2021.
Han, H., Liu, J., Shu, L., Wang, T., and Yuan, H.: Local and synoptic meteorological influences on daily variability in summertime surface ozone in eastern China, Atmos. Chem. Phys., 20, 203–222, https://doi.org/10.5194/acp-20-203-2020, 2020.
Hardacre, C., Wild, O., and Emberson, L.: An evaluation of ozone dry deposition in global scale chemistry climate models, Atmos. Chem. Phys., 15, 6419–6436, https://doi.org/10.5194/acp-15-6419-2015, 2015.
Harmens, H., Hayes, F., Mills, G., Sharps, K., Osborne, S., and Pleijel, H.: Wheat yield responses to stomatal uptake of ozone: Peak vs. rising background ozone conditions, Atmos. Environ., 173, 1–5, https://doi.org/10.1016/j.atmosenv.2017.10.059, 2018.
He, C., Lu, X., Wang, H., Wang, H., Li, Y., He, G., He, Y., Wang, Y., Zhang, Y., Liu, Y., Fan, Q., and Fan, S.: The unexpected high frequency of nocturnal surface ozone enhancement events over China: characteristics and mechanisms, Atmos. Chem. Phys., 22, 15243–15261, https://doi.org/10.5194/acp-22-15243-2022, 2022.
Held, A., Patton, E., Rizzo, L., Smith, J., Turnipseed, A., and Guenther, A.: Relaxed Eddy Accumulation Simulations of Aerosol Number Fluxes and Potential Proxy Scalars, Bound.-Lay. Meteorol., 129, 451–468, https://doi.org/10.1007/s10546-008-9327-5, 2008.
Helmig, D., Lang, E. K., Bariteau, L., Boylan, P., Fairall, C. W., Ganzeveld, L., Hare, J. E., Hueber, J., and Pallandt, M.: Atmosphere-ocean ozone fluxes during the TexAQS 2006, STRATUS 2006, GOMECC 2007, GasEx 2008, and AMMA 2008 cruises, J. Geophys. Res.-Atmos., 117, D04305, https://doi.org/10.1029/2011JD015955, 2012.
Hicks, B. B. and Wesely, M. L.: An examination of some micrometeorological methods for measuring dry deposition, EPA Interagency Energy/Environment R&D Program Report, EPA-600/607-678-116, https://nepis.epa.gov/Exe/ZyPURL.cgi?Dockey=9101DILZ.txt (last access: 5 November 2024), 1978.
Hoshika, Y., Osada, Y., de Marco, A., Peñuelas, J., and Paoletti, E.: Global diurnal and nocturnal parameters of stomatal conductance in woody plants and major crops, Global Ecol. Biogeogr., 27, 257–275, https://doi.org/10.1111/geb.12681, 2018.
Hu, T., Liu, S., Xu, Y., Feng, Z., and Calatayud, V.: Assessment of O3-induced yield and economic losses for wheat in the North China Plain from 2014 to 2017, China, Environ. Pollut., 258, 113828, https://doi.org/10.1016/j.envpol.2019.113828, 2020.
Jarvis, P. G., Monteith, J. L., and Weatherley, P. E.: The interpretation of the variations in leaf water potential and stomatal conductance found in canopies in the field, Philos. T. Roy. Soc. B, 273, 593–610, https://doi.org/10.1098/rstb.1976.0035, 1997.
Kim, D.-G., Vargas, R., Bond-Lamberty, B., and Turetsky, M. R.: Effects of soil rewetting and thawing on soil gas fluxes: a review of current literature and suggestions for future research, Biogeosciences, 9, 2459–2483, https://doi.org/10.5194/bg-9-2459-2012, 2012.
Kobayashi, N., Hiyama, T., Fukushima, Y., Lopez, M. L., Hirano, T., and Fujinuma, Y.: Nighttime transpiration observed over a larch forest in Hokkaido, Japan, Water Resour. Res., 43, W03407, https://doi.org/10.1029/2006WR005556, 2007.
Kuang, Y., Xu, W., Lin, W., Meng, Z., Zhao, H., Ren, S., Zhang, G., Liang, L., and Xu, X.: Explosive morning growth phenomena of NH3 on the North China Plain: Causes and potential impacts on aerosol formation, Environ. Pollut., 257, 113621, https://doi.org/10.1016/j.envpol.2019.113621, 2020.
Kudoyarova, G. R., Veselov, D. S., Faizov, R. G., Veselova, S. V., Ivanov, E. A., and Farkhutdinov, R. G.: Stomata response to changes in temperature and humidity in wheat cultivars grown under contrasting climatic conditions, Russ. J. Plant Physl.+, 54, 46–49, https://doi.org/10.1134/S1021443707010074, 2007.
Kukal, M. S. and Irmak, S.: Nocturnal transpiration in field crops: Implications for temporal aggregation and diurnal weighing of vapor pressure deficit, Agr. Water Manage., 266, 107578, https://doi.org/10.1016/j.agwat.2022.107578, 2022.
Lamaud, E., Loubet, B., Irvine, M., Stella, P., Personne, E., and Cellier, P.: Partitioning of ozone deposition over a developed maize crop between stomatal and non-stomatal uptakes, using eddy-covariance flux measurements and modelling, Agr. Forest Meteorol., 149, 1385–1396, https://doi.org/10.1016/j.agrformet.2009.03.017, 2009.
Lelieveld, J. and Dentener, F. J.: What controls tropospheric ozone?, J. Geophys. Res. Atmos., 105, 3531–3551, https://doi.org/10.1029/1999JD901011, 2000.
Li, K., Jacob, D. J., Liao, H., Shen, L., Zhang, Q., and Bates, K. H.: Anthropogenic drivers of 2013–2017 trends in summer surface ozone in China, P. Natl. Acad. Sci. USA, 116, 422, https://doi.org/10.1073/pnas.1812168116, 2019.
Liao, Q., Ding, R., Du, T., Kang, S., Tong, L., and Li, S.: Stomatal conductance drives variations of yield and water use of maize under water and nitrogen stress, Agr. Water Manage., 268, 107651, https://doi.org/10.1016/j.agwat.2022.107651, 2022.
Lin, W., Xu, X., Ge, B., and Zhang, X.: Characteristics of gaseous pollutants at Gucheng, a rural site southwest of Beijing, J. Geophys. Res.-Atmos., 114, D00G14, https://doi.org/10.1029/2008JD010339, 2009.
Lu, X., Zhang, L., Wang, X., Gao, M., Li, K., Zhang, Y., Yue, X., and Zhang, Y.: Rapid Increases in Warm-Season Surface Ozone and Resulting Health Impact in China Since 2013, Environ. Sci. Tech. Let., 7, 240–247, https://doi.org/10.1021/acs.estlett.0c00171, 2020.
Lyu, X., Li, K., Guo, H., Morawska, L., Zhou, B., Zeren, Y., Jiang, F., Chen, C., Goldstein, A. H., Xu, X., Wang, T., Lu, X., Zhu, T., Querol, X., Chatani, S., Latif, M. T., Schuch, D., Sinha, V., Kumar, P., Mullins, B., Seguel, R., Shao, M., Xue, L., Wang, N., Chen, J., Gao, J., Chai, F., Simpson, I., Sinha, B., and Blake, D. R.: A synergistic ozone-climate control to address emerging ozone pollution challenges, One Earth, 6, 964–977, https://doi.org/10.1016/j.oneear.2023.07.004, 2023.
Ma, Z., Xu, J., Quan, W., Zhang, Z., Lin, W., and Xu, X.: Significant increase of surface ozone at a rural site, north of eastern China, Atmos. Chem. Phys., 16, 3969–3977, https://doi.org/10.5194/acp-16-3969-2016, 2016.
Matsuda, K., Watanabe, I., Mizukami, K., Ban, S., and Takahashi, A.: Dry deposition of PM2.5 sulfate above a hilly forest using relaxed eddy accumulation, Atmos. Environ., 107, 255–261, https://doi.org/10.1016/j.atmosenv.2015.02.050, 2015.
Medlyn, B. E., Duursma, R. A., Eamus, D., Ellsworth, D. S., Prentice, I. C., Barton, C. V. M., Crous, K. Y., De Angelis, P., Freeman, M., and Wingate, L.: Reconciling the optimal and empirical approaches to modelling stomatal conductance, Global Change Biol., 17, 2134–2144, https://doi.org/10.1111/j.1365-2486.2010.02375.x, 2011.
Mészáros, R., Horváth, L., Weidinger, T., Neftel, A., Nemitz, E., Dämmgen, U., Cellier, P., and Loubet, B.: Measurement and modelling ozone fluxes over a cut and fertilized grassland, Biogeosciences, 6, 1987–1999, https://doi.org/10.5194/bg-6-1987-2009, 2009.
Mills, G., Pleijel, H., Malley, C. S., Sinha, B., Cooper, O. R., Schultz, M. G., Neufeld, H. S., Simpson, D., Sharps, K., Feng, Z., Gerosa, G., Harmens, H., Kobayashi, K., Saxena, P., Paoletti, E., Sinha, V., and Xu, X.: Tropospheric Ozone Assessment Report: Present-day tropospheric ozone distribution and trends relevant to vegetation, Elementa: Science of the Anthropocene, 6, 47, https://doi.org/10.1525/elementa.302, 2018.
Mochizuki, T., Tani, A., Takahashi, Y., Saigusa, N., and Ueyama, M.: Long-term measurement of terpenoid flux above a Larix kaempferi forest using a relaxed eddy accumulation method, Atmos. Environ., 83, 53–61, https://doi.org/10.1016/j.atmosenv.2013.10.054, 2014.
Monks, P. S., Archibald, A. T., Colette, A., Cooper, O., Coyle, M., Derwent, R., Fowler, D., Granier, C., Law, K. S., Mills, G. E., Stevenson, D. S., Tarasova, O., Thouret, V., von Schneidemesser, E., Sommariva, R., Wild, O., and Williams, M. L.: Tropospheric ozone and its precursors from the urban to the global scale from air quality to short-lived climate forcer, Atmos. Chem. Phys., 15, 8889–8973, https://doi.org/10.5194/acp-15-8889-2015, 2015.
Moravek, A., Foken, T., and Trebs, I.: Application of a GC-ECD for measurements of biosphere–atmosphere exchange fluxes of peroxyacetyl nitrate using the relaxed eddy accumulation and gradient method, Atmos. Meas. Tech., 7, 2097–2119, https://doi.org/10.5194/amt-7-2097-2014, 2014.
Muller, J. B. A., Coyle, M., Fowler, D., Gallagher, M. W., Nemitz, E. G., and Percival, C. J.: Comparison of ozone fluxes over grassland by gradient and eddy covariance technique, Atmos. Sci. Lett., 10, 164–169, https://doi.org/10.1002/asl.226, 2009.
Myneni, R., Knyazikhin, Y., and Park, T.: MCD15A3H MODIS/Terra+Aqua Leaf Area Index/FPAR 4-day L4 Global 500m SIN Grid V006 [dataset], https://doi.org/10.5067/MODIS/MCD15A3H.006, 2015.
Nelson, A. J., Koloutsou-Vakakis, S., Rood, M. J., Myles, L., Lehmann, C., Bernacchi, C., Balasubramanian, S., Joo, E., Heuer, M., Vieira-Filho, M., and Lin, J.: Season-long ammonia flux measurements above fertilized corn in central Illinois, USA, using relaxed eddy accumulation, Agr. Forest Meteorol., 239, 202–212, https://doi.org/10.1016/j.agrformet.2017.03.010, 2017.
Osterwalder, S., Fritsche, J., Alewell, C., Schmutz, M., Nilsson, M. B., Jocher, G., Sommar, J., Rinne, J., and Bishop, K.: A dual-inlet, single detector relaxed eddy accumulation system for long-term measurement of mercury flux, Atmos. Meas. Tech., 9, 509–524, https://doi.org/10.5194/amt-9-509-2016, 2016.
Otu-Larbi, F., Conte, A., Fares, S., Wild, O., and Ashworth, K.: FORCAsT-gs: Importance of Stomatal Conductance Parameterization to Estimated Ozone Deposition Velocity, 13, e2021MS002581, https://doi.org/10.1029/2021MS002581, 2021.
Pattey, E., Desjardins, R. L., and Rochette, P.: Accuracy of the relaxed eddy-accumulation technique, evaluated using CO2 flux measurements, Bound.-Lay. Meteorol., 66, 341–355, https://doi.org/10.1007/BF00712728, 1993.
Piikki, K., De Temmerman, L., Ojanperä, K., Danielsson, H., and Pleijel, H.: The grain quality of spring wheat (Triticum aestivum L.) in relation to elevated ozone uptake and carbon dioxide exposure, Eur. J. Agron., 28, 245–254, https://doi.org/10.1016/j.eja.2007.07.004, 2008.
Popescu, F.: Transpiration and the economic coefficient of transpiration of Bezostaya wheat as dependent on soil moisture content, Bul. stunt, Univ. Craiova, 9, 67–76, 1967.
Ramírez, D. A., Yactayo, W., Rolando, J. L., and Quiroz, R.: Preliminary Evidence of Nocturnal Transpiration and Stomatal Conductance in Potato and their Interaction with Drought and Yield, Am. J. Potato Res., 95, 139–143, https://doi.org/10.1007/s12230-017-9618-9, 2018.
Rannik, Ü., Altimir, N., Mammarella, I., Bäck, J., Rinne, J., Ruuskanen, T. M., Hari, P., Vesala, T., and Kulmala, M.: Ozone deposition into a boreal forest over a decade of observations: evaluating deposition partitioning and driving variables, Atmos. Chem. Phys., 12, 12165–12182, https://doi.org/10.5194/acp-12-12165-2012, 2012.
Raupach, M. R. and Thom, A. S.: Turbulence in and above Plant Canopies, Annu. Rev. Fluid Mech., 13, 97–129, https://doi.org/10.1146/annurev.fl.13.010181.000525, 1981.
Rawson, H. M. and Clarke, J. M.: Nocturnal transpiration in wheat, Aust. J. Plant Physiol., 15, 397–406, https://doi.org/10.1071/pp9880397, 1988.
Rawson, H. M., Begg, J. E., and Woodward, R. G.: The effect of atmospheric humidity on photosynthesis, transpiration and water use efficiency of leaves of several plant species, Planta, 134, 5–10, https://doi.org/10.1007/BF00390086, 1977.
Reich, P. B., Sendall, K. M., Stefanski, A., Rich, R. L., Hobbie, S. E., and Montgomery, R. A.: Effects of climate warming on photosynthesis in boreal tree species depend on soil moisture, Nature, 562, 263–267, https://doi.org/10.1038/s41586-018-0582-4, 2018.
Ren, X., Sanders, J. E., Rajendran, A., Weber, R. J., Goldstein, A. H., Pusede, S. E., Browne, E. C., Min, K.-E., and Cohen, R. C.: A relaxed eddy accumulation system for measuring vertical fluxes of nitrous acid, Atmos. Meas. Tech., 4, 2093–2103, https://doi.org/10.5194/amt-4-2093-2011, 2011.
Sarkar, C., Turnipseed, A., Shertz, S., Karl, T., Potosnak, M., Bai, J., Serça, D., Bonal, D., Burban, B., Lopes, P. R. C., Vega, O., and Guenther, A. B.: A portable, low-cost relaxed eddy accumulation (REA) system for quantifying ecosystem-level fluxes of volatile organics, Atmos. Environ., 242, 117764, https://doi.org/10.1016/j.atmosenv.2020.117764, 2020.
Schindlbacher, A., Zechmeister-Boltenstern, S., and Butterbach-Bahl, K.: Effects of soil moisture and temperature on NO, NO2, and N2O emissions from European forest soils, J. Geophys. Res.-Atmos., 109, D13702, https://doi.org/10.1029/2004JD004590, 2004.
Schoppach, R., Sinclair, T. R., and Sadok, W.: Sleep tight and wake-up early: nocturnal transpiration traits to increase wheat drought tolerance in a Mediterranean environment, Funct. Plant Biol., 47, 1117–1127, https://doi.org/10.1071/fp20044, 2020.
Seinfeld, J. H., Pandis, S. N., and Noone, K.: Atmospheric Chemistry and Physics: From Air Pollution to Climate Change, 2nd edn., John Wiley & Sons, Inc., Hoboken, New Jersey, United States, ISBN 9780471720188, 2006.
Stella, P., Loubet, B., Lamaud, E., Laville, P., and Cellier, P.: Ozone deposition onto bare soil: A new parameterisation, Agr. Forest Meteorol., 151, 669–681, https://doi.org/10.1016/j.agrformet.2011.01.015, 2011a.
Stella, P., Personne, E., Loubet, B., Lamaud, E., Ceschia, E., Béziat, P., Bonnefond, J. M., Irvine, M., Keravec, P., Mascher, N., and Cellier, P.: Predicting and partitioning ozone fluxes to maize crops from sowing to harvest: the Surfatm-O3 model, Biogeosciences, 8, 2869–2886, https://doi.org/10.5194/bg-8-2869-2011, 2011b.
Stella, P., Loubet, B., de Berranger, C., Charrier, X., Ceschia, E., Gerosa, G., Finco, A., Lamaud, E., Serça, D., George, C., and Ciuraru, R.: Soil ozone deposition: Dependence of soil resistance to soil texture, Atmos. Environ., 199, 202–209, https://doi.org/10.1016/j.atmosenv.2018.11.036, 2019.
Stocker, D. W., Zeller, K. F., and Stedman, D. H.: O3 and NO2 fluxes over snow measured by eddy correlation, Atmos. Environ., 29, 1299–1305, https://doi.org/10.1016/1352-2310(94)00337-K, 1995.
Tai, A. P. K., Martin, M. V., and Heald, C. L.: Threat to future global food security from climate change and ozone air pollution, Nat. Clim. Change, 4, 817–821, https://doi.org/10.1038/nclimate2317, 2014.
Tamang, B. G., Schoppach, R., Monnens, D., Steffenson, B. J., Anderson, J. A., and Sadok, W.: Variability in temperature-independent transpiration responses to evaporative demand correlate with nighttime water use and its circadian control across diverse wheat populations, Planta, 250, 115–127, https://doi.org/10.1007/s00425-019-03151-0, 2019.
Tang, G., Zhu, X., Xin, J., Hu, B., Song, T., Sun, Y., Zhang, J., Wang, L., Cheng, M., Chao, N., Kong, L., Li, X., and Wang, Y.: Modelling study of boundary-layer ozone over northern China – Part I: Ozone budget in summer, Atmos. Res., 187, 128–137, https://doi.org/10.1016/j.atmosres.2016.10.017, 2017.
Tong, L., Xiao, H., Qian, F., Huang, Z., Feng, J., and Wang, X.: Daytime and Phenological Characteristics of O3 and CO2 Fluxes of Winter Wheat Canopy Under Short-Term O3 Exposure, Water Air Soil Poll., 227, 4, https://doi.org/10.1007/s11270-015-2698-6, 2015.
Tsai, J.-L., Tsuang, B.-J., Kuo, P.-H., Tu, C.-Y., Chen, C.-L., Hsueh, M.-T., Lee, C.-S., Yao, M.-H., and Hsueh, M.-L.: Evaluation of the relaxed eddy accumulation coefficient at various wetland ecosystems, Atmos. Environ., 60, 336–347, https://doi.org/10.1016/j.atmosenv.2012.06.081, 2012.
van Meeningen, Y., Schurgers, G., Rinnan, R., and Holst, T.: Isoprenoid emission response to changing light conditions of English oak, European beech and Norway spruce, Biogeosciences, 14, 4045–4060, https://doi.org/10.5194/bg-14-4045-2017, 2017.
Venables, W. N. and Ripley, B. D.: Modern Applied Statistics with S, Springer, New York, USA, ISBN 0387954570, 2003.
Vilà-Guerau De Arellano, J. and Duynkerke, P. G.: Influence of chemistry on the flux-gradient relationships for the NO-O3-NO2 system, Bound.-Lay. Meteorol., 61, 375–387, https://doi.org/10.1007/BF00119098, 1992.
Wang, P., Yang, Y., Li, H., Chen, L., Dang, R., Xue, D., Li, B., Tang, J., Leung, L. R., and Liao, H.: North China Plain as a hot spot of ozone pollution exacerbated by extreme high temperatures, Atmos. Chem. Phys., 22, 4705–4719, https://doi.org/10.5194/acp-22-4705-2022, 2022.
Wang, T., Xue, L., Brimblecombe, P., Lam, Y. F., Li, L., and Zhang, L.: Ozone pollution in China: A review of concentrations, meteorological influences, chemical precursors, and effects, Sci. Total Environ., 575, 1582–1596, https://doi.org/10.1016/j.scitotenv.2016.10.081, 2017.
Weber, B., Wu, D., Tamm, A., Ruckteschler, N., Rodríguez-Caballero, E., Steinkamp, J., Meusel, H., Elbert, W., Behrendt, T., Sörgel, M., Cheng, Y., Crutzen, P. J., Su, H., and Pöschl, U.: Biological soil crusts accelerate the nitrogen cycle through large NO and HONO emissions in drylands, P. Natl. Acad. Sci. USA, 112, 15384–15389, https://doi.org/10.1073/pnas.1515818112, 2015.
Wild, O.: Modelling the global tropospheric ozone budget: exploring the variability in current models, Atmos. Chem. Phys., 7, 2643–2660, https://doi.org/10.5194/acp-7-2643-2007, 2007.
Wu, X., Xu, Y., Shi, J., Zuo, Q., Zhang, T., Wang, L., Xue, X., and Ben-Gal, A.: Estimating stomatal conductance and evapotranspiration of winter wheat using a soil-plant water relations-based stress index, Agr. Forest Meteorol., 303, 108393, https://doi.org/10.1016/j.agrformet.2021.108393, 2021.
Wu, Z. Y., Zhang, L., Wang, X. M., and Munger, J. W.: A modified micrometeorological gradient method for estimating O3 dry depositions over a forest canopy, Atmos. Chem. Phys., 15, 7487–7496, https://doi.org/10.5194/acp-15-7487-2015, 2015.
Xu, J., Zheng, Y., Mai, B., Zhao, H., Chu, Z., Huang, J., and Yuan, Y.: Simulating and partitioning ozone flux in winter wheat field: the Surfatm-O3 model, China Environmental Science, 38, 455–470, 2018 (in Chinese).
Xu, M., Kasahara, K., Sorimachi, A., and Matsuda, K.: Nitric acid dry deposition associated with equilibrium shift of ammonium nitrate above a forest by long-term measurement using relaxed eddy accumulation, Atmos. Environ., 256, 118454, https://doi.org/10.1016/j.atmosenv.2021.118454, 2021.
Xu, W., Kuang, Y., Zhao, C., Tao, J., Zhao, G., Bian, Y., Yang, W., Yu, Y., Shen, C., Liang, L., Zhang, G., Lin, W., and Xu, X.: NH3-promoted hydrolysis of NO2 induces explosive growth in HONO, Atmos. Chem. Phys., 19, 10557–10570, https://doi.org/10.5194/acp-19-10557-2019, 2019.
Xu, X.: Recent advances in studies of ozone pollution and impacts in China: A short review, Current Opinion in Environmental Science & Health, 19, 100225, https://doi.org/10.1016/j.coesh.2020.100225, 2021.
Xu, X., Bingemer, H. G., and Schmidt, U.: The flux of carbonyl sulfide and carbon disulfide between the atmosphere and a spruce forest, Atmos. Chem. Phys., 2, 171–181, https://doi.org/10.5194/acp-2-171-2002, 2002.
Xu, X., Lin, W., Xu, W., Jin, J., Wang, Y., Zhang, G., Zhang, X., Ma, Z., Dong, Y., Ma, Q., Yu, D., Li, Z., Wang, D., and Zhao, H.: Long-term changes of regional ozone in China: implications for human health and ecosystem impacts, Elementa: Science of the Anthropocene, 8, 13, https://doi.org/10.1525/elementa.409, 2020.
Yang, W., Cao, J., Wu, Y., Kong, F., and Li, L.: Review on plant terpenoid emissions worldwide and in China, Sci. Total Environ., 787, 147454, https://doi.org/10.1016/j.scitotenv.2021.147454, 2021.
Yu, Q., Zhang, Y., Liu, Y., and Shi, P.: Simulation of the Stomatal Conductance of Winter Wheat in Response to Light, Temperature and CO2 Changes, Ann. Bot.-London, 93, 435–441, https://doi.org/10.1093/aob/mch023, 2004.
Yuan, X., Calatayud, V., Gao, F., Fares, S., Paoletti, E., Tian, Y., and Feng, Z.: Interaction of drought and ozone exposure on isoprene emission from extensively cultivated poplar, Plant Cell Environ., 39, 2276–2287, https://doi.org/10.1111/pce.12798, 2016.
Zhang, X., Xu, W., Zhang, G., Lin, W., Zhao, H., Ren, S., Zhou, G., Chen, J., and Xu, X.: Discrepancies in ozone levels and temporal variations between urban and rural North China Plain: Possible implications for agricultural impact assessment across China, Elementa: Science of the Anthropocene, 10, 1, https://doi.org/10.1525/elementa.2022.00019, 2022a.
Zhang, X., Xu, W., Zhang, G., Lin, W., Zhao, H., Ren, S., Zhou, G., Chen, J., and Xu, X.: First long-term surface ozone variations at an agricultural site in the North China Plain: Evolution under changing meteorology and emissions, Sci. Total Environ., 860, 160520, https://doi.org/10.1016/j.scitotenv.2022.160520, 2022b.
Zhu, Z., Sun, X., Dong, Y., Zhao, F., and Meixner, F. X.: Diurnal variation of ozone flux over corn field in Northwestern Shandong Plain of China, Sci. China Earth Sci., 57, 503–511, https://doi.org/10.1007/s11430-013-4797-9, 2014.
Zhu, Z., Sun, X., Zhao, F., and Meixner, F. X.: Ozone concentrations, flux and potential effect on yield during wheat growth in the Northwest-Shandong Plain of China, J. Environ. Sci.-China, 34, 1–9, https://doi.org/10.1016/j.jes.2014.12.022, 2015.
Zörner, J., Penning de Vries, M., Beirle, S., Sihler, H., Veres, P. R., Williams, J., and Wagner, T.: Multi-satellite sensor study on precipitation-induced emission pulses of NOx from soils in semi-arid ecosystems, Atmos. Chem. Phys., 16, 9457–9487, https://doi.org/10.5194/acp-16-9457-2016, 2016.


