the Creative Commons Attribution 4.0 License.
the Creative Commons Attribution 4.0 License.
 | 24 Sep 2024
Quantifying large methane emissions from the Nord Stream pipeline gas leak of September 2022 using IASI satellite observations and inverse modelling
Brian J. Kerridge
Richard Siddans
David P. Moore
Lucy J. Ventress
Emily Dowd
Wuhu Feng
Martyn P. Chipperfield
John J. Remedios
The sudden leaks from the Nord Stream gas pipelines, which began on 26 September 2022, released a substantial amount of methane (CH4) into the atmosphere. From the Infrared Atmospheric Sounding Interferometer (IASI) instrument onboard EUMETSAT's MetOp-B, we document the first satellite-based retrievals of column-average CH4 (XCH4) that clearly show the large CH4 plume emitted from the pipelines. The data display elevations greater than 200 ppb (parts per billion, ∼ 11 %) above observed background values (1882 ± 21 ppb). Based on the IASI data, together with an integrated mass enhancement technique and formal model-based inversions applied for the first time to thermal infrared satellite methane plume data, we quantify the total mass of CH4 emitted into the atmosphere during the first 2 d of the leaks to be 219–427 Gg CH4. Substantial temporal heterogeneity is displayed in our model-derived flux rate, with three or four distinct peaks in emission rate over the first 2 d. Our range overlaps with other previous estimates, which were 75–230 Gg CH4 and were mostly based on inversions that assimilated in situ observations from nearby tower sites. However, our derived values are generally larger than those previous results, with the differences likely due to the fact that our results are the first to use satellite-based observations of XCH4 from the days following the leaks. We incorporate multiple satellite overpasses that monitored the CH4 plume as it was transported across Scandinavia and the North Sea up to the evening of 28 September 2022. We produced model simulations of the atmospheric transport of the plume using the Eulerian atmospheric transport model, TOMCAT, which show good representation of the plume location in the days following the leaks. The performance of simulated CH4 mixing ratios at four nearby in situ measurement sites compared to the observed in situ values is mixed, which highlights the challenges inherent in representing short-term plume movement over a specific location using a model such as TOMCAT with a relatively coarse Eulerian grid. Our results confirm the leak of the Nord Stream pipes to clearly be the largest individual fossil-fuel-related leak of CH4 on record, greatly surpassing the previous largest leak (95 Gg CH4) at the Aliso Canyon gas facility in California in 2015–2016.
- Article
(5251 KB) - Full-text XML
-
Supplement
(4037 KB) - BibTeX
- EndNote


Nord Stream is an offshore submerged pipeline network that carries natural gas from Russian facilities into Western Europe. The network is made up of two sets of double pipelines (NS1 and NS2; i.e. four pipelines in total), each originating in Russia and running through the Baltic Sea to Lubmin, Germany (Fig. 1). NS1 has been operating since 2011, but the NS2 pipeline has not yet entered service, although it has carried natural gas. On 26 September 2022, multiple significant underwater gas leaks from these pipelines were detected by Nord Stream and the Danish Energy Agency, with apparently substantial gas emission through the water to the atmosphere (Danish Energy Agency, 2022). This was monitored by multiple national and international bodies over the following days. NS2 first began to leak on the morning of 26 September, from a location (54.88° N, 15.41° E) near the Danish island of Bornholm, whilst leaks were detected from NS1 at two more northerly locations (55.54° N, 15.60° E and 55.56° N, 15.79° E) later that day (leak locations marked with red stars in Fig. 1). There were reports of explosions in the area around the times that these leaks were detected (e.g. GEUS, 2022), and the pressure in the pipelines underwent an abrupt and dramatic decrease, indicative of sudden ruptures in the pipes. Neither pipeline was transporting natural gas into Europe at the time, but both contained substantial quantities of gas, the vast majority of which is methane (CH4). This was released to the water and detected as large bubbles at the surface as it was further emitted into the atmosphere. Regions up to 0.7 km in diameter of rising gas bubbles were detected at the surface by in situ monitoring teams and by various satellite high-resolution imagers (e.g. Jia et al., 2022). The release of gas from the pipelines continued for a number of days before the Danish Energy Agency declared that the leaks had ceased on 2 October 2022.
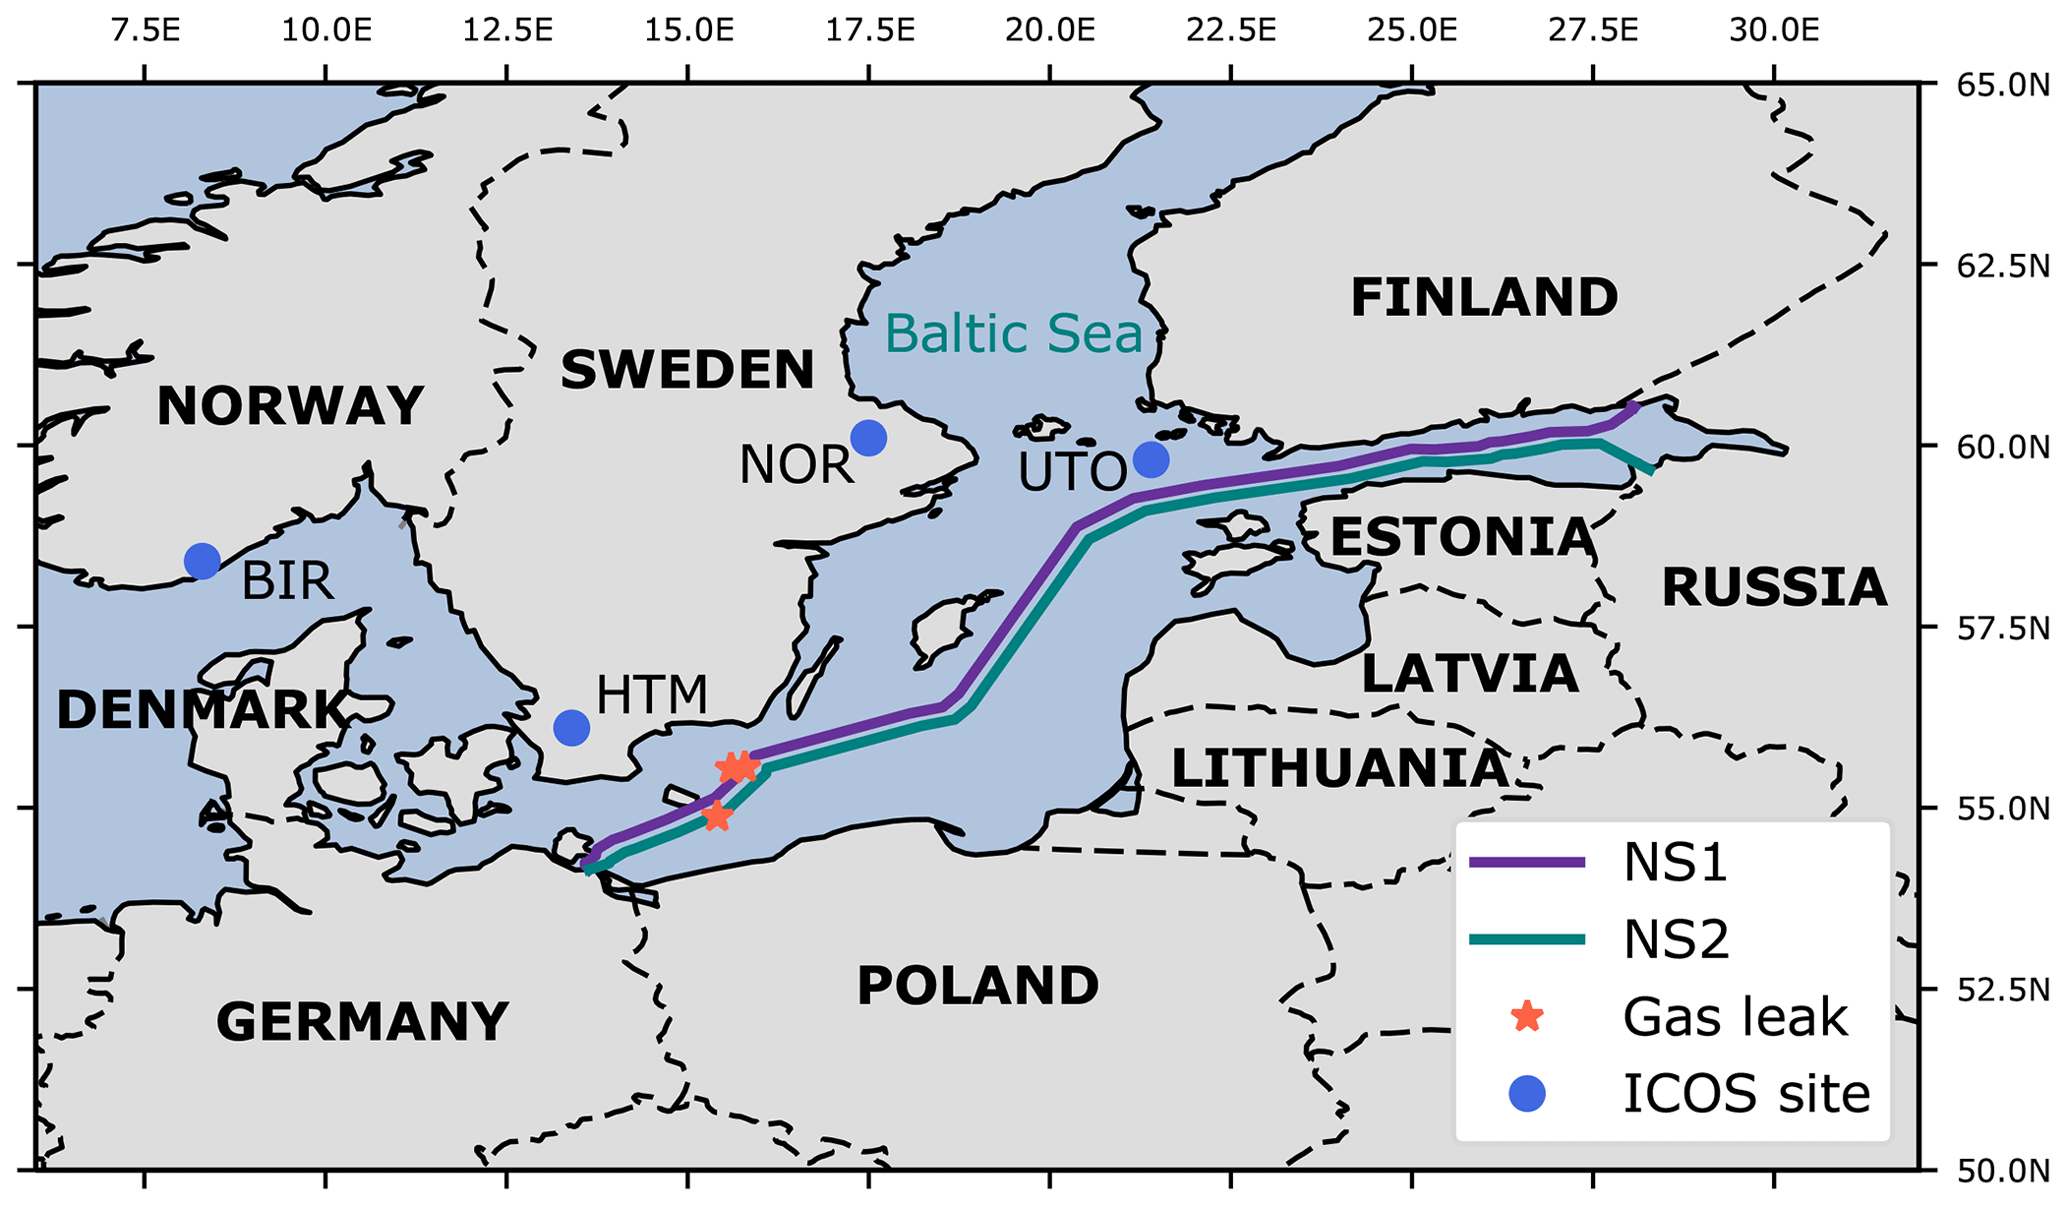
Figure 1Map showing Nord Stream pipeline routes (teal and purple lines), gas leak locations (red stars) and in situ ICOS monitoring site locations (blue circles). Pipeline route adapted from Open Street Map https://www.openstreetmap.org/relation/2006544 and https://bellona.org/assets/sites/4/2015/06/fil_route_territorial_waters_and_eez.pdf (both last accessed 17 September 2024). Leak locations taken from Danish Energy Agency (2022).
CH4 is the second most significant greenhouse gas after carbon dioxide (CO2). Human-induced emissions of CH4 have been responsible for 1.19 (0.81–1.58) W m−2 of anthropogenic effective radiative forcing since 1750 (net total of 2.72 (1.96–3.48) W m−2; Szopa et al., 2021), with recent international agreements (UNFCCC, 2015; European Commission, 2021) having been put in place to urgently and significantly reduce CH4 emissions for many countries. Recent satellite observations have shown that there are hundreds of CH4 point source leaks worldwide, contributing to direct anthropogenic emissions (e.g. Lauvaux et al., 2022). Growing levels of atmospheric CH4 also adversely affect human health by contributing to increasing tropospheric ozone (West et al., 2006). A sudden large release of CH4 into the atmosphere such as the one from Nord Stream could have significant consequences in terms of climate change and health. It is therefore important that the CH4 emitted to the atmosphere during the Nord Stream leaks is accurately quantified. Various estimates ranging from 75 to 230 Gg CH4 (75 000–230 000 t) have been suggested as to the quantity of CH4 released to the atmosphere through assorted methodologies (see Jia et al., 2022; UNEP and IMEO, 2023).
Previous observational and modelling work (NILU, 2022; CAMS, 2022; NCEO, 2022; Jia et al., 2022) has shown that a plume of CH4 originating from the location of the leaks was initially transported eastwards towards Finland's southern coast on 26 and 27 September before a change in the wind direction then pushed it back out across Sweden and Norway and out into the North Sea to the north of Scotland late on 27 and 28 September. Significantly elevated near-surface CH4 concentrations were briefly observed at a number of Integrated Carbon Observation System (ICOS) measurement towers in Scandinavia over the course of these 3 d, but there has been no direct satellite retrieval of downwind CH4 concentrations available for the area to provide a more complete observation of the plume.
The Infrared Atmospheric Sounding Interferometer (IASI) onboard EUMETSAT's MetOp-B satellite is an across-track scanning thermal infrared sounder from which CH4 distributions can be retrieved twice per day with high accuracy (Siddans et al., 2017). IASI's regular overpass times meant that it observed the area surrounding the CH4 leak at approximately 09:30 and 21:30 LT (local time) each day. Thanks to favourable observing conditions, IASI observed enhanced CH4 concentrations over the Baltic and the North Sea in the days following the detection of the Nord Stream leaks. We use this data, together with in situ observations from the ICOS network and an atmospheric chemical transport model, in order to quantify the total CH4 emitted to the atmosphere from Nord Stream during the first 2 d of the leaks. This is the first time that plume flux inversions have been carried out using thermal infrared satellite data. Here we describe the results of this quantification and put into context the derived CH4 contribution from these leaks compared with both previous similar large gas releases and the global CH4 budget.
Section 2 describes the IASI methane retrieval scheme used in this study, the CH4 distributions retrieved from the satellite and the ICOS data. Section 3 describes the atmospheric model and the inverse modelling technique. We present our results in Sect. 4 before discussing their implications and concluding our discussion in Sects. 5 and 6, respectively.
2.1 IASI retrievals
IASI is a cross-track-scanning Michelson interferometer (Blumstein et al., 2004) housed on board the EUMETSAT polar-orbiting MetOp-B satellite, which was launched in 2012. Identical instruments are hosted on MetOp-A and MetOp-C, launched in 2006 and 2018, respectively, although MetOp-A is no longer operational. IASI provides daily global coverage with four circular footprints of approximately 12 km diameter at nadir, arranged in a 2 × 2 square grid of 50 km × 50 km. The IASI instrument measures upwelling thermal infrared radiation (TIR) with 8461 channels at 0.25 cm−1 spectral resolution, ranging from 645 to 2760 cm−1. Observations are made at approximately 09:30 (descending node) and 21:30 (ascending node) local time each day. Column-average CH4 distributions used here were retrieved using an updated version (v2.0) of a scheme developed originally for MetOp-A (Siddans et al., 2017), which has since been applied to MetOp-B (Knappett et al., 2022) and is running in near-real time at the Rutherford Appleton Laboratory (RAL) in Oxfordshire, UK (http://rsg.rl.ac.uk/vistool, last access: 24 September 2024). Updates included in the v2.0 scheme include improved representation of prior covariance; changes to spectroscopy in the radiative transport model; an updated elevation model; and improvements to the representation of cloud, temperature, and emissivity (Buchwitz et al., 2023). The v2.0 scheme retrieves CH4 from measurements of its spectral signature in the 7.9 µm (1260 cm−1) region (ν4 fundamental vibration–rotation band). Vertical sensitivity generally peaks in the middle–upper troposphere since the spectral absorption signature is determined by temperature contrast with the surface. These data have previously been used for various studies of the atmosphere (e.g. Robson et al., 2020; Pope et al., 2021; Pimlott et al., 2022; Buchwitz et al., 2023).
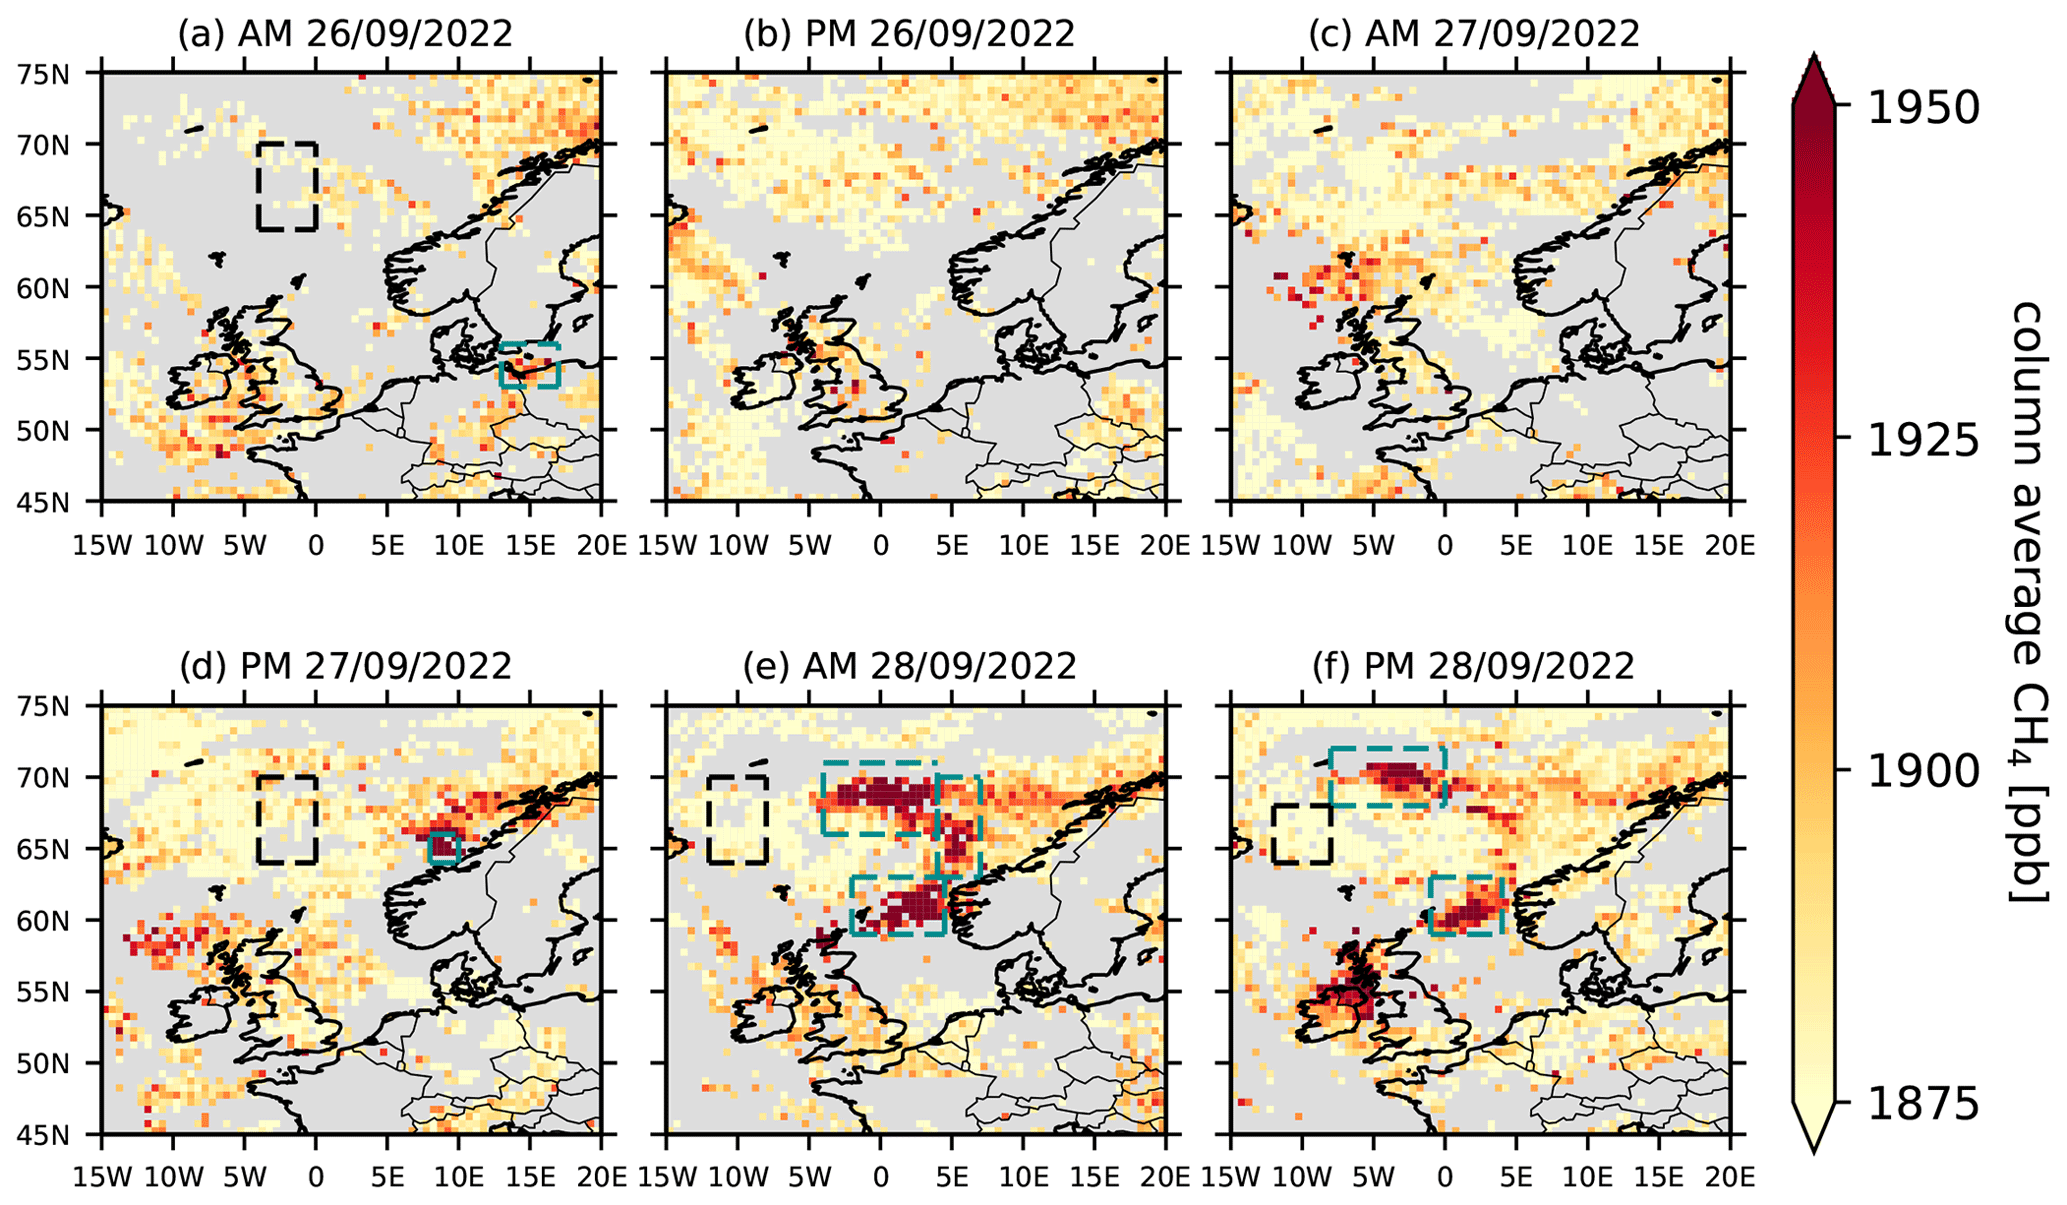
Figure 2IASI column average CH4 ( ppb) for 26–28 September 2022. Retrievals are averaged onto 0.25° × 0.25° grid boxes, weighted inversely to their uncertainties for the morning and evening overpasses of each day. Dashed black boxes show background regions used in the integrated mass enhancement (IME) method, whilst dashed turquoise boxes show enhancement regions. Grey regions are obscured by cloud.
Elevated CH4 mixing ratios were observed by IASI in the Baltic Sea above the leak sites on the morning of 26 September (Fig. 2). However, cloudy conditions over much of Scandinavia and the North Sea meant that the plume was neither detected during the evening overpass on 26 September nor on the morning of 27 September. Large CH4 mixing ratios off the northern coast of the UK on 27 September are likely unrelated to Nord Stream, although their source is unknown. Very high CH4 concentrations were then detected over the North Sea off the west coast of Norway on the evening of 27 September and morning and evening of 28 September. On the morning of 28 September in particular, a very distinct plume shape was detectable in IASI data, with areas of enhanced CH4 around the northern and southern regions of the Norwegian coast. After that day, the plume became too diffuse to be distinguished from background concentrations. Retrieved column-averaged CH4 (XCH4) enhancements within the plume on the morning of 28 September are up to 200 ppb (∼ 11 %), relative to the nearby background CH4 mixing ratios of 1882 ± 21 ppb (mean and standard deviation). The IASI retrievals documented here are the only satellite observations that captured a coherent XCH4 plume from the Nord Stream leaks over the North Sea in the days immediately after the leaks began. On 30 September 2022, the Greenhouse Gas Emissions Monitoring (GHGSat) group's satellite constellation did capture a plume as it was emitted immediately above the leak location (GHGSat, 2022), although this was some days after the leaks began and by this point the emission rate was fairly small (∼ 0.08 Gg h−1). Although they operate at very high spatial resolution, GHGSat satellites retrieve only the CH4 enhancement above the background rather than total XCH4 and only target specific sources. Meanwhile, Landsat-8-OLI and Sentinel-2B also detected enhanced CH4 from high-resolution images over the leak locations on 29 and 30 September (Jia et al., 2022), although these retrievals had large uncertainties associated with them.
2.2 ICOS network
Consistent in situ monitoring of CH4 mixing ratios is carried out by the Integrated Carbon Observation System (ICOS) network (Levin et al., 2020; Heiskanen et al., 2022, https://www.icos-cp.eu/, last access: 24 September 2024), a group of more than 140 monitoring sites located across Europe and Great Britain, including a number of measurement sites around southern Scandinavia. These sites measure greenhouse gas mixing ratios and fluxes in the atmosphere, ecosystems and oceans. The network includes 46 tall-tower sites across 16 countries that measure greenhouse gas concentrations in the atmosphere, along with meteorological parameters. These include four sites near Scandinavia that continuously measure CO2, CH4 and carbon monoxide (CO) mixing ratios at multiple heights between 10 and 150 m above the surface. These are located at Birkenes, Norway (BIR, 58.4° N, 8.3° E, 219 , metres above sea level); Hyltemossa, Sweden (HTM, 56.1° N, 13.4° E, 115 ); Norunda, Sweden (NOR, 60.1° N, 17.5° E, 46 ); and Utö, Finland (UTO, 59.8° N, 21.4° E, 8 ). Sites are equipped with Picarro, Inc. G2401 cavity ring-down spectroscopy gas analysers, providing continuous CH4 mixing ratios with a mean difference of 0.2 ± 0.8 ppb compared to concurrent flask observations (Levin et al., 2020). The sites discussed here have inlets at heights between 10 and 150 m above the ground (Hatakka et al., 2023; ICOS RI et al., 2023).
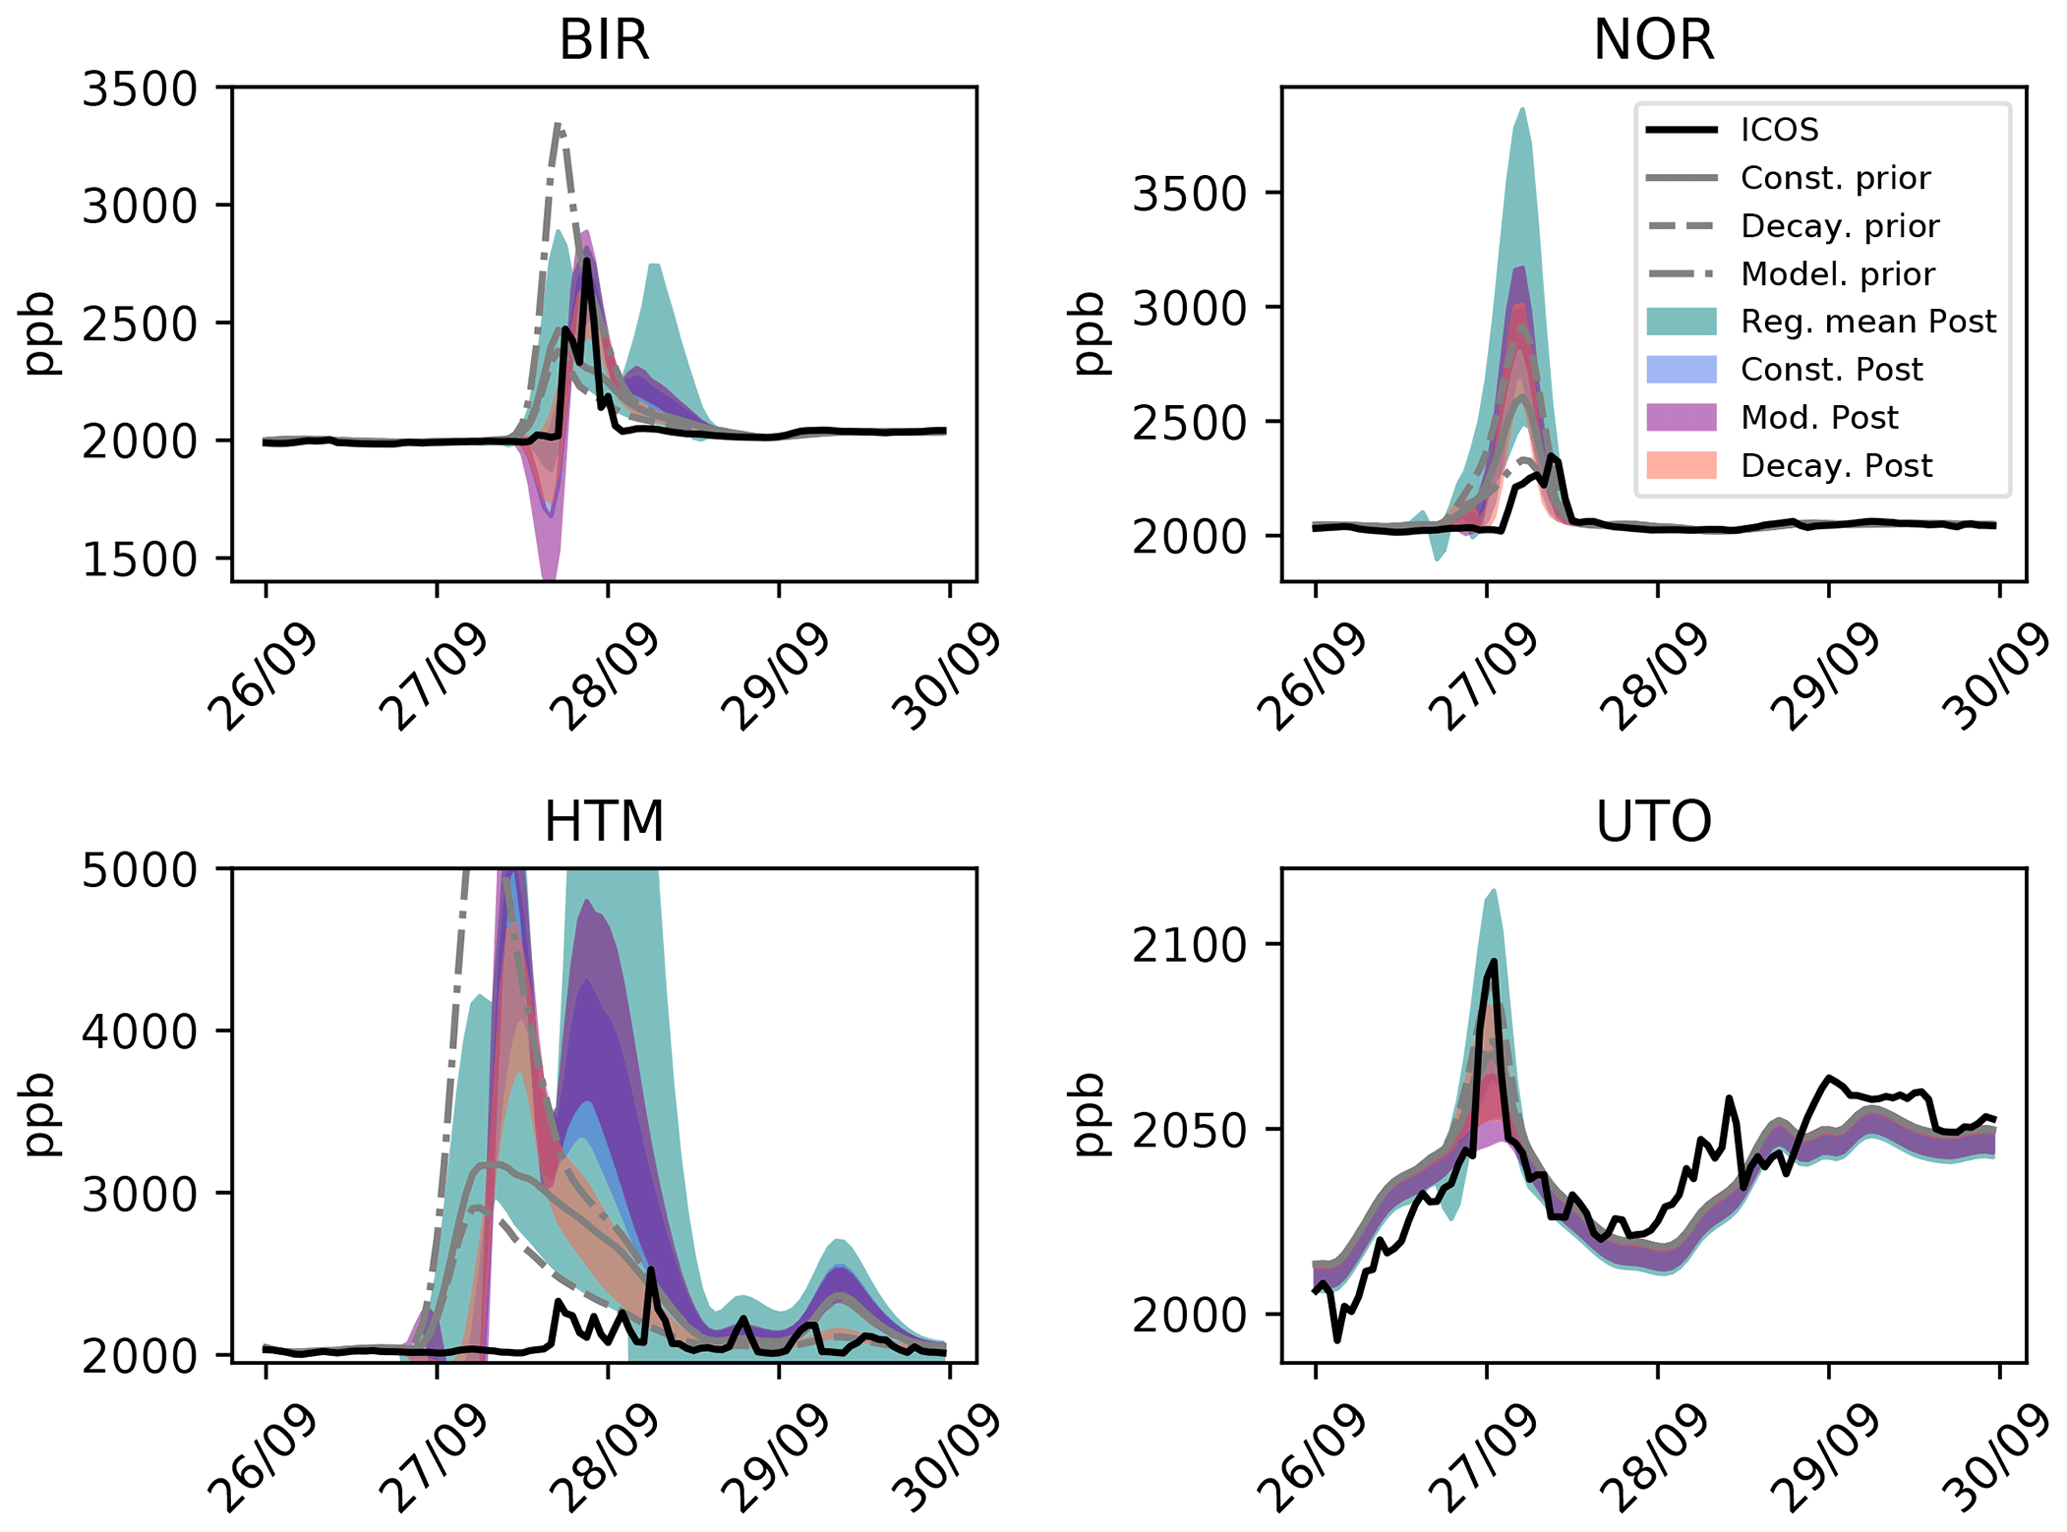
Figure 3Observed (black line) and simulated (grey lines and coloured shading) CH4 mixing ratios (ppb) at Integrated Carbon Observation System (ICOS) sites during 26–29 September 2022. Observations and model output are both averaged into hourly means. ICOS sites are at Birkenes, Norway (BIR); Norunda, Sweden (NOR); Hyltemossa, Sweden (HTM); and Utö, Finland (UTO). See main text and Fig. 1 for further details. Grey lines show TOMCAT-simulated CH4 using the three prior emission estimates, and shaded regions show the simulated min/max range for the inversions with constant prior (blue), decaying prior (red) and modelled prior (purple) optimised against individual retrievals and for inversions optimised against the regional mean (teal). Inlet heights are the highest available at each site: 75 m at BIR, 100 m at NOR, 150 m at HTM and 57 m at UTO. Note the different y-axis ranges in each panel.
Significant enhancements of CH4 (up to 770 ppb or ∼ 39 %) were detected at each of these sites in the days following the Nord Stream leaks (Fig. 3). We compare to the highest-altitude inlet for each site, which ranges between 57 and 150 m above the ground across the four sites. UTO has only one inlet height. At the other locations, observed CH4 mixing ratios can be quite different (up to 40 ppb at HTM and NOR and up to 300 ppb at BIR) across inlets, and we choose the highest inlet height to attempt to reduce the impact of boundary layer mixing. There were relatively small CH4 enhancements at UTO late on 26 September before larger enhancements were detected at NOR, HTM and finally BIR on the evening of the next day. The elevated concentrations at BIR were larger than at any other location. These observed values are consistent with the CH4 plume from the leak being transported eastwards and then moving back westwards across Scandinavia before it was detected by IASI off the west coast of Norway on 27 and 28 September. Here we used the data obtained at the ICOS locations for independent verification of our IASI-based analysis of the Nord Stream leaks.
We used two methods to estimate the total mass of CH4 in the plume observed by IASI. We first applied an integrated mass enhancement (IME) technique in tandem with Lagrangian model simulations in order to estimate the total extra mass of CH4 contained within the plume relative to local background concentrations. The Lagrangian model is used to inform the definition of the “plume” and “background” regions. This method has the advantage that unlike formal inversions, it is not directly dependent on the accuracy of model transport to quantify the mass of CH4 in the plume, but the main disadvantage is that it is not possible to exploit the averaging kernels (AKs) of the IASI retrievals to account for the vertical sensitivity of the derived XCH4, which peaks in the middle–upper troposphere. It also does not account for cloudy regions in which CH4 is not retrieved. We therefore also employed a formal inverse modelling method based on simulation from a Eulerian chemical transport model, which allowed us to model the plume directly and to account for the satellite AKs.
The IME methodology used the Hybrid Single Particle Lagrangian Integrated Trajectory (HYSPLIT) model (Draxler and Hess, 1998) to produce a trajectory analysis that we combined with the XCH4 data to determine boundaries for the enhanced CH4 region due to the leaks. The HYSPLIT model was initiated with Global Forecast System (GFS) meteorological data, with forward model trajectories starting at 1, 2 and 3 km from 00:00 UTC on 26 September, running through to 00:00 UTC on 30 September. All three trajectories showed a similar pathway over the Baltic Sea, crossing Sweden during the morning of 27 September and reaching the Norwegian Sea by 28 September. These trajectories, along with the IASI observations themselves, were used to define suitable enhanced XCH4 regions and background regions, which represented the likely XCH4 without the presence of the Nord Stream plume. The background regions were defined to the west of the calculated plume trajectories, at similar latitude ranges, away from the area affected by the leaks and over the ocean to preclude potential local sources of CH4. Background and enhancement regions are shown in Fig. 2. The total additional CH4 burden was calculated by computing the difference in the mean XCH4 concentrations over the two regions and multiplying by the area. Estimates of the uncertainty were derived by perturbing the boundaries of the background area chosen in each case with 4 scenarios, adjusting latitude- and longitude-box edges by ± 1°. We calculated estimates for the scenes observed on the morning of 26 September, the evening of 27 September and both the morning and evening of 28 September. The enhanced and background regions were allowed to vary over time as the plume moved and dispersed across the North Sea. Multiple enhancement regions were permitted within a single overpass. Due to the cloud cover affecting our estimation of the background XCH4 in some cases, it is possible that these estimates include some sampling error that is difficult to quantify due to the cloud cover itself. We assume that this contribution to the uncertainty is small, however, since perturbing the boundaries of the background region does not cause large changes.
We also applied an atmospheric inversion technique to the IASI data to produce an optimised time-varying estimate of the emission rate for CH4 from the leak. We used the global chemical transport model, TOMCAT (Chipperfield, 2006; Monks et al., 2017), to simulate the emission and transport of CH4 from the location of the leak. TOMCAT has been used in a number of previous studies related to atmospheric CH4 (e.g. McNorton et al., 2016, 2018; Wilson et al., 2016, 2021; Dowd et al., 2023), along with other atmospheric species. We ran the model at a horizontal resolution of 1.125° × 1.125°, which equates to approximately 65 km (east–west edges) × 125 km (north–south edges) at 60° N. There were 60 vertical levels from the surface up to 0.1 hPa. The model dynamical time step was 5 min. The model was forced by meteorological data from the European Centre for Medium-range Weather Forecasts (ECMWF) operational analyses, regridded to the same horizontal and vertical resolution as the model grid. The meteorological data were read into the model every 6 h and linearly interpolated in time for each model time step. The initial conditions were produced from a previous forward simulation that ran up to 00:00 UTC 26 September 2022. Our simulation for the inversion ran from this time until 00:00 UTC 29 September 2022.
We simulated all non-plume-related CH4 transport and chemistry as a separate tracer in the model, with all CH4 fluxes from sources other than Nord Stream included in this background CH4 tracer. Wetland emissions were taken from the WetCHARTs inventory (Bloom et al., 2017). Anthropogenic emissions were taken from the EDGAR v5 inventory (Crippa et al., 2020), whilst fire emissions were from the Global Fire Emissions Database (GFED v4.1s; van der Werf et al., 2017). Emissions from all other sectors, the soil sink of CH4 and the monthly mean offline atmospheric loss rates were as described in Wilson et al. (2021). Stratospheric loss rates due to O(1D) and chlorine are taken from a previous TOMCAT full-chemistry simulation (Monks et al., 2017), and hydroxyl radical distributions are based on Spivakovsky et al. (2000). The enhanced XCH4 observed by IASI is large compared to contributions from other sources, and the model run is short, so the effect of uncertainties from other sources and sinks of CH4 should be minimal.
The emissions from the Nord Stream leak were treated as coming from point sources in the model (at 54.88° N, 15.41° E; 55.54° N, 15.60° E; and 55.56° N, 15.79° E), although these were instantly spread across the surface model grid cells containing the leaks. The southernmost leak was located near a model grid cell boundary in the longitudinal direction (at 15.2° E), so this leak was split equally between the two adjacent grid cells. This artificial instantaneous spreading out of the CH4 from the leak will likely have some effect on the model's representation of the plume movement but is unavoidable in a Eulerian model such as TOMCAT. Leak emissions during each 3 h time window over the simulation were tagged as separate tracers to allow for independent scaling by the inversion (Fig. S1 in the Supplement). Figure 4 shows the TOMCAT column-averaged CH4 at 08:30 UTC, the approximate IASI overpass time over the plume.
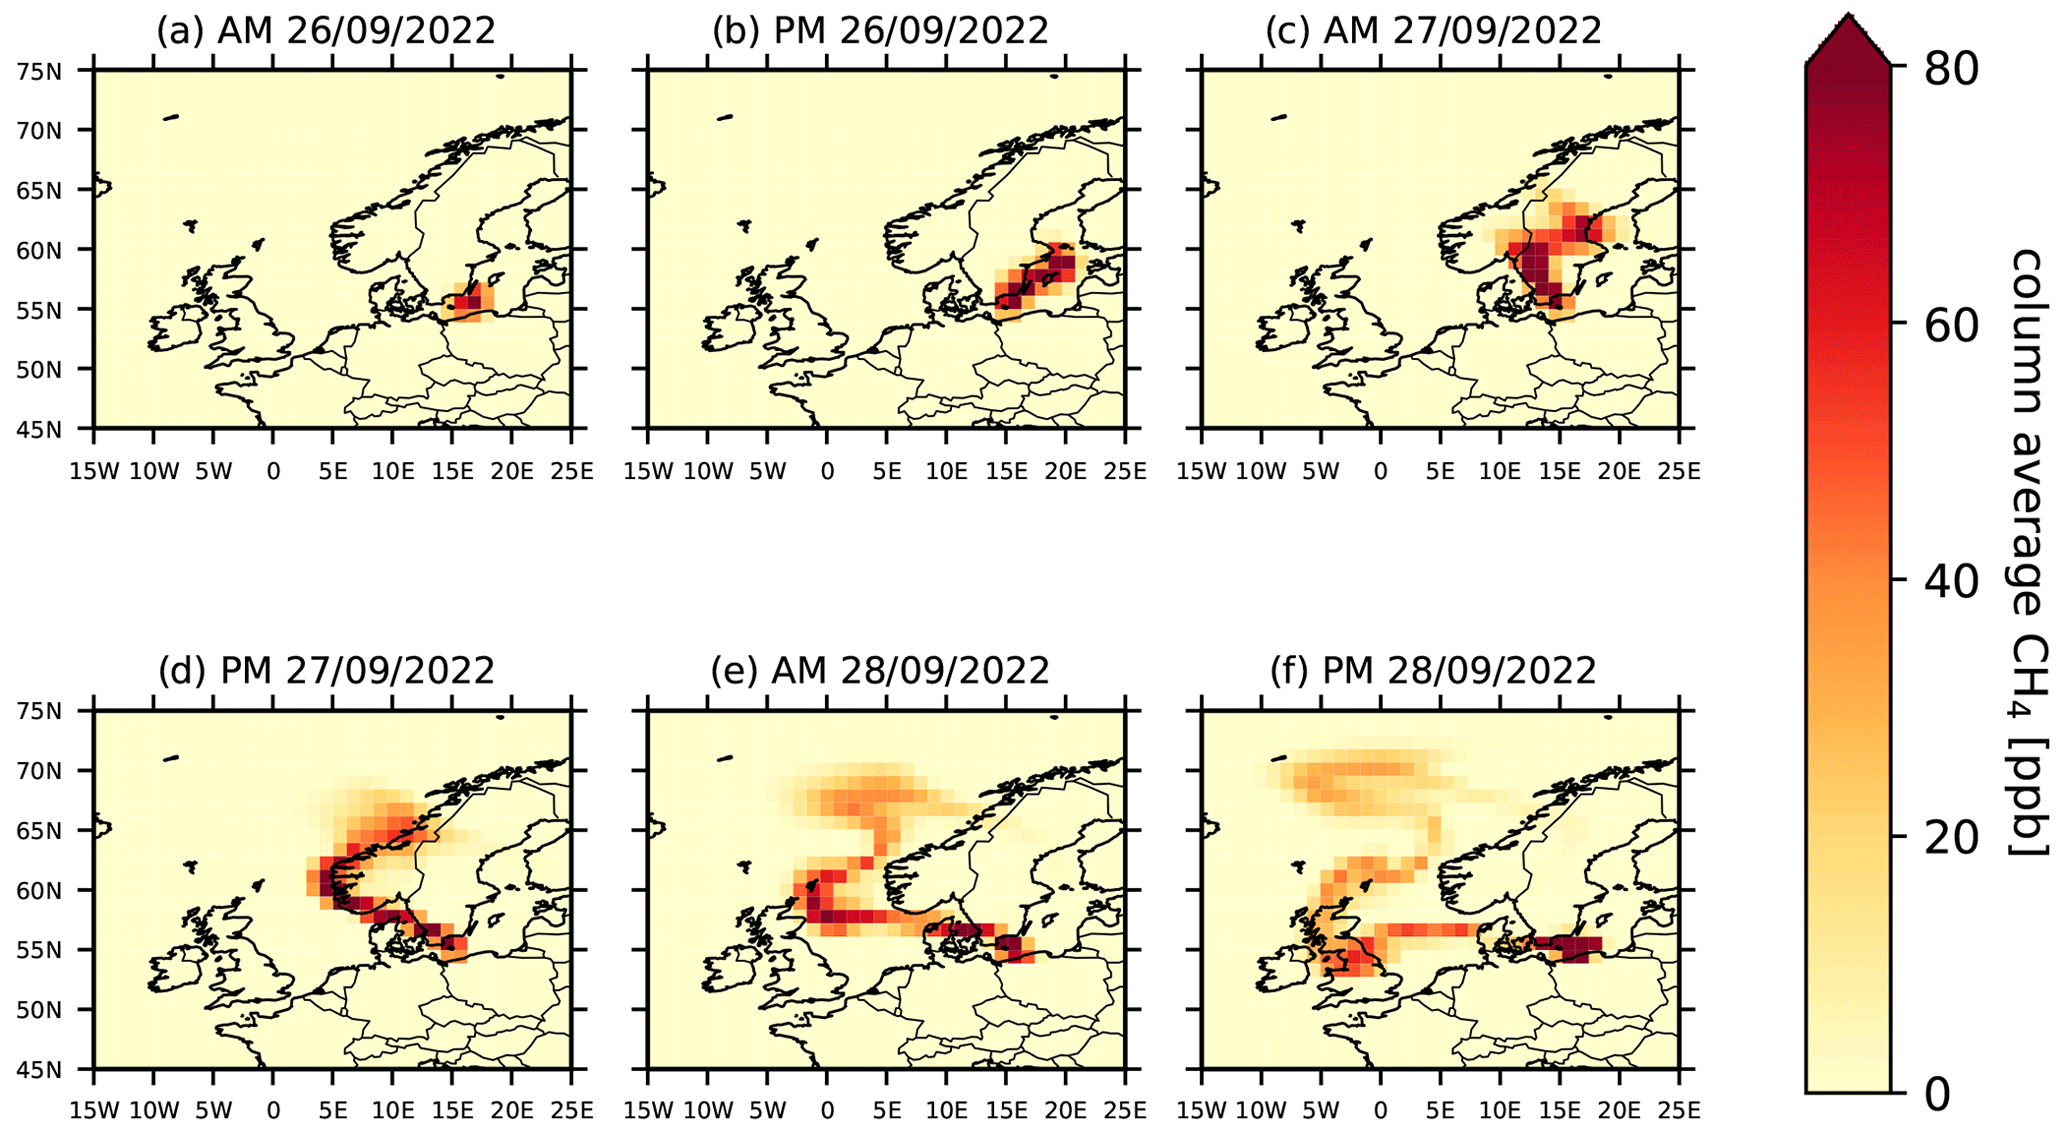
Figure 4Simulated TOMCAT column average CH4 (ppb) from Nord Stream gas leaks for 26–28 September 2022. Background CH4 and emissions from sources other than Nord Stream are not included. Output times are matched to IASI local overpass times, but IASI averaging kernels have not been applied. Column averages are displayed on the model grid with a horizontal resolution of 1.125° × 1.125°. Emission rates from the leaks are constant at 4.17 Gg h−1, totalling 300 Gg over the 3 d.
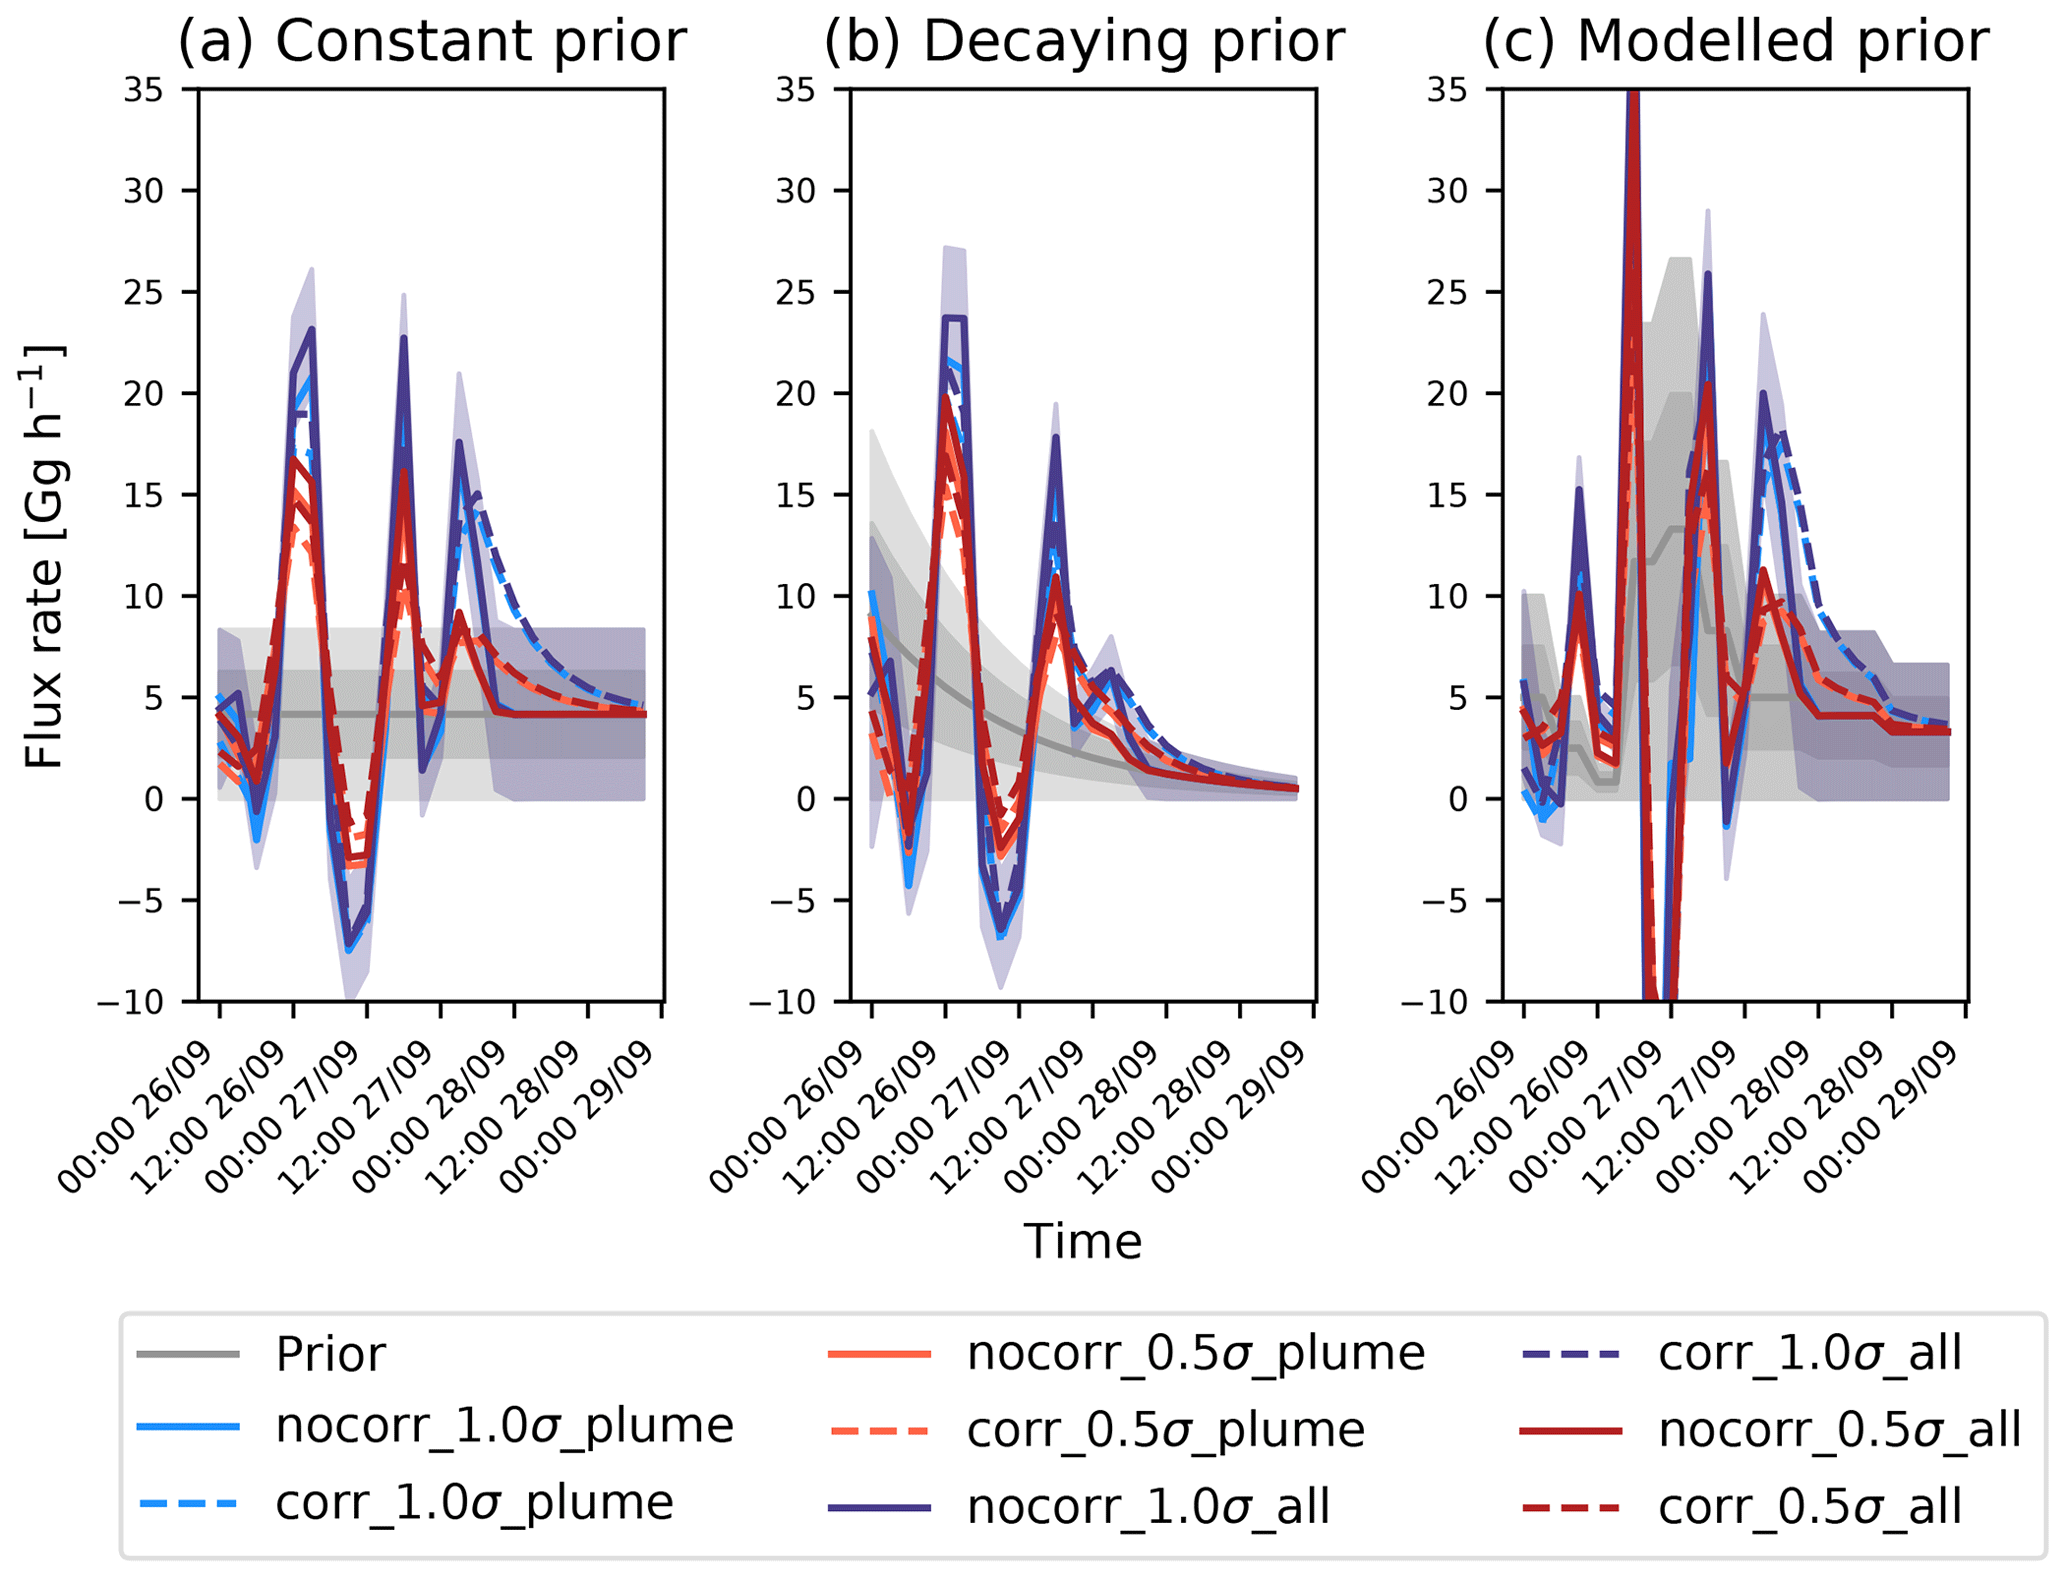
Figure 5Prior and posterior CH4 flux rates ( Gg h−1) over the first 3 d (26–28 September) of the Nord Stream leaks based on IASI data from the morning of 28 September 2022. Prior flux rate is shown in grey, with the dark-grey-shaded region showing the 50 % prior uncertainty and the light-grey-shaded region showing the 100 % prior uncertainty. Dashed lines show posterior inversions with prior temporal correlations imposed, solid lines show those without prior correlations. Blue lines show inversions with 100 % prior uncertainty imposed, red lines show those with 50 % prior uncertainty. Darker shades show inversions based on all available IASI data; lighter shades show inversions based only on IASI data from near the plume, in the region highlighted in Fig. 6. The shaded blue region shows the posterior uncertainty for the “nocorr_1.0σ_all” case.
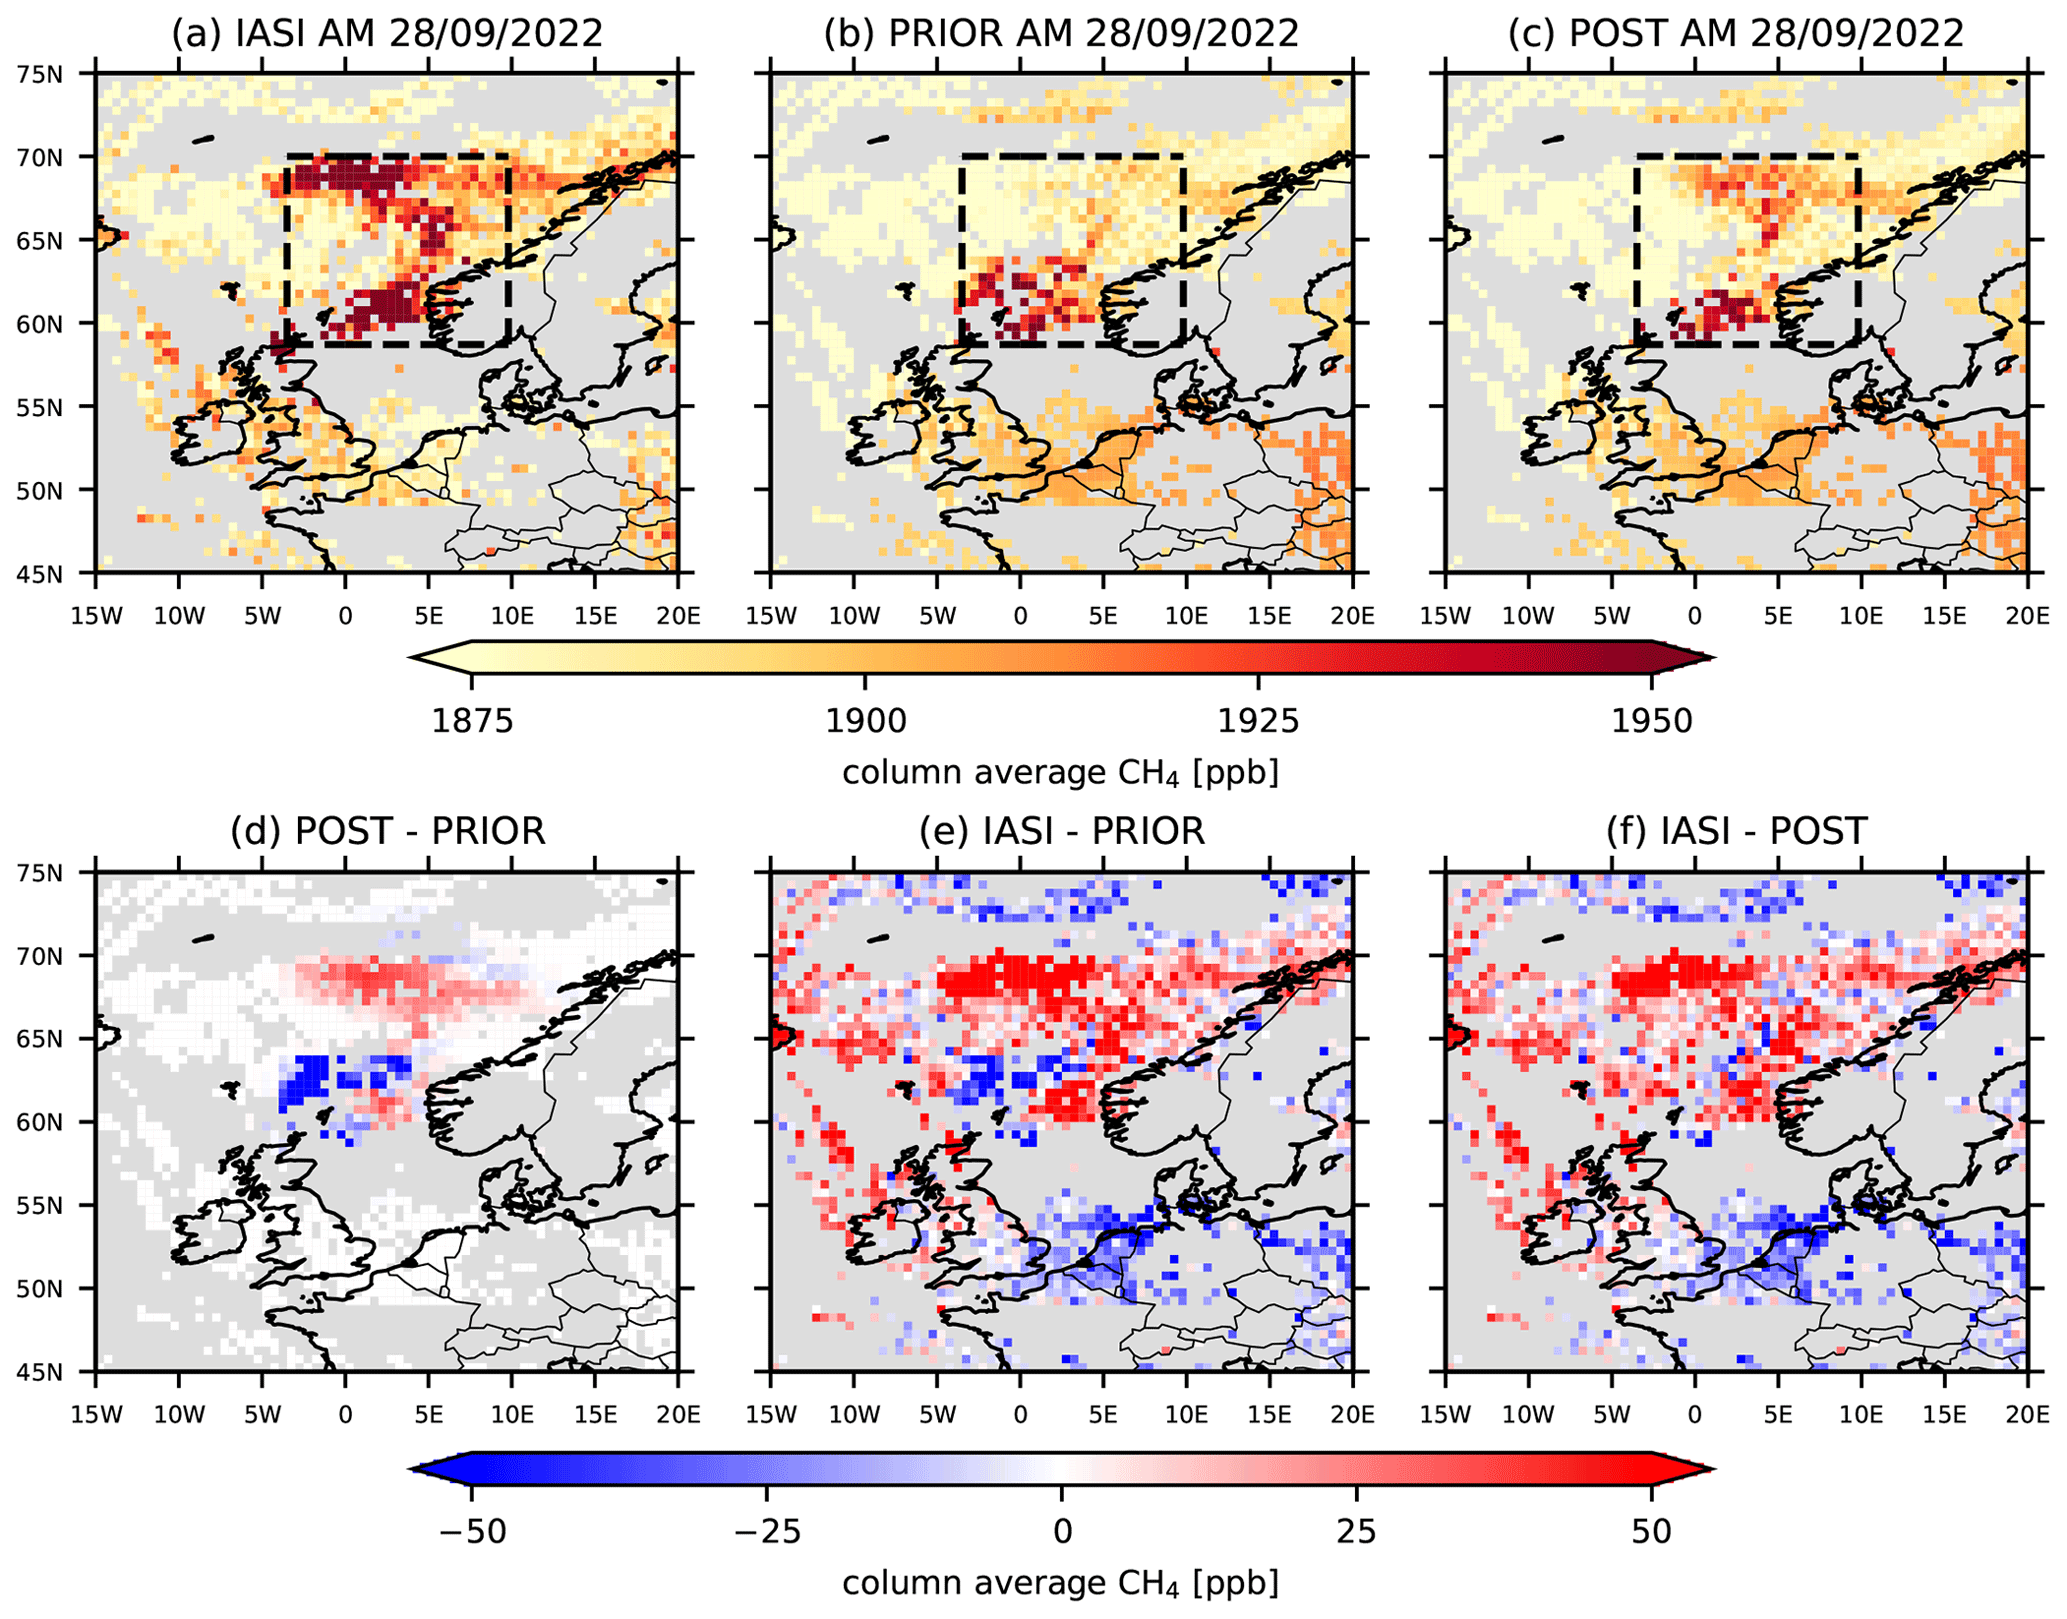
Figure 6Column-averaged CH4 ( ppb) on the morning of 28 September over the region of the Nord Stream gas leaks from (a) IASI, (b) TOMCAT using the constant prior emissions and (c) TOMCAT using the nocorr_1.0_plume posterior emissions based on that prior emissions scenario. Also shown is the difference between the model posterior and prior XCH4 using these posterior and prior emissions (d), the difference between IASI and TOMCAT using these prior emissions (e), and the difference between IASI and TOMCAT using these posterior emissions (f). Retrievals and model output are averaged onto 0.25° × 0.25° grid boxes, weighted inversely to the observations' uncertainties. IASI averaging kernels are applied to the TOMCAT output. The dashed black line shows the plume region defined in the text, used for optimising only the regional mean XCH4 value.
We tested three different a priori (prior) emission rate distributions. The first was a constant release rate of 4.17 Gg h−1 (4170 t h−1) over the 3 d, emitting 300 Gg (300 000 t) in total over this time. This value was chosen based on our initial test simulations and inversions (e.g. NCEO, 2022) and on the results of previous studies (Jia et al., 2022). Additionally, this value proved to be a good compromise in producing simulated column mixing ratios approaching those seen IASI whilst not straying too far from the ICOS-observed values. The second distribution was an exponential decay with an e-folding lifetime of 24 h, scaled to emit the same total CH4 over the 3 d. The third distribution was taken from the results of a flow model described in Poursanidis et al. (2024). The flux rate derived in that work is based on the observed pressure change in the pipelines, the physical dimensions and depths of the pipes, and various other factors. These prior emission rates are shown in Fig. 5. We refer to these as the “constant prior”, the “decaying prior” and the “modelled prior” throughout this text. Although we scaled the constant and decaying priors to emit a total of 300 Gg CH4 over the 3 d, the modelled prior was not scaled from the values provided in Poursanidis et al. (2024), emitting approximately 400 Gg CH4 over the 3 d. The temporal variance of the modelled prior is closest to the most likely case, where the bulk of the emissions occurred after the NS1 leaks began on the evening of 26 September.
We carried out Bayesian inversions based on analytical calculation of an a posteriori (posterior) leak emission rate based on finding the minimum of a cost function as in Tarantola and Valette (1982). We optimised the mean flux from the leak locations for each 3 h window throughout the simulation and the mean background XCH4, giving 25 optimised values in total. The mean background XCH4 was given a prior uncertainty of 1 %, equal to approximately 18 ppb, and was changed very little by the inversion. All other sources and sinks were kept unchanged. We assimilated only the data from the morning of 28 September (Fig. 2e) since this overpass detected the most coherent and extensive observation of the plume. We assimilated either all observations made that morning (3980 individual retrievals, denoted all) or retrievals only within the region bounded by the longitudes 3.5° W and 9.8° E and the latitudes 58.7 and 70.0° N, the region that contained the main mass of the plume on the morning of 28 September (905 individual retrievals, denoted plume; see Fig. 6a for region definition). The AK associated with each IASI sounding was applied to the corresponding TOMCAT methane profile. Due to the small number of variables that we optimise and the relatively small number of observations included, the posterior solution can be solved for directly, as has been done previously using TOMCAT (e.g. McNorton et al., 2018; Claxton et al., 2020). See Supplement and those references for more detail of the inversion method.
We tested both the assumption that the Gaussian emission uncertainties during each 3 h window were uncorrelated with each other (nocorr) and that consecutive emission windows had uncertainties with correlations of 0.7 (corr). This value was chosen in order to impose a fairly strong correlation between emission windows but proved to have little impact on results during emission windows that were well-constrained by observations (See Fig. 5). We tested prior uncertainties of both 100 % and 50 % (denoted 1.0σ and 0.5σ). Additionally, instead of optimising against the full set of individual IASI retrievals, we tried optimising only the single mean XCH4 value within the bounded region described above (denoted regional mean), and finally we optimised against mean XCH4 values at a 3° × 3° horizontal resolution (see Supplement). These simulations were intended to account for discrepancies between the simulated location of the plume compared to the observed location due to transport errors. In total we therefore carried out 48 different inversions based on different prior emission distributions, sets of assimilated data and assumptions regarding prior uncertainties (see Table S2 in the Supplement for details of the inversions). In all inversions, the uncertainty in the retrievals was set at 30 ppb, and the retrievals were assumed to be uncorrelated with each other. This value is more conservative than the estimated individual IASI sounding uncertainty (∼ 20 ppb), in order to attempt to account for uncertainties from the model transport. We applied the IASI averaging kernels to represent the satellite's vertical sensitivity in the simulated column average values. The matrices were inverted using lower–upper (LU) decomposition methods.
For comparison of our results with the ICOS CH4 observations, we interpolate the simulated prior or posterior mixing ratios from all tracers to the corresponding latitude, longitude and inlet heights of the ICOS sites before adding them together to produce simulated time series of CH4 at each of the four sites. At each site, we compared these time series to the observational data obtained at the highest inlet height available to attempt to reduce the influence of boundary layer mixing.
4.1 Integrated mass enhancement (IME) results
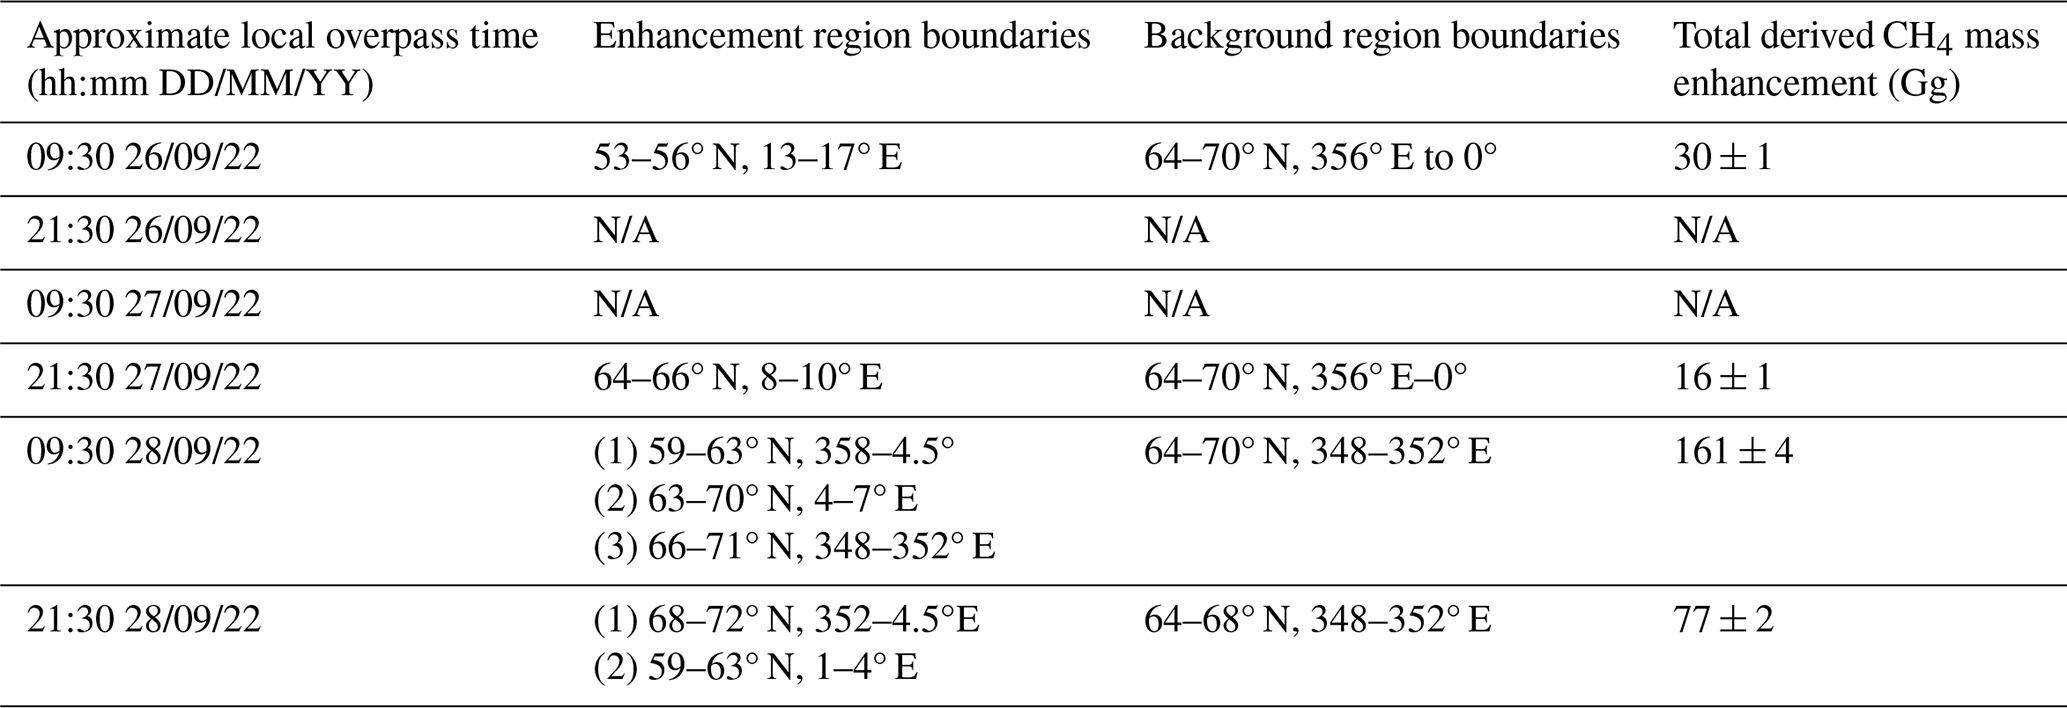
The IME method yielded various total mass estimates for each of the overpass times during the first 3 d of the leak. The results are shown in Table 1. The first estimate of 30 ± 1 Gg CH4 is from an overpass that occurred only a few hours after the first leak began. Assuming that the leak commenced at 02:00 LT and that IASI was able to view most of the leaked CH4 during this overpass, this implies a mean emission rate of ∼ 4 Gg h−1 during that time. However, many nearby areas were obscured by cloud, so it is likely that IASI could not view all of the CH4 emitted during these initial hours. The estimate at this time is therefore likely to be an underestimate of the total CH4 release.
No plume was visible for the next 36 h before what was quite likely only a partial view of the plume obtained on the evening of 27 September on the west coast of Norway. The total CH4 mass within the small observed section of this plume was 16 ± 1 Gg, the low value likely due to much of the plume being obscured by cloud. A very clear view of the plume, which by this point was beginning to split into northern and southern sections, on the morning of 28 September yielded an inferred total of 161 ± 4 Gg of CH4. Finally, a total enhancement of 77 ± 2 Gg was calculated for the evening of 28 September.
Analysis of these values is complex for two reasons. First, the effect of the IASI instrument's vertical sensitivity through application of AKs has not been taken into account. The consequences of this are hard to quantify as they depend on the vertical sensitivities of IASI within both the plume and the background regions and the actual vertical distribution of the CH4 within the column in those regions. Using the TOMCAT model to compare the total column values in the plume with and without the AKs applied indicates that the error due to this effect may be up to 4 % of the total column value and 37 % of the mass enhancement value, although this relies on the accuracy of the model's vertical transport. Second, it is possible and on some overpasses likely that not all of the CH4 emitted from the leak was viewed by the satellite, which would introduce a negative bias into the results. It is clear that for the majority of the IASI overpasses, at least some part of the plume is unfortunately obscured by cloud. The only clear view of the plume is obtained on the morning of 28 September, as confirmed by the TOMCAT simulations. We therefore suggest that the IME-related estimates from the other overpasses are likely to be underestimates of the total CH4 released by Nord Stream, and we base any conclusions on the estimate obtained on the morning of 28 September.
Table 1Integrated mass enhancement (Gg CH4) calculated from the Nord Stream plume observed by IASI over 3 d in September 2022. Also included are the defined enhancement region and background region boundaries. Overpass times with “N/A” are for overpasses when the satellite's view of the CH4 plume was totally obscured by cloud.
4.2 Inversion results
Figure 4 shows the development of the simulated Nord Stream plume in the TOMCAT model over the first 3 d of the leak, assuming constant emission rates during this time. The plume initially moves northwards and eastwards during the first day. Over the following 2 d the plume is transported rapidly westwards across Sweden and Norway before emerging over the North Sea at a similar time and location as was indicated by the satellite observations. The plume becomes quite diffuse by the evening of 28 September.
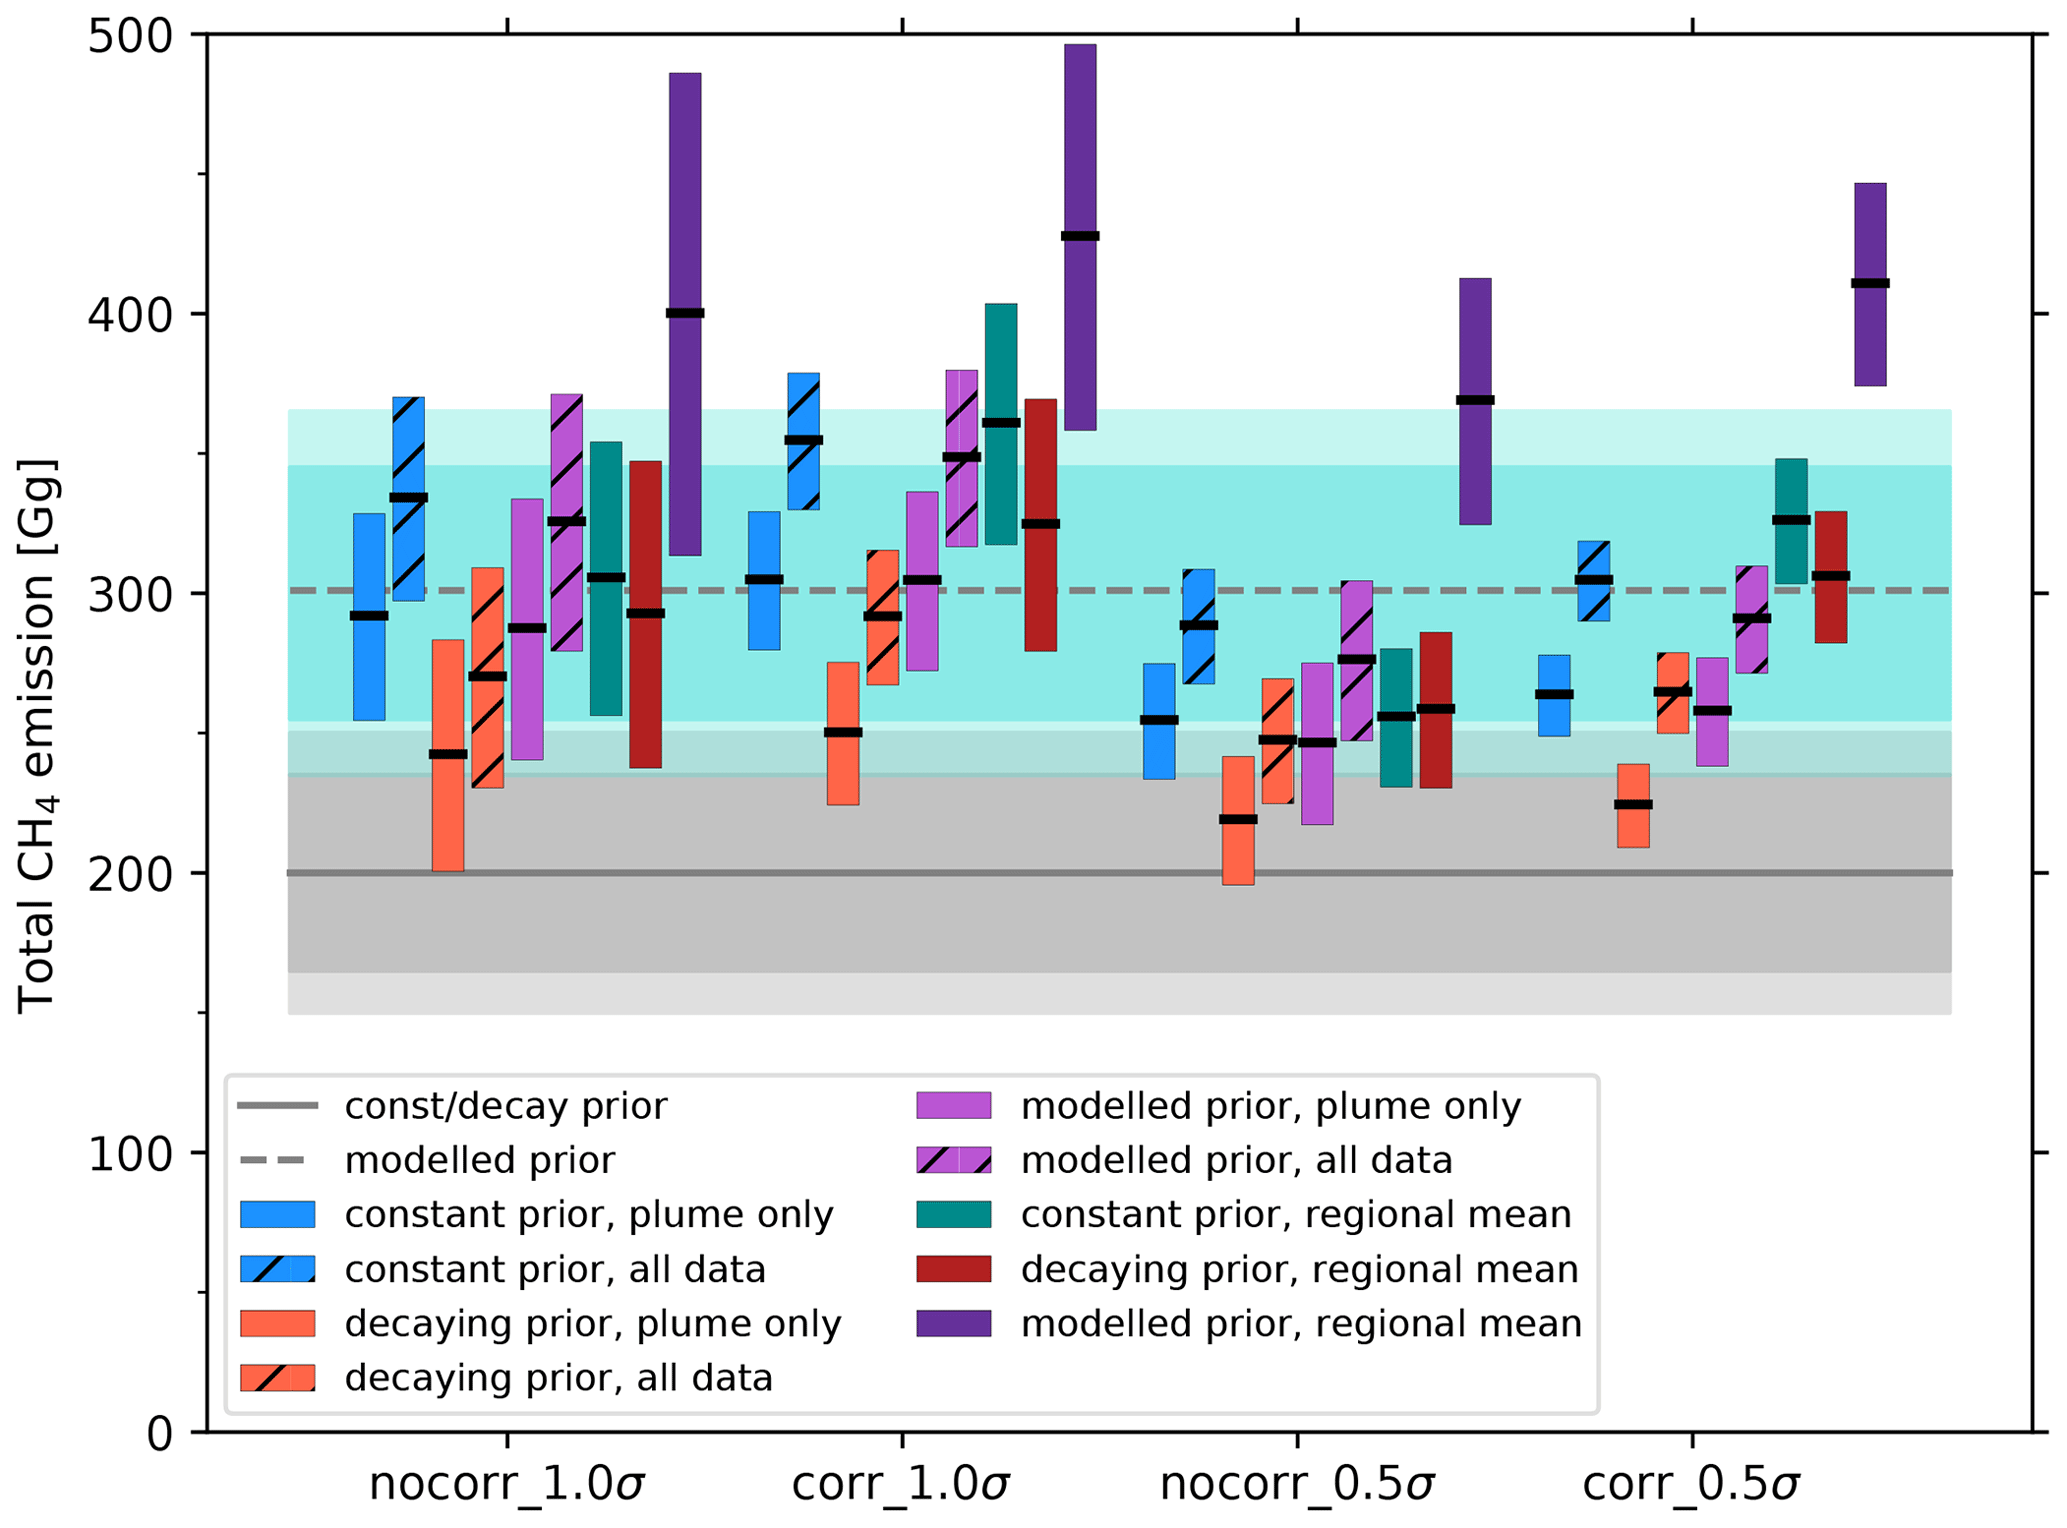
Figure 7Total (2 d) posterior CH4 emissions (Gg) from the Nord Stream leaks during 26–27 September based on multiple different IASI-based inverse modelling calculations. Boxes represent the 1σ uncertainty in each inversion, with each thick horizonal black line representing the mean. Blue boxes represent inversions with the constant prior emission scenario where the model is optimised against individual IASI retrievals, whilst orange boxes are the same but for the decaying prior emission scenario and pink are for the modelled prior emission scenario. Teal boxes represent inversions with the constant prior emission scenario where the model is optimised against the mean XCH4 in the plume region, whereas red boxes are the same but for the decaying prior emission scenario and purple for the modelled prior emission scenario. Hatched boxes show inversions in which all IASI data are included, and unhatched boxes show inversions in which retrievals only within the plume region are included. “Corr” and “nocorr” refer to inversions with and without prior temporal correlations included, whilst 1σ and 0.5σ refer to inversions with 100 % and 50 % prior uncertainty. The solid grey line shows the prior emission total for the constant and decaying prior emission scenario, with 50 % and 100 % 3 h prior uncertainty shaded in dark and light grey, respectively. The dashed grey line shows the modelled prior emission scenario, with 50 % and 100 % 3 h prior uncertainty shaded in dark and light turquoise, respectively.
The prior emissions in both the constant and decaying configurations underestimate the observed XCH4 in the plume region on the morning of 28 September (Figs. 6 and S2–S4 in the Supplement). The simulated location of the northern section of the plume is also slightly east of the observed location. Using the modelled prior, high XCH4 values like those observed by IASI are produced but in an inaccurate location, to the south and west of the observed plume (Figs. S5 and S6 in the Supplement). These discrepancies are likely due to a combination of underestimation of the initial leak rate, errors in the timing of the peak emissions in the prior and model transport errors. It is possible that the meteorological analyses used in the model and the vertical mixing parameterisation in TOMCAT combine to produce small errors in the simulated plume position. Figure 7 shows the total posterior emissions over the first 2 d of the leaks. In all cases, the posterior emissions are larger than 200 Gg produced by the constant and decaying prior emissions. We report totals for only the first 2 d, as the observations provided by IASI on the morning of 28 September do not constrain emissions on the third day. The mean posterior emission total for these 2 d is 299 ± 50 Gg (here the reported uncertainty represents the standard deviation across the mean posterior values). The mean posterior total is 280 ± 35 Gg when omitting the regional mean inversions where only the mean CH4 value is optimised. These values are close to the value used in the modelled prior based on the work by Poursanidis et al. (2024), indicating that their model provides a good overall estimate of the flux totals. However, there is significant variation in the individual posterior totals, which range between 219 ± 23 and 427 ± 69 Gg depending on the assumptions made (here the uncertainty represents the derived posterior uncertainty from the individual inversion). Total posterior emissions are consistently smaller when applying the decaying prior than with the constant or modelled priors. Using the modelled prior, emissions larger than 400 Gg are derived when only the regional mean is optimised. When optimising using the 3° × 3° average XCH4, posterior results are consistent with the other methods, ranging from 211 to 294 Gg (see Table S1 in the Supplement).
When the inversion optimises the model using the individual IASI retrievals for the constant and decaying priors, the position of the northern section of the plume is improved (moved further west), similar to the observations (Figs. 6 and S2–S4), and simulated XCH4 is increased. However, the XCH4 still remains lower than the observed values. When the regional mean is optimised, the magnitudes of the simulated XCH4 values are much improved, but the position of the largest values is not improved relative to the IASI observations. Using the modelled prior and optimising against the individual retrievals increase the XCH4 in the northern section of the plume. However, when optimising against the regional mean, the posterior plume location remains too far south and west. The remaining errors in the model representation of the plume are likely due to (i) errors in the ECMWF meteorological data, which might be improved through use of reanalyses rather than the operational analyses; (ii) biases in the model transport parameterisations, particularly for vertical mixing, leading to incorrect simulated vertical distribution of the plume; and (iii) uncertainties produced due to the instantaneous mixing of the leak emissions across model grid boxes.
The 3 h posterior emission rates display significant variation over the first 2 d of the leaks (Fig. 5). When the constant or decaying priors are used, there are three peaks in the posterior flux rates – the first during the early afternoon on 26 September and two more smaller peaks during the morning and afternoon of 27 September. Using the modelled prior produces four peaks. There are low emission rates between these times. This temporal variation is consistent across all inversions, including, to some extent, when only the regional mean XCH4 is optimised (Fig. S5). The posterior emissions are far outside of the prior uncertainty during peak flux rates and, in fact, are below zero during the night of 26 September. This negative flux is also suggestive of model transport errors or biases in the background concentration. Unless temporal error correlations are included for the prior flux in an inversion, emissions during the third day are not constrained.
Figure 3 includes the CH4 mixing ratios observed at the four ICOS sites for 26–29 September and the prior and posterior model values at those locations. The largest observed CH4 enhancements above the background concentrations were at BIR (∼ 770 ppb), with enhancements of ∼ 340 ppb at NOR and HTM and much smaller enhancements of less than 60 ppb at UTO. The prior model simulations are close to the observations at UTO. At BIR, the peaks in the prior simulations occur around 3 h too early. The constant and decaying priors underestimate the magnitude of the peak CH4, whilst the modelled prior overestimates the magnitude. The timing of the peak in the prior simulation at NOR is similarly early, and the magnitude is 200–700 ppb too high for the constant and decaying priors but captured well by the modelled prior. Finally, the model performance at HTM is poor, with very large simulated values, likely due to the site's location relative to the model grid boundaries and the fast spreading of the leak emissions, both of which lead to excessive influence from CH4 directly from the leaks. The performance of the IASI-based posterior emissions at the ICOS sites is mixed. Peak CH4 at each site has generally remained the same or increased. Posterior values at HTM have significantly increased, whilst performance at UTO has changed little. The posterior performance is improved at BIR, both in terms of the timing and magnitude of the peak, but at NOR, the posterior peaks remain much too large.
The range of estimates from both of the methodologies that we applied to estimate the total CH4 emitted from the Nord Stream leaks using IASI retrievals of XCH4 produced values greater than 200 Gg, with some estimates reaching more than twice that value. A leak of this magnitude is by far the largest individual anthropogenic leak of CH4 into the atmosphere on record, at least twice as large as the previous largest emission event in Aliso Canyon, California, in 2015–2016 (97 Gg; Conley et al., 2016). That leak was from a ruptured injection well pipe at a gas storage facility near Los Angeles and continued for more than 3 months.
The magnitude of the Nord Stream leaks is highly significant on a global scale – when considered over a short period. According to Saunois et al. (2020), total global CH4 emissions from fossil fuels amounted to 108 Tg (top-down estimate) or 135 Tg (bottom-up estimate) in the year 2017, approximately 300–370 Gg d−1. Our mean estimate from the Nord Stream leaks over 2 d is therefore approximately equivalent to an extra day's emissions from global fossil fuel sources (although it should be noted that daily emissions are likely larger today than they were in 2017). However, in the context of annual anthropogenic CH4 emissions (∼ 364 Tg yr−1), the Nord Stream leaks contributed only an extra 0.08 % and increased the annual global total CH4 emissions from all sources (∼ 600 Tg yr−1) by just 0.05 %. Chen and Zhou (2023) calculated that a leak from Nord Stream of magnitude 220 Gg would have a negligible warming effect on the climate (1.8 × 10⁻⁵ °C over a 20-year period), and our larger emission estimates would have a correspondingly small effect.
IASI had its best view of the plume during the morning of 28 September 2022, and we base our best estimate of the total CH4 leaked to the atmosphere during the preceding 2 d on the observations made at that time. Our IME method produced a value of 161 ± 4 Gg CH4 from those retrievals, whilst our TOMCAT inversion results produced a range of 219–427 Gg, with a mean of 280 ± 35 Gg when optimising the model based on comparisons to individual retrievals. The consistency between the results produced using the two methods is therefore poor, with the IME value approximately 40 % smaller than the inversion mean. This is likely due in part to the fact that the IME method does not take into account IASI's vertical sensitivity, with results being affected by up to 37 % by this. The effect of missing IASI data due to cloud cover on the estimated IME value (and to a lesser extent, on the inversions) is also difficult to quantify. It should be noted that the posterior XCH4 produced by TOMCAT is in most cases still underestimated compared to the IASI observations, indicating that some posterior estimates may be underestimates.
We investigated the vertical structure of the simulated plume, together with the vertical sensitivity of XCH4 retrievals based on the IASI AKs (Fig. S6). This shows that the northern and southern sections of the plume during the morning of 28 September (defined as 66–71° N, 355–6° E and 59–63° N, 0–7° E, respectively) have different vertical structures in the model. The northern section has high near-surface CH4 mixing ratios from the leaks, which remain relatively constant with altitude before decreasing until there is no influence from Nord Stream above 500 hPa (∼ 5.5 km). In this case, the majority of the leak-related CH4 is located beneath the peak IASI vertical sensitivity indicated by the AKs. Meanwhile, in the southern section, the CH4 contribution from the leak is smaller but peaks higher up, at approximately 600 hPa (∼ 4 km), around the same region as the peak satellite sensitivity. If the vertical distributions produced in the model are correct, this indicates that the observed XCH4 in the northern and southern sections of the plume, whilst displaying similar XCH4 values, are in fact due to very different relative CH4 contributions within the column. If the simulated vertical distributions are correct, it is likely that the IME method underestimates the CH4 mass in the northern section of the plume whilst overestimating it in the southern section.
The interpretation that the inversion-derived values are low is complicated by the performance of the posterior simulations at the ICOS site locations (Fig. 3). The high values observed at BIR are captured well in the posterior, but the model overestimates observed values significantly at NOR. This is also true when using the prior emissions, however, indicating that model performance might not be accurate at NOR. In the model, the HTM site is located in a grid box next to the one into which the Nord Stream CH4 is emitted, and the comparison there is likely negatively and unrealistically affected by this. In fact, an inversion based only on assimilating the ICOS observations without the IASI data produces a much smaller posterior total emission (88 ± 13 Gg, Fig. S7 in the Supplement). We hypothesise that our Eulerian model's representation uncertainty is large when simulating the movement of a large, distinct plume over fixed point measurement locations, especially at the resolution used here. In addition, the model's representation of the detailed vertical structure of the plume is key for such comparisons. The use of a high-resolution regional model, a nested grid or a Lagrangian model might produce better comparisons at the ICOS sites.
Our IASI-based estimates are consistently larger than estimates produced by others using different observational datasets. Previous estimates issued by our team and by other groups were produced quickly in the weeks immediately following the leaks, and we have here attempted to probe the sensitivity of our results to chosen methodologies and assumptions about the leaks and observational data. Based on ICOS observations, satellite-based imaging spectrometer data and multiple Lagrangian models, Jia et al. (2022) calculated a total flux of 220 ± 30 Gg CH4 over 3 d of leaks, which itself was larger than many estimates published by various groups using a range of methods and datasets (CAMS, 2022; NILU, 2022; UNEP and IMEO, 2023). The temporal variation in emissions produced by Jia et al. (2022) showed some similarity to our own results, with the peak emission rate occurring during the night of 26–27 September, more than 24 h after the first of the leaks began but only a few hours after three of the four leaks started. They also computed the mass of CH4 that was released from the pipelines based on pipeline dimensions and the change in gas pressure within the pipes, calculating a value of 230 Gg. This value, along with their calculated emission value, is smaller than the majority of our emission estimates, although a subset of our results is consistent with their value. It remains important to investigate the roots of the apparent discrepancies between our IASI-derived estimates and those produced via other means.
The resolution used by TOMCAT in this case (approximately 1° × 1°) is fairly coarse for capturing the movement of the plume over the ICOS sites, and results will be affected by the artificial instantaneous spreading of the point source emissions over the comparatively large model grid cells. The coarse resolution likely has less impact on the model–satellite comparisons overall, however. We can employ Eulerian models with higher resolution and/or Lagrangian plume models to attempt to better represent the plume's distribution in comparison with IASI. The effect of the meteorological data used in the models can also be assessed through the use of reanalyses from ECMWF or other meteorological datasets. The operational meteorological analyses used here are updated by ECMWF during reanalysis through assimilation of satellite and in situ observations, which might result in better consistency between the simulated and observed plumes. The uncertainty induced by the emission inventories should be small compared to the observed plume-related concentrations during a short simulation such as this one, but the initial conditions could introduce biases between the model and satellite. We attempt to account for this through inclusion of the background XCH4 in the inversion state vector, but further investigation into the effect of the initial conditions is warranted. In addition, investigation into the model's representation of plume uplift above the CH4 release to the atmosphere might be a key uncertainty, since it determines layer height and therefore the horizontal wind field to which the simulated plume is exposed.
We have produced the first clear satellite retrievals of column-averaged methane that capture the CH4 emitted into the atmosphere from the Nord Stream gas leaks in late September 2022. The IASI instrument onboard the satellite MetOp-B produced retrievals displaying strongly enhanced XCH4 at the leak locations on the morning of 26 September before large widespread enhancements were seen over the North Sea during 28 September. The satellite data retrieved for that day allowed us to employ two methods to quantify the CH4 leaked into the atmosphere from the Nord Stream leaks during the first 2 d.
Our integrated mass enhancement calculations produced total emissions of 161 ± 4 Gg CH4, although this method cannot take account of the satellite instrument's vertical sensitivity, which peaks in the middle–upper troposphere, and cannot account for regions of enhanced CH4 that are not observed due to clouds. We also used formal Bayesian inversion methods, using the TOMCAT atmospheric chemical transport model, to quantify the emissions based on the observations made on the morning of 28 September. This is the first time that plume flux inversions have been carried out using thermal infrared satellite data. Here, we investigated the effect of a range of assumptions within the inversion, including the prior distribution of the emissions, the related prior uncertainties and the way that observations are assimilated. We calculated total emissions between 219 and 427 Gg. The mean over all inversions is approximately 299 ± 50 Gg, whilst the mean over the inversions that optimise against individual IASI retrievals is 280 ± 35 Gg. All of our results imply that the Nord Stream leaks were by far the largest-recorded individual anthropogenic leak of CH4 into the atmosphere.
Our estimates are larger than previous values given for the Nord Stream leaks, produced using alternative observational data. There is variable performance when comparing our posterior results to in situ observations made in the region, and more work is necessary to discern to what extent this is due to errors in the flux estimates produced from the satellite data and how much is due to poor model plume representation at some tall tower locations. Our ability to monitor, simulate and quantify leaks of GHGs and pollution events such as this one is continuously improving, aiding our ability to mitigate the human influence on the atmosphere. It is also clear from this study that thermal infrared instruments such as IASI, which have peak sensitivity high in the troposphere, are able to provide more information concerning surface events such as the Nord Stream leaks than might have been appreciated previously. In any case, whilst this particular event remains highly significant locally over a short time period, the effect of these emissions by themselves is very small in terms of both the global atmospheric CH4 budget and the climate.
MetOp-B IASI methane observations up to March 2021 are available from the Centre for Environmental Data Analysis (CEDA) long-term data archive (https://doi.org/10.5285/4bbcb1722f2842c1b0a5ebc19160a863, Knappett et al., 2022). More recent data, including the near-real-time (NRT) data for the period covering the Nord Stream leaks, are viewable through the public visualisation tool (http://rsg.rl.ac.uk/vistool, RAL Space, 2024). NRT data are available by contacting the authors. The TOMCAT model output for this period is available from 19 September 2024 on the Centre for Environmental Data Analysis (CEDA) long-term data archive at https://doi.org/10.5285/e41965a32923498396fd8a8446f066f1. The ICOS methane concentrations were downloaded from the ICOS Carbon portal (https://data.icos-cp.eu/portal/, ICOS, 2024).
The supplement related to this article is available online at: https://doi.org/10.5194/acp-24-10639-2024-supplement.
CW, BJK and JJR conceptualised the study. BJK, RS and LJV produced the satellite data. CJW, DPM, ED, WF and MPC carried out data analysis and modelling. All co-authors contributed to the design of the study and to writing the paper.
At least one of the (co-)authors is a member of the editorial board of Atmospheric Chemistry and Physics. The peer-review process was guided by an independent editor, and the authors also have no other competing interests to declare.
Publisher's note: Copernicus Publications remains neutral with regard to jurisdictional claims made in the text, published maps, institutional affiliations, or any other geographical representation in this paper. While Copernicus Publications makes every effort to include appropriate place names, the final responsibility lies with the authors.
The IASI retrievals were produced using JASMIN, the UK collaborative data analysis facility, at the Rutherford Appleton Laboratory. The TOMCAT model simulations were carried out using ARC4, part of the high-performance computing facilities at the University of Leeds, UK. EUMETSAT provided data for MetOp-B IASI, MHS and AMSU-A, and ECMWF provided the meteorological data used in the NRT processing system and TOMCAT simulations. We thank ICOS PIs for providing their methane concentration data.
This research has been supported by the UK Natural Environment Research Council, National Centre for Earth Observation (grant nos. NE/R016518/1 and NE/N018079/1).
This paper was edited by Rolf Müller and reviewed by Rona Thompson and one anonymous referee.
Bloom, A. A., Bowman, K. W., Lee, M., Turner, A. J., Schroeder, R., Worden, J. R., Weidner, R., McDonald, K. C., and Jacob, D. J.: A global wetland methane emissions and uncertainty dataset for atmospheric chemical transport models (WetCHARTs version 1.0), Geosci. Model Dev., 10, 2141–2156, https://doi.org/10.5194/gmd-10-2141-2017, 2017.
Blumstein, D., Chalon, G., Carlier, T., Buil, C., Hebert, P., Maciaszek, T., Ponce, G., Phulpin, T., Tournier, B., Simeoni, D., Astruc, P., Clauss, A., Kayal, G., and Jegou, R.: IASI instrument: technical overview and measured performances, in: Infrared Spaceborne Remote Sensing XII, Optical Science and Technology, the SPIE 49th Annual Meeting, Denver, Colorado, United States, 4 November 2004, 5543, 196–207, https://doi.org/10.1117/12.560907, 2004.
Buchwitz, M., Schneising, O., Vanselow, S., Houweling, S., van Peet, J., Siddans, R., Kerridge, B., Ventress, L., Knappett, D., Crevoisier, C., Meilhac, N., Borsdorf, T., Lorente, A., and Aben, I.: Methane+ Study Final Report, ESA Contract No. 4000129987/20/I-DT, European Space Agenecy (ESA), https://methaneplus.eu (last access: 17 September 2024), 2023.
CAMS: Copernicus Atmosphere Monitoring Service (CAMS) simulates methane emissions from Nord Stream pipelines leaks, ECMWF, https://atmosphere.copernicus.eu/cams-simulates-methane-emissions-nord-stream-pipelines-leaks (last access: 17 September 2024), 2022.
Chen, X. and Zhou, T.: Negligible Warming Caused by Nord Stream Methane Leaks, Adv. Atmos. Sci., 40, 549–552, https://doi.org/10.1007/s00376-022-2305-x, 2023.
Chipperfield, M. P.: New version of the TOMCAT/SLIMCAT off-line chemical transport model: Intercomparison of stratospheric tracer experiments, Q. J. Roy. Meteor. Soc., 132, 1179–1203, https://doi.org/10.1256/qj.05.51, 2006.
Claxton, T., Hossaini, R., Wilson, C., Montzka, S. A., Chipperfield, M. P., Wild, O., Bednarz, E. M., Carpenter, L. J., Andrews, S. J., Hackenberg, S. C., Mühle, J., Oram, D., Park, S., Park, M.-K., Atlas, E., Navarro, M., Schauffler, S., Sherry, D., Vollmer, M., Schuck, T., Engel, A., Krummel, P. B., Maione, M., Arduini, J., Saito, T., Yokouchi, Y., O'Doherty, S., Young, D., and Lunder, C.: A Synthesis Inversion to Constrain Global Emissions of Two Very Short Lived Chlorocarbons: Dichloromethane, and Perchloroethylene, J. Geophys. Res.-Atmos., 125, e2019JD031818, https://doi.org/10.1029/2019JD031818, 2020.
Conley, S., Franco, G., Faloona, I., Blake, D. R., Peischl, J., and Ryerson, T. B.: Methane emissions from the 2015 Aliso Canyon blowout in Los Angeles, CA, Science, 351, 1317–1320, https://doi.org/10.1126/science.aaf2348, 2016.
Crippa, M., Solazzo, E., Huang, G., Guizzardi, D., Koffi, E., Muntean, M., Schieberle, C., Friedrich, R., and Janssens-Maenhout, G.: High resolution temporal profiles in the Emissions Database for Global Atmospheric Research, Scientific Data, 7, 121, https://doi.org/10.1038/s41597-020-0462-2, 2020.
Danish Energy Agency: Leak at North Stream 2 in the Baltic Sea, Danish Energy Agency, https://ens.dk/en/press/leak-north-stream-2-baltic-sea (last access: 17 September 2024), 2022.
Dowd, E., Wilson, C., Chipperfield, M. P., Gloor, E., Manning, A., and Doherty, R.: Decreasing seasonal cycle amplitude of methane in the northern high latitudes being driven by lower-latitude changes in emissions and transport, Atmos. Chem. Phys., 23, 7363–7382, https://doi.org/10.5194/acp-23-7363-2023, 2023.
Draxler, R. R. and Hess, G. D.: An overview of the HYSPLIT_4 modelling system for trajectories, dispersion and deposition, Aust. Meteorol. Mag., 47, 295–308, 1998.
European Commission: Joint EU-US Press Release on the Global Methane Pledge, European Commission, https://ec.europa.eu/commission/presscorner/detail/en/IP_21_4785 (last access: 17 September 2024), 2021.
GEUS: GEUS har registreret rystelser i Østersøen (GEUS has registered tremors in the Baltic Sea), De Nationale Geologiske Undersøgelser for Danmark og Grønland, https://www.geus.dk/om-geus/nyheder/nyhedsarkiv/2022/sep/seismologi (last access: 17 September 2024), 2022.
GHGSat: GHGSat measures its largest emission from a single source ever from Nord Stream 2 leak, GHGSat, https://www.ghgsat.com/en/newsroom/ghgsat-nordstream/ (last access: 17 September 2024), 2022.
Hatakka, J., Laurila, T., and ICOS, R.: ICOS Atmosphere Level 2 data, Utö – Baltic sea, release 2023-1, ICOS, https://doi.org/10.18160/9JJC-CDJW, 2023.
Heiskanen, J., Brümmer, C., Buchmann, N., Calfapietra, C., Chen, H., Gielen, B., Gkritzalis, T., Hammer, S., Hartman, S., Herbst, M., Janssens, I. A., Jordan, A., Juurola, E., Karstens, U., Kasurinen, V., Kruijt, B., Lankreijer, H., Levin, I., Linderson, M.-L., Loustau, D., Merbold, L., Myhre, C. L., Papale, D., Pavelka, M., Pilegaard, K., Ramonet, M., Rebmann, C., Rinne, J., Rivier, L., Saltikoff, E., Sanders, R., Steinbacher, M., Steinhoff, T., Watson, A., Vermeulen, A. T., Vesala, T., Vítková, G., and Kutsch, W.: The Integrated Carbon Observation System in Europe, B. Am. Meteorol. Soc., 103, E855–E872, https://doi.org/10.1175/BAMS-D-19-0364.1, 2022.
ICOS: ICOS data portal, https://data.icos-cp.eu/portal/ (last access: 29 July 2024), 2024.
ICOS RI, Apadula, F., Arnold, S., Bergamaschi, P., Biermann, T., Chen, H., Colomb, A., Conil, S., Couret, C., Cristofanelli, P., De Mazière, M., Delmotte, M., Emmenegger, L., Forster, G., Frumau, A., Hatakka, J., Heliasz, M., Heltai, D., Hensen, A., Hermansen, O., Hoheisel, A., Kneuer, T., Komínková, K., Kubistin, D., Laurent, O., Laurila, T., Lehner, I., Lehtinen, K., Leskinen, A., Leuenberger, M., Levula, J., Lindauer, M., Lopez, M., Lund Myhre, C., Lunder, C., Mammarella, I., Manca, G., Manning, A., Marek, M., Marklund, P., Meinhardt, F., Mölder, M., Müller-Williams, J., O'Doherty, S., Ottosson-Löfvenius, M., Piacentino, S., Pichon, J.-M., Pitt, J., Platt, S. M., Plaß-Dülmer, C., Ramonet, M., Rivas-Soriano, P., Roulet, Y.-A., Scheeren, B., Schmidt, M., Schumacher, M., Sha, M. K., Smith, P., Stanley, K., Steinbacher, M., Sørensen, L. L., Trisolino, P., Vítková, G., Yver-Kwok, C., and di Sarra, A.: ICOS Atmosphere Release 2023-1 of Level 2 Greenhouse Gas Mole Fractions of CO2, CH4, N2O, CO, meteorology and 14CO2, and flask samples analysed for CO2, CH4, N2O, CO, H2 and SF6, ICOS, https://doi.org/10.18160/VXCS-95EV, 2023.
Jia, M., Li, F., Zhang, Y., Wu, M., Li, Y., Feng, S., Wang, H., Chen, H., Ju, W., Lin, J., Cai, J., Zhang, Y., and Jiang, F.: The Nord Stream pipeline gas leaks released approximately 220,000 tonnes of methane into the atmosphere, Environmental Science and Ecotechnology, 12, 100210, https://doi.org/10.1016/j.ese.2022.100210, 2022.
Knappett, D., Siddans, R., Ventress, L., Kerridge, B., and Latter, B.: STFC RAL methane retrievals from IASI on board MetOp-B, version 2.0, NERC EDS Centre for Environmental Data Analysis [data set], https://doi.org/10.5285/4bbcb1722f2842c1b0a5ebc19160a863, 2022.
Lauvaux, T., Giron, C., Mazzolini, M., d'Aspremont, A., Duren, R., Cusworth, D., Shindell, D., and Ciais, P.: Global assessment of oil and gas methane ultra-emitters, Science, 375, 557–561, https://doi.org/10.1126/science.abj4351, 2022.
Levin, I., Karstens, U., Eritt, M., Maier, F., Arnold, S., Rzesanke, D., Hammer, S., Ramonet, M., Vítková, G., Conil, S., Heliasz, M., Kubistin, D., and Lindauer, M.: A dedicated flask sampling strategy developed for Integrated Carbon Observation System (ICOS) stations based on CO2 and CO measurements and Stochastic Time-Inverted Lagrangian Transport (STILT) footprint modelling, Atmos. Chem. Phys., 20, 11161–11180, https://doi.org/10.5194/acp-20-11161-2020, 2020.
McNorton, J., Gloor, E., Wilson, C., Hayman, G. D., Gedney, N., Comyn-Platt, E., Marthews, T., Parker, R. J., Boesch, H., and Chipperfield, M. P.: Role of regional wetland emissions in atmospheric methane variability, Geophys. Res. Lett., 43, 11433–11444, https://doi.org/10.1002/2016GL070649, 2016.
McNorton, J., Wilson, C., Gloor, M., Parker, R. J., Boesch, H., Feng, W., Hossaini, R., and Chipperfield, M. P.: Attribution of recent increases in atmospheric methane through 3-D inverse modelling, Atmos. Chem. Phys., 18, 18149–18168, https://doi.org/10.5194/acp-18-18149-2018, 2018.
Monks, S. A., Arnold, S. R., Hollaway, M. J., Pope, R. J., Wilson, C., Feng, W., Emmerson, K. M., Kerridge, B. J., Latter, B. L., Miles, G. M., Siddans, R., and Chipperfield, M. P.: The TOMCAT global chemical transport model v1.6: description of chemical mechanism and model evaluation, Geosci. Model Dev., 10, 3025–3057, https://doi.org/10.5194/gmd-10-3025-2017, 2017.
NCEO: National Centre for Earth Observation: 220,000 tonnes of methane likely released from Nord Stream gas leak, National Centre for Earth Observation, https://www.nceo.ac.uk/article/220000-tonnes-of-methane-likely-released-from-nord-stream-gas-leak/ (last access: 17 September 2024), 2022.
NILU: The Climate and Environmental Research Institute (NILU), Norway: Improved estimates of Nord Stream leaks, NILU, https://www.nilu.com/2022/10/improved-estimates-of-nord-stream-leaks/ (last access: 17 September 2024), 2022.
Pimlott, M. A., Pope, R. J., Kerridge, B. J., Latter, B. G., Knappett, D. S., Heard, D. E., Ventress, L. J., Siddans, R., Feng, W., and Chipperfield, M. P.: Investigating the global OH radical distribution using steady-state approximations and satellite data, Atmos. Chem. Phys., 22, 10467–10488, https://doi.org/10.5194/acp-22-10467-2022, 2022.
Pope, R. J., Kerridge, B. J., Siddans, R., Latter, B. G., Chipperfield, M. P., Arnold, S. R., Ventress, L. J., Pimlott, M. A., Graham, A. M., Knappett, D. S., and Rigby, R.: Large Enhancements in Southern Hemisphere Satellite-Observed Trace Gases Due to the 2019/2020 Australian Wildfires, J. Geophys. Res.-Atmos., 126, e2021JD034892, https://doi.org/10.1029/2021JD034892, 2021.
Poursanidis, K., Sharanik, J., and Hadjistassou, C.: World's largest natural gas leak from nord stream pipeline estimated at 478,000 tonnes, iScience, 27, 108772, https://doi.org/10.1016/j.isci.2023.108772, 2024.
RAL Space: Science and Technology Facilities Coucil, Remote Sensing Group, http://rsg.rl.ac.uk/vistool (last access: 18 July 2023), 2024.
Robson, J., Aksenov, Y., Bracegirdle, T. J., Dimdore-Miles, O., Griffiths, P. T., Grosvenor, D. P., Hodson, D. L. R., Keeble, J., MacIntosh, C., Megann, A., Osprey, S., Povey, A. C., Schröder, D., Yang, M., Archibald, A. T., Carslaw, K. S., Gray, L., Jones, C., Kerridge, B., Knappett, D., Kuhlbrodt, T., Russo, M., Sellar, A., Siddans, R., Sinha, B., Sutton, R., Walton, J., and Wilcox, L. J.: The Evaluation of the North Atlantic Climate System in UKESM1 Historical Simulations for CMIP6, J. Adv. Model. Earth Sy., 12, e2020MS002126, https://doi.org/10.1029/2020MS002126, 2020.
Saunois, M., Stavert, A. R., Poulter, B., Bousquet, P., Canadell, J. G., Jackson, R. B., Raymond, P. A., Dlugokencky, E. J., Houweling, S., Patra, P. K., Ciais, P., Arora, V. K., Bastviken, D., Bergamaschi, P., Blake, D. R., Brailsford, G., Bruhwiler, L., Carlson, K. M., Carrol, M., Castaldi, S., Chandra, N., Crevoisier, C., Crill, P. M., Covey, K., Curry, C. L., Etiope, G., Frankenberg, C., Gedney, N., Hegglin, M. I., Höglund-Isaksson, L., Hugelius, G., Ishizawa, M., Ito, A., Janssens-Maenhout, G., Jensen, K. M., Joos, F., Kleinen, T., Krummel, P. B., Langenfelds, R. L., Laruelle, G. G., Liu, L., Machida, T., Maksyutov, S., McDonald, K. C., McNorton, J., Miller, P. A., Melton, J. R., Morino, I., Müller, J., Murguia-Flores, F., Naik, V., Niwa, Y., Noce, S., O'Doherty, S., Parker, R. J., Peng, C., Peng, S., Peters, G. P., Prigent, C., Prinn, R., Ramonet, M., Regnier, P., Riley, W. J., Rosentreter, J. A., Segers, A., Simpson, I. J., Shi, H., Smith, S. J., Steele, L. P., Thornton, B. F., Tian, H., Tohjima, Y., Tubiello, F. N., Tsuruta, A., Viovy, N., Voulgarakis, A., Weber, T. S., van Weele, M., van der Werf, G. R., Weiss, R. F., Worthy, D., Wunch, D., Yin, Y., Yoshida, Y., Zhang, W., Zhang, Z., Zhao, Y., Zheng, B., Zhu, Q., Zhu, Q., and Zhuang, Q.: The Global Methane Budget 2000–2017, Earth Syst. Sci. Data, 12, 1561–1623, https://doi.org/10.5194/essd-12-1561-2020, 2020.
Siddans, R., Knappett, D., Kerridge, B., Waterfall, A., Hurley, J., Latter, B., Boesch, H., and Parker, R.: Global height-resolved methane retrievals from the Infrared Atmospheric Sounding Interferometer (IASI) on MetOp, Atmos. Meas. Tech., 10, 4135–4164, https://doi.org/10.5194/amt-10-4135-2017, 2017.
Spivakovsky, C. M., Logan, J. A., Montzka, S. A., Balkanski, Y. J., Foreman-Fowler, M., Jones, D. B. A., Horowitz, L. W., Fusco, A. C., Brenninkmeijer, C. a. M., Prather, M. J., Wofsy, S. C., and McElroy, M. B.: Three-dimensional climatological distribution of tropospheric OH: Update and evaluation, J. Geophys. Res.-Atmos., 105, 8931–8980, https://doi.org/10.1029/1999JD901006, 2000.
Szopa, S., Naik, V., Adhikary, B., Artaxo, P., Berntsen, T., Collins, W. D., Fuzzi, S., Gallardo, L., Kiendler-Scharr, A., Klimont, Z., Liao, H., Unger, N., and Zanis, P.: Chapter 6: Short-Lived Climate Forcers, in: Climate Change 2021: The Physical Science Basis. Contribution of Working Group I to the Sixth Assessment Report of the Intergovernmental Panel on Climate Change, edited by: Masson-Delmotte, V., Zhai, P., Pirani, A., Connors, S. L., Péan, C., Berger, S., Caud, N., Chen, Y., Goldfarb, L., Gomis, M. I., Huang, M., Leitzell, K., Lonnoy, E., Matthews, J. B. R., Maycock, T. K., Waterfield, T., Yelekçi, O., Yu, R., and Zhou, B., Cambridge University Press, Cambridge, United Kingdom and New York, NY, USA, 817–922, 2021.
Tarantola, A. and Valette, B.: Generalized nonlinear inverse problems solved using the least squares criterion, Rev. Geophys., 20, 219–232, https://doi.org/10.1029/RG020i002p00219, 1982.
UNEP and IMEO: Estimate of Total Methane Emissions from the Nord Stream Gas Leak Incident – Draft Working Paper, United Nations Environment Programme and International Methane Emissions Observatory, https://wedocs.unep.org/20.500.11822/41838 (last access: 17 September 2024), 2023.
UNFCCC: United Nations Framework Convention on Climate Change Paris Agreement, United Nations Climate Change, https://unfccc.int/process-and-meetings/the-paris-agreement/the-paris-agreement (last access: 17 September 2024), 2015.
van der Werf, G. R., Randerson, J. T., Giglio, L., van Leeuwen, T. T., Chen, Y., Rogers, B. M., Mu, M., van Marle, M. J. E., Morton, D. C., Collatz, G. J., Yokelson, R. J., and Kasibhatla, P. S.: Global fire emissions estimates during 1997–2016, Earth Syst. Sci. Data, 9, 697–720, https://doi.org/10.5194/essd-9-697-2017, 2017.
West, J. J., Fiore, A. M., Horowitz, L. W., and Mauzerall, D. L.: Global health benefits of mitigating ozone pollution with methane emission controls, P. Natl. Acad. Sci. USA, 103, 3988–3993, https://doi.org/10.1073/pnas.0600201103, 2006.
Wilson, C., Gloor, M., Gatti, L. V., Miller, J. B., Monks, S. A., McNorton, J., Bloom, A. A., Basso, L. S., and Chipperfield, M. P.: Contribution of regional sources to atmospheric methane over the Amazon Basin in 2010 and 2011, Global Biogeochem. Cy., 30, 400–420, https://doi.org/10.1002/2015GB005300, 2016.
Wilson, C., Chipperfield, M. P., Gloor, M., Parker, R. J., Boesch, H., McNorton, J., Gatti, L. V., Miller, J. B., Basso, L. S., and Monks, S. A.: Large and increasing methane emissions from eastern Amazonia derived from satellite data, 2010–2018, Atmos. Chem. Phys., 21, 10643–10669, https://doi.org/10.5194/acp-21-10643-2021, 2021.