the Creative Commons Attribution 4.0 License.
the Creative Commons Attribution 4.0 License.
Secondary PM2.5 decreases significantly less than NO2 emission reductions during COVID lockdown in Germany
Vigneshkumar Balamurugan
Frank N. Keutsch
This study estimates the influence of anthropogenic emission reductions on the concentration of particulate matter with a diameter smaller than 2.5 µm (PM2.5) during the 2020 lockdown period in German metropolitan areas. After accounting for meteorological effects, PM2.5 concentrations during the spring 2020 lockdown period were 5 % lower compared to the same time period in 2019. However, during the 2020 pre-lockdown period (winter), PM2.5 concentrations with meteorology accounted for were 19 % lower than in 2019. Meanwhile, NO2 concentrations with meteorology accounted for dropped by 23 % during the 2020 lockdown period compared to an only 9 % drop for the 2020 pre-lockdown period, both compared to 2019. SO2 and CO concentrations with meteorology accounted for show no significant changes during the 2020 lockdown period compared to 2019. GEOS-Chem (GC) simulations with a COVID-19 emission reduction scenario based on the observations (23 % reduction in anthropogenic NOx emission with unchanged anthropogenic volatile organic compounds (VOCs) and SO2) are consistent with the small reductions of PM2.5 during the lockdown and are used to identify the underlying drivers for this. Due to being in a NOx-saturated ozone production regime, GC OH radical and O3 concentrations increased (15 % and 9 %, respectively) during the lockdown compared to a business-as-usual (BAU, no lockdown) scenario. Ox (equal to NO2+O3) analysis implies that the increase in ozone at nighttime is solely due to reduced NO titration. The increased O3 results in increased NO3 radical concentrations, primarily during the night, despite the large reductions in NO2. Thus, the oxidative capacity of the atmosphere is increased in all three important oxidants, OH, O3, and NO3. PM nitrate formation from gas-phase nitric acid (HNO3) is decreased during the lockdown as the increased OH concentration cannot compensate for the strong reductions in NO2, resulting in decreased daytime HNO3 formation from the OH + NO2 reaction. However, nighttime formation of PM nitrate from N2O5 hydrolysis is relatively unchanged. This results from the fact that increased nighttime O3 results in significantly increased NO3, which roughly balances the effect of the strong NO2 reductions on N2O5 formation. Ultimately, the only small observed decrease in lockdown PM2.5 concentrations can be explained by the large contribution of nighttime PM nitrate formation, generally enhanced sulfate formation, and slightly decreased ammonium. This study also suggests that high PM2.5 episodes in early spring are linked to high atmospheric ammonia concentrations combined with favorable meteorological conditions of low temperature and low boundary layer height. Northwest Germany is a hot-spot of NH3 emissions, primarily emitted from livestock farming and intensive agricultural activities (fertilizer application), with high NH3 concentrations in the early spring and summer months. Based on our findings, we suggest that appropriate NOx and VOC emission controls are required to limit ozone, and that should also help reduce PM2.5. Regulation of NH3 emissions, primarily from agricultural sectors, could result in significant reductions in PM2.5 pollution.
- Article
(16228 KB) - Full-text XML
- BibTeX
- EndNote
To halt the spread of the COVID-19 virus, various strict measures such as social isolation, curfews, and travel restrictions were implemented around the world in early 2020 (Steinmetz et al., 2020). As a result of these restrictions, anthropogenic emissions decreased significantly (Schumann et al., 2021; Le Quéré et al., 2020; Turner et al., 2020). Reduced primary emission activities from road transportation and industrial activities were expected to improve air quality. Numerous studies using satellite and in situ measurements have reported significant reductions in primary air pollutant concentrations during the COVID-19 lockdown period compared to pre-lockdown period in various parts of the world (Bauwens et al., 2020; Biswal et al., 2020; Collivignarelli et al., 2020; Dietrich et al., 2021; Field et al., 2021; He et al., 2021; Pathakoti et al., 2021; Mendez-Espinosa et al., 2020), but they also emphasize the importance of accounting for the effects of different meteorological conditions between the study period and the reference period (Barré et al., 2021; Grange et al., 2021; Kroll et al., 2020; Koukouli et al., 2021; Ordóñez et al., 2020; Solberg et al., 2021). Anomalies in air pollutant concentrations caused by changes in meteorological conditions were also separated from observed changes using modeling work to estimate the actual influence of COVID-19 lockdown restrictions on air pollutant concentration changes (Balamurugan et al., 2021; Goldberg et al., 2020; Kang et al., 2020; Petetin et al., 2020; Qu et al., 2021; Yin et al., 2021). Secondary pollutant concentrations (O3 and PM2.5), which are primarily produced by precursor gases through complex atmospheric chemical reactions, remarkably increased or did not reduce commensurate to precursor emission reductions seen in some parts of the world during the COVID-19 lockdown period (Campbell et al., 2021; Deroubaix et al., 2021; He et al., 2021; Huang et al., 2021; Keller et al., 2021; Lee et al., 2020; Putaud et al., 2021; Souri et al., 2021; Wang et al., 2020, 2021).
Particulate matter (PM) is the sum of all particles (solid and liquid) suspended in air and can be classified based on aerodynamic behavior, i.e., aerodynamic diameter (AD). Particles with an AD smaller than 10 µm are referred to as PM10, while particles smaller than 2.5 µm AD are referred to as PM2.5. Understanding of seasonal and inter-annual variability of PM, particularly over urban areas, remains a challenge (Fuzzi et al., 2015). This is mainly due to a lack of understanding in the attribution of PM sources. PM sources include both direct/primary sources (vehicle and industrial emissions, windblown dust, pollen, wildfires, etc.) and secondary formation (gas-to-particle conversion process) via atmospheric chemical reaction of precursor compounds such as NOx (nitrogen oxides), SO2 (sulfur dioxide), NH3 (ammonia), VOCs (volatile organic compounds), and other organic compounds, including compounds that have partitioned from primary aerosol back to the gas phase, followed by partitioning to the condensed phase (Allen et al., 2015; Ayres et al., 2015; Fisher et al., 2016; Hallquist et al., 2009; Jacob, 1999; Jacobson, 1999; Marais et al., 2016; Seinfeld and Pankow, 2003; Steinfeld, 1998; Zhang et al., 2015). The composition of PM thus varies greatly depending on time and location; for example, in urban areas nitrate and organic aerosol often dominate in wintertime (Cesari et al., 2018; Juda-Rezler et al., 2020; Samek et al., 2020; Salameh et al., 2015; Womack et al., 2019; Zhai et al., 2021).
In this study, we mainly focus on the response of urban surface PM2.5 to COVID-19 lockdown restrictions in Germany. Because major anthropogenic emissions are reduced, this unplanned intervention can test the understanding of the contribution of secondary PM2.5 sources, as well as the processes important in secondary PM2.5 formation. Despite significant reductions in some anthropogenic activities, natural and agricultural air pollutant sources were not affected by the COVID-19 lockdown measures. Ammonia (NH3) emissions (agricultural sources) are a significant source of PM2.5 in Germany in the spring (Fortems-Cheiney et al., 2016), when lockdown restrictions are implemented. Secondary inorganic aerosols such as ammonium sulfate and ammonium nitrate are the largest contributors to PM2.5 in Europe (Pay et al., 2012; Petetin et al., 2016). In comparison to sulfate formation, nitrate formation is more dependent on NH3 concentration (Erisman and Schaap, 2004; Sharma et al., 2007; Wu et al., 2008). In the winter and spring (low temperature and high relative humidity), the role of NH3 in PM2.5 formation is greater than in the summer (high temperature and low relative humidity) (Schiferl et al., 2016; Squizzato et al., 2013; Viatte et al., 2020). Primary components of PM2.5 are directly proportional to primary emission, but secondary components of PM2.5 are not directly proportional to secondary precursor emissions or concentrations as they are produced by non-linear complex atmospheric chemical reactions (Shah et al., 2018). Observational and modeling evidence is required to estimate the influence of change in precursor emissions on PM2.5 concentrations. To this end, we used ground- and space-based measurements of PM2.5, NO2, O3, SO2, CO, and NH3 in conjunction with GEOS-Chem simulations to investigate the influence of lockdown restrictions on PM2.5 concentrations.
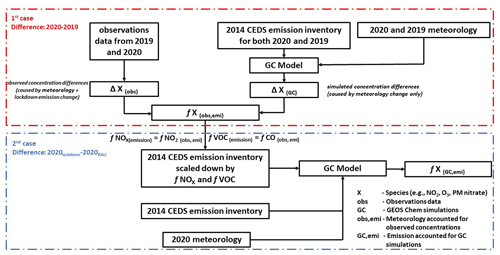
Modeling studies such as Gaubert et al. (2021), Hammer et al. (2021), Matthias et al. (2021), and Menut et al. (2020) have already reported the PM2.5 changes across Europe, including Germany, during the COVID-19 lockdown period. The activity data (e.g., transportation, industrial activities, and energy production) were used in the abovementioned studies to create a COVID-19 emission reduction scenario (Doumbia et al., 2021; Guevara et al., 2021). However, there are large discrepancies between various activity datasets (Gensheimer et al., 2021), necessitating different approaches to estimating the actual emission reduction caused by the COVID-19 lockdown restrictions. In this study, GEOS-Chem simulations (using identical anthropogenic emission for 2020 and 2019) were used to estimate the observed pollutant concentrations changes with meteorology accounted for between 2020 and 2019, which were then used as a proxy for emissions reductions caused by COVID-19 lockdown measures to create a COVID-19 emission scenario in the GEOS-Chem model for simulating the lockdown pollutant concentrations (Fig. 1). In addition to looking at the impact of lockdown restrictions on air pollutant concentrations (Sect. 4.1), we focus on process level analysis of the impact of changes in precursor emissions (NOx) on PM2.5 formation (Sect. 4.2), as well as the role of ammonia (NH3) emissions in PM2.5 formation (Sect. 4.3).
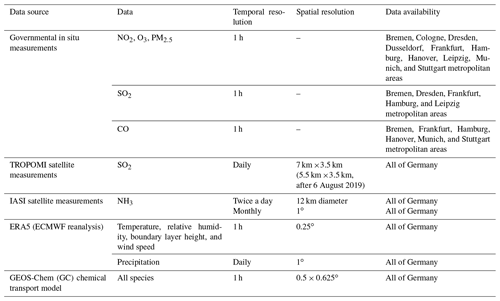
Datasets used in this study are summarized in Table 1. We focused on 10 metropolitan areas in Germany (Bremen, Cologne, Dresden, Düsseldorf, Frankfurt, Hamburg, Hanover, Leipzig, Munich, and Stuttgart) and used surface air pollutant concentration data (PM2.5, NO2, O3) for all of these while SO2 data were only available for five of these areas (Bremen, Dresden, Frankfurt, Hamburg, and Leipzig), and CO data were limited to six metropolitan areas (Bremen, Frankfurt, Hamburg, Hanover, Munich, and Stuttgart). We use data for 2019 and 2020 in this work (data obtained from https://discomap.eea.europa.eu/map/fme/AirQualityExport.htm, last access: 15 January 2022).
TROPOMI tropospheric SO2 (Theys et al., 2017) column products are also used (offline products-obtained from https://s5phub.copernicus.eu, last access: 15 January 2022). The TROPOMI SO2 product provides the total SO2 column between the surface and the top of the troposphere. The TROPOMI overpass occurs around 13:30 local time. At the start of the mission, the TROPOMI product provided data at a resolution of 7 km ×3.5 km, while after 6 August 2019 the resolution improved to 5.5 km ×3.5 km. Stricter quality filtering criteria (quality assurance value (qa) ≥ 0.5) were applied to the dataset. A daily mean of SO2 is calculated by averaging these values within 0.5∘ radius of the urban center.
The daily atmospheric NH3 variability in Germany was studied using the “near-real time daily IASI/Metop-B ammonia (NH3) total column (ANNI-NH3-v3)” dataset (products-obtained from https://iasi.aeris-data.fr/catalog/, last access: 15 January 2022). The data used are from the IASI instrument aboard the Metop-B satellite, which has a local solar overpass time of 09:30 and 21:30 (Clerbaux et al., 2009). We only used daytime (09:30) measurements in this study. Nighttime measurements (21:30) were excluded due to their large relative errors. A daily mean is calculated by averaging the values within a 0.5∘ radius of the urban center. The monthly atmospheric NH3 variability in Germany was studied using the “standard monthly IASI/Metop-B ULB-LATMOS ammonia (NH3) L3 product (total column)” dataset. This product contains a monthly averaged NH3 total column with a spatial resolution of 1∘ ×1∘ (products obtained from https://iasi.aeris-data.fr/catalog/, last access: 15 January 2022).
Temperature, relative humidity, boundary layer height, and wind information are obtained from the ERA5 product (Hersbach et al., 2020). This product's native spatial and temporal resolutions are 0.25∘ and 1 h, respectively. For precipitation information, the GPCP daily gridded product from ERA5 is used, which provides global gridded data at 1∘ resolution (products obtained from https://cds.climate.copernicus.eu/, last access: 15 January 2022).
We used the GEOS-Chem (GC) chemical transport model (https://doi.org/10.5281/zenodo.3959279) to simulate the pollutant concentration for 2020 and 2019. The GC simulation conducted over Germany (45–57∘ N, 4–17∘ E) had a horizontal resolution of 0.5∘ × 0.625∘ with dynamic boundary conditions generated from a global simulation with 4∘ × 5∘ resolution. We ran the GC simulation for two cases. In the first case, anthropogenic emissions from the 2014 CEDS inventory (Hoesly et al., 2018), the most recent version of which is 2014, are used in the GC simulations for both 2019 and 2020, but with the corresponding meteorology from MERRA-2 global reanalysis product for 2019 and 2020. Natural emissions from soil and lightning are calculated for the corresponding year using mechanisms described in Hudman et al. (2012) and Murray (2016). The corresponding year's open fire emissions from GFED4 (Werf et al., 2017) are used for 2019 and 2020. In the second case, the 2014 CEDS anthropogenic emission inventory was scaled down by the estimated emissions reduction caused by the lockdown restrictions for the 2020 lockdown period. The remaining (natural and fire) emissions are calculated in the same way as in the first case. Even though the 2014 CEDS anthropogenic emission inventory is used in GC simulations, the effects of anthropogenic emission changes between 2014 and 2019 or 2020 will be canceled out because we use the difference between two years (e.g., 2020–2019) or two cases (e.g., 2020lockdown − 2020no lockdown) in our study.
The following is our methodology for estimating observed pollutant concentration changes with meteorology accounted for between 2020 and 2019, similar to Balamurugan et al. (2021) and Qu et al. (2021). We estimate the difference in pollutant concentrations between 2020 and 2019 caused by changes in meteorology using GC-simulated concentrations (first case). Since GC uses identical anthropogenic emission for 2020 and 2019, with the corresponding year's meteorology, the difference between 2020 and 2019 GC pollutant (e.g., PM2.5) concentrations only results from meteorology changes between 2020 and 2019. We use Δ to signify absolute concentration change and f to signify fractional (percentage) change.
The observed (ground-truth measurements) pollutant concentration changes between 2020 and 2019, which include the effects of lockdown restrictions and meteorology, are
To disentangle the meteorology contribution from the observed pollutant concentration changes, we subtract the GC pollutant concentration changes caused by meteorology from observed pollutant concentration changes between 2020 and 2019.
The fractional change in pollutant concentration with meteorology accounted for between 2020 and 2019; i.e., fractional change (%) in pollutant concentration between 2020 and 2019 due to emission changes only, is calculated as
where “obs”, “GC”, and “obs,emi” refer to ground-truth measurements (observations data), GEOS-Chem simulations, and ground-truth measurements with meteorology accounted for, respectively.
We estimate the fractional change with meteorology accounted for in other pollutant concentrations analogously. Our previous study (Balamurugan et al., 2021), using the same methodology, reported the NO2 and O3 concentration changes with meteorology accounted for for eight German metropolitan areas. Here, we reproduce the results for NO2 and O3 concentrations, but for 10 metropolitan areas. We use fNO2(obs,emi) and fCO(obs,emi) to capture fractional changes in anthropogenic NOx and VOC emission (fNOx(emission) and fVOC(emission)) due to lockdown restrictions, respectively. Because of the scarcity of VOC measurements, CO data were used as a proxy for anthropogenic VOCs (Fujita et al., 2003; Jiménez et al., 2005; Stephens et al., 2008; Yarwood et al., 2003), and NO2 was used as proxy for NOx. This assumption is supported by studies such as Baker et al. (2008) and Von Schneidemesser et al. (2010), which show anthropogenic VOCs are well correlated with CO, and Blanchard and Tanenbaum (2003), which shows comparable changes in VOCs and CO between weekdays and the weekend. Changes in biogenic VOCs are not directly affected by lockdown measures.
The base anthropogenic emission inventory was then scaled down by fNOx(emission) and fVOC(emission) for NOx and VOC emission, respectively, in the GC model for the 2020 lockdown period (second case), which simulates all pollutant concentrations for the lockdown emission scenario. The fractional change in GC pollutant levels with emissions accounted for, i.e., using scaled emission inventories, during the 2020 lockdown period compared to the 2020 business-as-usual (BAU), i.e., no lockdown, level is calculated as
where “GC,emi” refers to GC simulations accounting for scaled emissions, and PM is the PM2.5 concentrations during the lockdown period determined via the 2020 GC simulations with down-scaled emissions. We estimate the concentration changes of other pollutants with emissions accounted for in the same way. Figure 1 illustrates our methodology for calculating the observed pollutant concentration changes with meteorology accounted for between 2020 and 2019, as well as GC pollutant concentration changes with emissions accounted for between 2020 lockdown and 2020 BAU scenarios.
4.1 Influence of lockdown restrictions on the concentrations of air pollutants
To assess the impact of lockdown restrictions on the concentration of air pollutants, we compared the 2020 lockdown period pollutant concentrations to the same period in 2019. These comparison results, however, need to take the effects of both meteorological and lockdown restrictions into account. As mentioned in Sect. 3, we used GEOS-Chem simulations to disentangle the effects of meteorology on observed pollutant concentration changes between 2020 and 2019. Studies such as Balamurugan et al. (2021) and Tai et al. (2012) have shown that GEOS-Chem can reproduce the temporal variability of observed pollutant concentrations including PM2.5, emphasizing that GC can be used for process level analysis of PM2.5 variability. We also compared the 2019 GC and 2019 observed in situ PM2.5 concentrations and found that the GC and observed in situ PM2.5 concentrations were in good agreement (R > 0.5 for all metropolitan areas, except Leipzig, which has a R value of 0.39). Table A1 shows the statistical evaluation (R, RMSE, and mean bias) of the GC model performance for each metropolitan area. The GC simulations underestimate the PM2.5 when compared to observed in situ PM2.5 concentrations (mean bias ((GC – in situ)/in situ) ranges from −12.7 % to −37.4 %), except for the Cologne metropolitan area (+11.7 %). However, since we use the GC's relative difference between 2020 and 2019, this bias should cancel out. We also compared the 2019 GC simulated nitrate and ammonium concentration for the urban measurement station in Germany (51.75∘ N, 14.33∘ E). The statistical evaluation (R, RMSE, and mean bias) of the GC model performance for these species is given in Table B1.
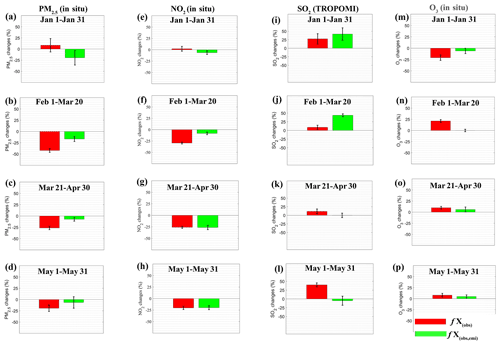
Figure 2 shows mean PM2.5, NO2, and O3 concentration changes with meteorology accounted for between 2020 and 2019 for 10 German metropolitan areas from 1 January through 31 May. Mean PM2.5, NO2, and O3 concentration changes with meteorology both accounted for and unaccounted for between 2020 and 2019 for 10 German metropolitan areas are shown in Appendix Fig. A1. The German government imposed COVID-19 lockdown restrictions on 21 March 2020 in Germany. In figures and for specific cases, the pre-lockdown period (1 January to 20 March) is divided into two sections, and the lockdown period (21 March to 31 May) is also divided into two sections (unless otherwise specified): (a) 1 to 31 January 2020 – no lockdown restrictions; (b) 1 February to 20 March 2020 – no lockdown restrictions in the event of unusual weather conditions (occurrence of storms); (c) 21 March to 30 April 2020 (spring) – strict lockdown measures; and (d) 1 to 31 May 2020 (late spring) – loose lockdown measures. Germany experienced high wind conditions due to storms in February 2020 (Matthias et al., 2021), which was used to determine the extent of meteorology's role in pollutant concentration changes. Mean NO2 and PM2.5 concentrations with meteorology accounted for for the 1 February to 20 March 2020 period (before the implementation of lockdown) are lower than the corresponding ones in 2019 by 30 % and 42 % (fNO2(obs) and fPM2.5(obs)), respectively, due to the dilution and/or dispersion from the high wind conditions. However, after accounting for meteorology, the difference in mean NO2 and PM2.5 concentrations between 2020 and 2019 for the period from February 1 to March 20 (fNO2(obs,emi) and fPM2.5(obs,emi)) is 8 % and 18 %, respectively. This finding is consistent with mean NO2 and PM2.5 changes with meteorology accounted for between 2020 and 2019 for the period from 1 January to 31 January (Fig. 2a, b). This highlights the importance of accounting for meteorological impacts.
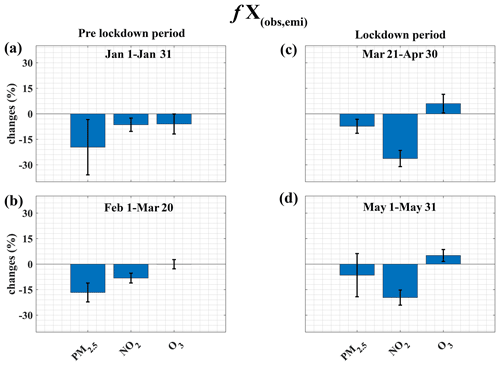
Figure 2Mean in situ PM2.5, NO2, and O3 concentration changes with meteorology accounted for between 2020 and 2019. Results of computations according to our first case (fX(obs,emi)) in Sect. 3. Error bars represent the 1σ of the mean of 10 metropolitan areas.
In the 2020 pre-lockdown period (1 January to 20 March), both NO2 and PM2.5 levels with meteorology accounted for are lower by 9 % and 19 %, respectively, compared to the same period in 2019. During the 2020 lockdown period (21 March to 31 May), mean NO2 concentrations with meteorology accounted for dropped significantly (23 %) compared to the same period in 2019, which is greater than the drop in the 2020 pre-lockdown period compared to 2019 (9 %). Comparatively, mean 2020 lockdown PM2.5 concentrations with meteorology accounted for show a smaller reduction (5 %) compared to the same period in 2019, while an important precursor, NO2, decreased by 23 % during the same period. Furthermore, the PM2.5 reduction with meteorology accounted for during the 2020 lockdown period (5 %) is less than the PM2.5 reduction with meteorology accounted for observed during the 2020 pre-lockdown period (19 %) compared to the corresponding 2019 periods (Fig. 2). Especially in Munich and Stuttgart, PM2.5 concentrations with meteorology accounted for during the 2020 lockdown period are higher than in 2019. The mean O3 concentrations with meteorology accounted for in the 2020 lockdown period are increased by 6 % compared to the same period in 2019. The increase in O3 concentration during the 2020 lockdown period is mainly due to being in a NOx-saturated regime (Gaubert et al., 2021), in which reducing NOx emission results in an increase in O3 concentrations (Sillman, 1999; Sillman et al., 1990). It is also possible that the increase in ozone is due to less ozone destruction via lower NO titration, in addition to an increase in ozone formation efficiency through NOx-saturated regime chemistry. The mean Ox () concentrations with meteorology accounted for in the 2020 lockdown period are 2 % higher than in 2019 (Fig. C1a), implying that the reduced NO titration effect partly contributed to the increased ozone. Ox analysis also implies that the decrease in NO2 was offset by an increase in O3, and ozone production is overwhelmingly NOx saturated in Germany.
The effects of lockdown restrictions on SO2 concentrations are insignificant. In comparison to 2019, TROPOMI SO2 levels with meteorology accounted for are decreased by 1 % during the 2020 lockdown period compared to 2019 (Fig. A1). When accounting for meteorological impacts on TROPOMI satellite column concentrations, GEOS-Chem diagnostics (47 vertical layers) were converted to a column, applying TROPOMI's averaging kernel. Because of the large influence of background concentration on satellite column measurements, we also investigated in situ SO2 concentrations, but only for five metropolitan areas. Similarly, we found that the impact of lockdown restrictions on in situ SO2 concentrations is marginal (Fig. B1). The road transportation sector contributes less than 1 % of total sulfur dioxide emissions, while coal-related fuel burning (industrial and energy production) accounts for nearly 80 % of total sulfur dioxide emissions (SO2, 2021). Because the lockdown restrictions primarily reduced traffic-related emissions, we see far less effects of the lockdown on SO2 concentration (slight increase or no significant decrease in other European metropolitan areas; Collivignarelli et al., 2020; Filonchyk et al., 2021; Higham et al., 2021). We found similar effects on in situ CO concentration changes in six metropolitan areas. The mean CO concentrations with meteorology accounted for are lower by 3 % during the 2020 lockdown period compared to 2019 (Fig. B1). Stuttgart CO concentrations with meteorology accounted for in 2020 were higher than in 2019 at all times. Other metropolitan areas experienced minor reductions (Clark et al., 2021; Hörmann et al., 2021).
4.2 Model evidence of changes in air pollutant concentration resulting from lockdown restrictions
As mentioned in Sect. 3, we use the NO2 and CO changes with meteorology accounted for to adjust the anthropogenic NOx and VOC emissions in inventories due to lockdown restriction impacts. GC model simulations are then obtained with this scaled anthropogenic emission scenario (23 % reduction in anthropogenic NOx emission and unchanged anthropogenic VOC emissions) for the 2020 lockdown period. The NOx emission reduction is within the range of estimated anthropogenic NOx emission reductions using activity data for Europe by previous authors (Doumbia et al., 2021; Guevara et al., 2021) (25 % and 33 %, respectively). For those studies there are large differences in estimated anthropogenic VOC emission changes for Europe; Doumbia et al. (2021) estimated 34 % while Guevara et al. (2021) estimated 8 % reduction in anthropogenic VOC emissions, compared to the BAU scenario. However, the real-time measurements at a UK station show no significant changes in many VOC concentrations during the lockdown period (Grange et al., 2021). For the NOx-saturated ozone production regime, VOC emission reductions can decrease ozone levels, while NOx emission reductions increase them. Gaubert et al. (2021) conducted a sensitivity study of modeling work on ozone levels in response to NOx or VOC or both emission reductions for the 2020 lockdown period. The reduction in both emissions (NOx and VOC), suggested by Doumbia et al. (2021), results in a slight increase in lockdown ozone levels (< 2.5 %) over only northwestern Germany and a slight decrease in lockdown ozone levels over other regions of Germany, compared to BAU levels. However, only reduction in NOx emission results in increased lockdown ozone levels (0 %–10 %) over all of Germany compared to BAU levels, which is also consistent with our results of an increase in ozone levels with meteorology accounted for over different metropolitan areas across Germany during the 2020 lockdown period compared to 2019 levels. This implies that anthropogenic VOC emissions were either not reduced at all or by a much smaller percentage than anthropogenic NOx emissions, compared to the BAU scenario. According to the European Environment Agency (EEA) (https://www.eea.europa.eu/data-and-maps/indicators/eea-32-non-methane-volatile-1/assessment-4, last access: 15 January 2022), the road transport sector accounts for 14.6 % of total nonmethane volatile organic compound (NMVOC) emissions, while the road transport sector accounts for 40.5 % of total NOx emissions (https://www.eea.europa.eu/data-and-maps/indicators/eea-32-nitrogen-oxides-nox-emissions-1/assessment.2010-08-19.0140149032-3, last access: 15 January 2022). According to Guevara et al. (2021), the transportation sector accounts for nearly 90 % of the reduction in total anthropogenic NOx and VOC emissions during lockdown. As we noted that NOx emission decreased by 23 %, and the lockdown restrictions primarily reduced traffic-related emissions, we can directly extrapolate this to a reduction in road-transportation-related emissions: approximately 43 % (23–). This finding also corresponds to a 40 % decrease in traffic vehicle count (Gensheimer et al., 2021). Therefore, the decrease in VOC emission from the transport sector should be 6 % (14.6 × 0.43). However, due to a significant decline in the transport sector's VOC emissions in recent years, this reduction in VOC emissions from the transport sector, calculated based on the EEA’s 2015 data, should be even less than 6 %. There is also no evidence that lockdown measures affect the major source of VOC emissions, which is use of volatile chemical products such as cleaning agents and personal care products, as well as biogenic emissions.
The GC lockdown NO2 concentrations with emissions accounted for decreased by 21 % (fNO2(GC,emi)) while GC lockdown O3 concentrations with emissions accounted for increased by 9 % compared to 2020 BAU (Fig. 3). This is consistent with previous studies (such as Balamurugan et al., 2021; Gaubert et al., 2021), which show that German metropolitan areas are in a NOx-saturated ozone production regime in spring. However, the diurnal cycle of GC Ox changes between 2020 lockdown and BAU suggests that nighttime ozone increases are solely due to a decrease in NO titration effects (Fig. C1b). The GC lockdown PM concentrations with emissions accounted for show small decreases compared to 2020 BAU (Fig. 3). These results are consistent with previous studies (Gaubert et al., 2021; Hammer et al., 2021; Matthias et al., 2021; Menut et al., 2020), which used activity data to develop an emission reduction scenario and estimated small to no reduction in PM2.5, a significant drop in NO2, and a marginal increase in O3 levels during the 2020 lockdown period, compared to BAU levels, over northern Europe including Germany.
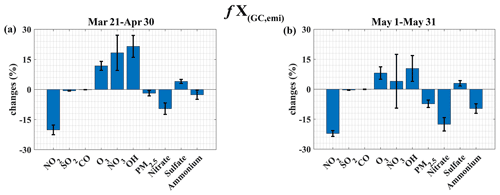
Figure 3The GC NO2, SO2, CO, O3, NO3 radical, OH radical, PM2.5, inorganic nitrate, sulfate, and ammonium concentration changes with emissions accounted for between 2020 lockdown and 2020 BAU (no lockdown) scenarios (fX(GC,emi)). Error bars represent the 1 σ of the mean of 10 metropolitan areas.
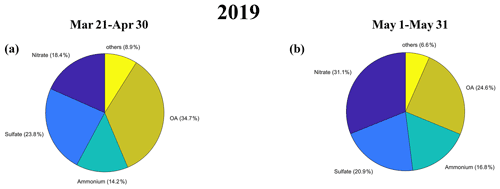
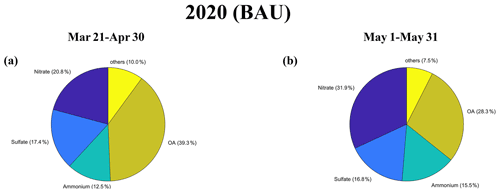
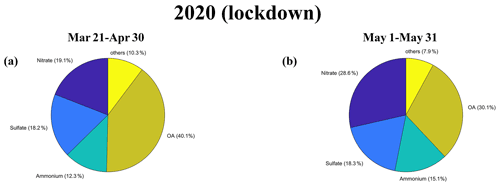
We investigated the GC PM2.5 composition for the studied period to determine the role of reduced NOx emission in total PM2.5. Major secondary PM2.5 components are nitrate, sulfate, ammonium, and organic aerosol, which, on average, correspond to 24 %, 23 %, 15 %, and 30 % of total PM2.5, respectively, from 21 March to 31 May 2019 (Fig. D1). Mean relative contribution of PM2.5 species for 2020 (BAU) and 2020 (lockdown) is shown in Figs. E1 and F1, respectively. The GC PM nitrate levels with emissions accounted for during the 2020 initial lockdown period (21 March to 30 April) are 9.5 % lower than the 2020 BAU levels (fNIT(GC,emi)) (Fig. 3a); however, we see NO2 decreased by 21 % during the same period. The decrease in GC PM nitrate with emissions accounted for is also less than the decrease in NO2 during the second half of the lockdown (1 May to 31 May). The GC lockdown PM sulfate level with emissions accounted for shows a marginal increase (3.5 %), while GC lockdown PM ammonium with emissions accounted for shows a marginal decrease (5.8 %), compared to the 2020 BAU level. The slight increase (and decrease) in sulfate (and ammonium) was also found in the studies of Hammer et al. (2021) and Matthias et al. (2021), who used activity data to adjust the COVID-19 emission scenario.
It is notable that the reduction in NOx, a precursor to PM nitrate, does not directly translate into a decrease in PM nitrate formation. There are several pathways for the formation of nitric acid (HNO3), which partitions to PM nitrate (Allen et al., 2015; Bauer et al., 2007). The reaction of OH and NO2 (homogeneous pathway) and the hydrolysis of N2O5 on aerosol particles (heterogeneous pathway) are the two major pathways (Chang et al., 2011, 2016; Mollner et al., 2010).
The reaction for HNO3 formation via gas-phase oxidation of NO2 by OH is
The reactions resulting in HNO3 formation via hydrolysis of N2O5 on aerosol surfaces are
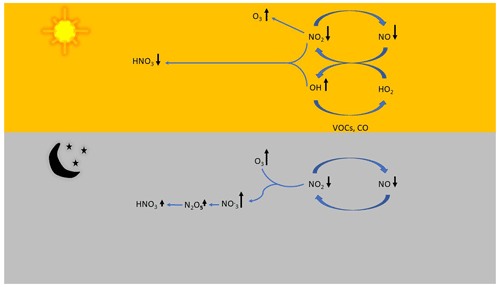
The formation of HNO3 from the reaction of OH and NO2 dominates during the day, while hydrolysis of N2O5 on aerosol particles dominates at night as OH nighttime concentrations are low and N2O5 photolyzes easily (Russell et al., 1986). At night, the NO3 radical can be an important precursor for PM nitrate via reactions (Reactions R3, R4) (Kang et al., 2021; Shah et al., 2020; Wang et al., 2013). The concentrations of OH and NO3 with emissions accounted for, which drive day and nighttime formation of PM nitrate, increased substantially (15 % and 12 %, respectively) during the lockdown period compared to BAU (Fig. 3). The increase in OH radicals results from German metropolitan areas being in a NOx-saturated regime (Shah et al., 2020). The increase in GC lockdown NO3 levels is predominantly at night due to a significant increase in nighttime O3 (Fig. 4b, e); the reaction of NO2 with O3 is the most important source of NO3 radicals (Reaction R2) (Geyer et al., 2001).
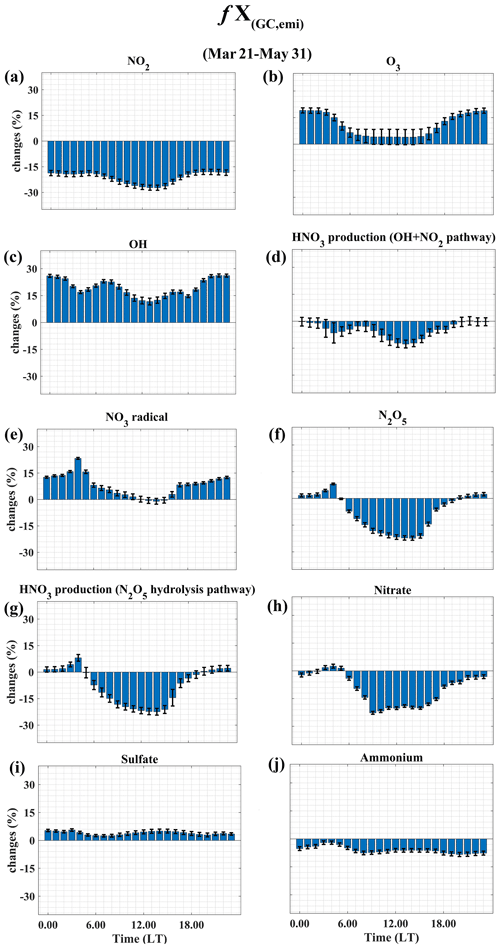
Figure 4Diurnal cycle of GC NO2, O3, OH radical, HNO3 production from oxidation of NO2 by the OH pathway, NO3 radical, N2O5, HNO3 production from the N2O5 hydrolysis pathway, PM nitrate, sulfate, and ammonium concentration changes with emissions accounted for between 2020 lockdown and 2020 BAU (no lockdown) scenarios (fX(GC,emi)). Error bars represent the standard error of the respective hour in 10 metropolitan areas.
Liu et al. (2020) have demonstrated that analyzing the diurnal cycle of total inorganic nitrate helps to identify the dominant pathway for the particulate nitrate production. The GC lockdown PM nitrate levels with emissions accounted for decreased significantly during the day, while nighttime lockdown PM nitrate levels decreased slightly compared to BAU levels (Fig. 4h). Even though GC lockdown OH levels increased, HNO3 production from the OH + NO2 reaction during the lockdown period is reduced due to significantly lower daytime NO2 levels compared to BAU (Fig. 4d); as a result, GC daytime lockdown PM nitrate levels are significantly lower compared to BAU levels. However, higher nighttime NO3 levels result in relatively unchanged nighttime HNO3 production from N2O5 hydrolysis, resulting in slightly lower nighttime lockdown PM nitrate compared to BAU (Fig. 4b, e, f, g). This implies that the increase in NO3 radicals due to increased ozone partially offsets the effect of reduced NOx on nitrate formation. Previous studies have also shown that N2O5 hydrolysis plays a more important role in nitrate formation than the gas-phase daytime pathway (NO2 + OH) (Allen et al., 2015; Chan et al., 2021; Kim et al., 2014; Liu et al., 2020; Yan et al., 2019). Figure 5 illustrates the conceptual model of generalized daytime and nighttime lockdown NOx chemistry compared to the BAU scenario. The oxidation of SO2 is a major source of sulfate, and the reaction with the OH radical dominates the gas-phase oxidation of SO2 (Zhang et al., 2015). Therefore, the enhanced sulfate formation during the 2020 lockdown period could be due to the increased oxidizing capacity of atmosphere (OH) since we observe no significant change in GC SO2 concentration with emissions accounted for, compared to BAU concentration (Fig. 3). Organic aerosol (OA) formation could be affected by the changes in oxidizing capacity of the atmosphere (Carlton et al., 2009), but no changes in GC lockdown OA with emissions accounted for were observed compared to the 2020 BAU scenario. Therefore, the fact that no significant change in PM2.5 due to lockdown restrictions is observed can be explained by a significant offset of the decreased daytime PM nitrate formation by enhanced formation of PM sulfate, while PM ammonium shows a marginal decrease.
4.3 Link between spring PM2.5 pollution episodes and high NH3 concentrations
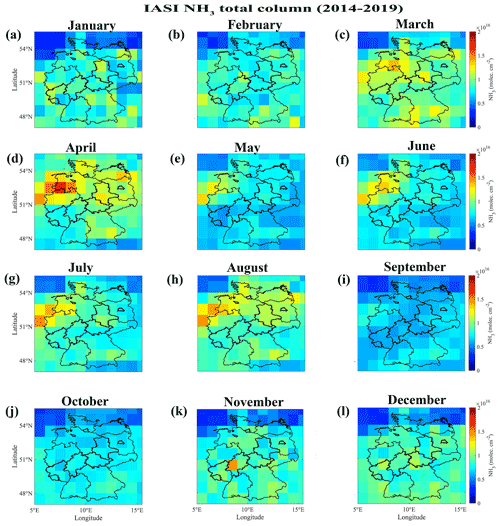
It is worth noting that a significant fraction of PM2.5 is PM nitrate. Ammonia (NH3) is an important precursor for particulate nitrate formation (Ansari and Pandis, 1998; Banzhaf et al., 2013; Behera and Sharma, 2010; Wu et al., 2016). This explains the importance of monitoring and potentially regulating ammonia emissions. Therefore, the inter- and intra-annual changes in ammonia (NH3) concentrations over Germany, as well as their relationship to PM2.5 variability, are reviewed and analyzed further below. In Germany, atmospheric NH3 levels follow a monthly pattern, with NH3 levels peaking in April (Fig. 6). NH3 levels are also elevated during summer months. In Europe, major agricultural practices (fertilizer and manure applications) take place in the early spring (Petetin et al., 2016; Ramanantenasoa et al., 2018; Viatte et al., 2020). The higher atmospheric ammonia levels in April are attributable to agricultural practices such as fertilizer application. The high NH3 values in summer are most likely due to the warm climate (Kuttippurath et al., 2020). Monthly average NH3 maps clearly show the high NH3 values over northwest Germany from April to August, with particularly high values in April. This indicates that northwest Germany is a hot-spot of ammonia emissions compared to the rest of the country. Northwest Germany is known for its high livestock density (livestock farming; EUROSAT, 2013; Scarlat et al., 2018), and it is dominated by cropland and grassland (ESA, 2017). Livestock farming and fertilizer application account for 75 % of NH3 emissions in Europe (Webb et al., 2005). NH3 concentrations in Germany vary greatly from year to year (inter-annual variabilities). We consider the period between 21 March and 30 April when a stricter lockdown was in place to illustrate the inter-annual variability of atmospheric NH3 between 2018 and 2020 (Fig. 7). NH3 levels are lower in 2019 than in 2018, which can be attributed to the lower temperature in 2019 compared to 2018. Meanwhile, even though a strict lockdown was in place, NH3 levels in 2020 are higher than in 2019 and 2018, possibly due to low precipitation. High temperatures promote NH3 volatilization (increases the NH3 level in the atmosphere) (Ernst and Massey, 1960), whereas high rainfall favors wet deposition (removal of atmospheric NH3). Schiferl et al. (2016) and Viatte et al. (2020) have also shown that meteorological parameters such as temperature and precipitation play a greater role in NH3 inter-annual variability.
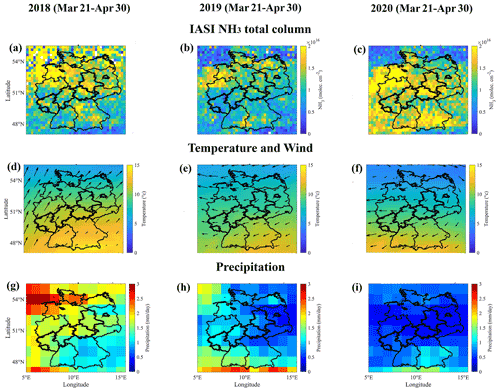
Figure 7Mean IASI NH3 total column (daily IASI NH3 measurements gridded at 0.25∘ resolution) (top), mean temperature and wind (middle), and mean precipitation (bottom).
High-PM-pollution episodes are likely to occur frequently during the winter due to high residential heating demand and favorable meteorological conditions (e.g., low temperature and inversion condition). However, high concentrations of PM2.5 are apparent in German metropolitan areas in the early spring (from the second half of March to the end of April, e.g., Fig. 8a for Munich metropolitan area). On 21 March 2020, the German government imposed COVID-19 lockdown restrictions. However, in situ PM2.5 concentrations during the initial lockdown period are higher than during the pre-lockdown period in 2020. High PM2.5 levels from the second half of March to the end of April are also consistent with previous years without lockdown restrictions. The high PM2.5 events that occur in the spring have also been observed in other European cities, and they typically contain ammonium nitrate and ammonium sulfate (Fortems-Cheiney et al., 2016; Renner and Wolke, 2010; Schaap et al., 2004; Viatte et al., 2020, 2021). Above, we show the high NH3 levels in early spring (April) and summer months. High PM2.5 concentrations are evident in spring; however, we did not observe high-PM2.5 episodes in summer (Fig. 8a). It is also worth noting that even in the spring and winter PM2.5 is not consistently high on days with high NH3. This reflects the complexity of the process of gas-to-particle conversion. Despite high NH3 concentrations, ammonia (NH3)-to-ammonium (NH4) conversion is mainly driven by various meteorological factors such as temperature (and relative humidity). Studies (Viatte et al., 2020; Wang et al., 2015; Watson et al., 1994) have shown that conditions such as temperature of less than 10 ∘C and a high relative humidity of more than 70 % are optimal for atmospheric gas-phase NH3 to transform into ammonium salts, mainly due to reversible ammonium nitrate formation, which depends on temperature and relative humidity; warm and dry conditions partition ammonia back to the gas phase (Mozurkewich, 1993). In comparison to summer, the impact of NH3 on PM2.5 formation is considerable for winter and spring over Europe (Viatte et al., 2020, 2021) and the US (Schiferl et al., 2016). Summer weather is typically warmer (and has lower relative humidity) than winter and spring, which could explain why high NH3 concentrations are not associated with high PM2.5 in summer or late spring. Furthermore, it is important to note that PM2.5 anthropogenic precursor emissions (NOx, SO2, VOCs) have a seasonal cycle, with higher emissions in winter than summer; however, biogenic VOC emissions dominate in the summer. To further demonstrate the relationship between PM2.5 and NH3 for German metropolitan areas, we consider two cases (“Simultaneous” and “Independent”) for 2018 and 2019 (e.g., Fig. 8b for Munich metropolitan area). Simultaneous is the simultaneous increase in NH3 (IASI) and PM2.5 (in situ) concentrations on the same day. Independent is the increase in NH3 (IASI) concentration not corresponding to an increase in PM2.5 (in situ) concentration on the same day. As an example, for the Munich metropolitan area, the temperature and boundary layer height for the Simultaneous case (14.8 ± 8.3 ∘C and 557.9 ± 193.4 m, respectively) are lower than for the Independent case (15.5 ± 5.4 ∘C and 599.8 ± 196.3 m, respectively). In addition to low temperature, low boundary layer height results in higher pollutant concentrations and can thus result in more intense atmospheric chemical reactions. We found similar results for other metropolitan areas, but with different absolute values (Table C1). The regional differences are unsurprising, because other factors also influence the formation of PM2.5 from NH3 (e.g., other precursor concentrations such as NOx and SOx). However, these findings support previous studies and imply that low temperature and low boundary layer height are most favorable for the formation of PM2.5 during the periods of high NH3.
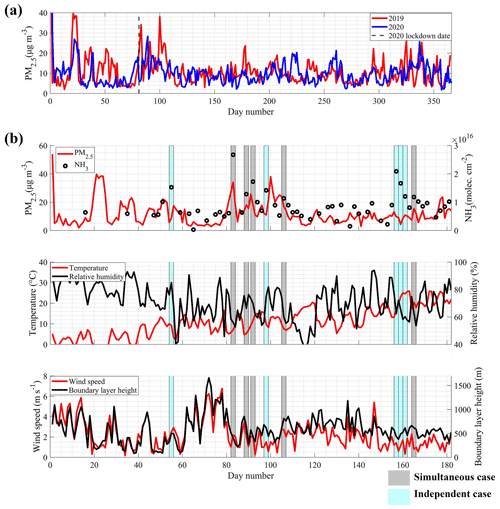
Figure 8The 2019 and 2020 annual daily mean in situ PM2.5 concentrations in Munich (a). In panel (a), the vertical dashed line denotes the start of the 2020 lockdown. The 2019 daily mean in situ PM2.5 and column NH3 from the IASI satellite (b, top). The 2019 daily mean temperature and relative humidity (b, middle). The 2019 daily mean wind speed and boundary layer height (b, bottom). The corresponding days for the cases in Simultaneous are shaded with gray, and the cases in Independent are shaded with cyan. Simultaneous – simultaneous increase in NH3 (IASI) and PM2.5 (in situ) concentrations on the same day. Independent – increase in NH3 (IASI) concentration not corresponding to an increase in PM2.5 (in situ) concentration on the same day.
Our study estimates the influence of anthropogenic emission reductions on PM2.5 concentration changes during the 2020 lockdown period in German metropolitan areas. Mean PM2.5 concentrations with meteorology accounted for decreased by 5 % during the 2020 lockdown period (spring) compared to the corresponding period in 2019. However, during the 2020 pre-lockdown period (winter), PM2.5 concentrations with meteorology accounted for are 19 % lower than in 2019. Meanwhile, NO2 levels with meteorology accounted for decreased 23 % during the 2020 lockdown period, which is a larger decrease than in the 2020 pre-lockdown period compared to 2019 (9 %). No significant change in SO2 and CO concentrations with meteorology accounted for was observed during the 2020 lockdown period, compared to 2019.
The GC model with the COVID-19 emission reduction scenario based on observations (23 % reduction in anthropogenic NOx emissions with unchanged anthropogenic VOCs and SO2) supports our findings of only a marginal decrease in PM2.5 and a significant decrease in NO2 levels. Due to being in a NOx-saturated ozone production regime, the GC lockdown OH and O3 concentrations increased by 15 % and 9 %, respectively, compared to BAU levels. However, Ox analysis suggests that the only increase in ozone during the daytime is due to increased ozone production efficiency via NOx-saturated regime chemistry, whereas the increase at nighttime is due to decreased NO titration. Despite an increase in OH radicals, the GC lockdown PM nitrate formation decreased significantly during the day, due to a significant decrease in NO2, compared to the BAU scenario. Increased nighttime ozone, however, results in increased nighttime NO3, despite decreased NO2, in turn, resulting in slightly increased nighttime N2O5 concentration and only a small change in nighttime PM nitrate. Overall this results in a small decrease in daily PM nitrate. In addition, the increased OH concentration results in a marginal increase in sulfate formation. Nitrate, sulfate, ammonium, and organic aerosol are the major secondary components of PM2.5. The decreased daytime PM nitrate is partially offset by the enhanced PM sulfate, and there is no significant impact from slightly decreased PM ammonium and no change in organic aerosol, resulting in a marginal decrease in PM2.5 concentrations during the lockdown period.
Based on our findings, we suggest that additional emission control measures aimed at reducing ozone pollution be implemented, which should also help reduce PM. A concurrent reduction of NOx and VOC emissions should occur. Otherwise, ozone levels will rise as NOx emissions drop, increasing oxidizing capacity, until a NOx-limited ozone production regime is reached. We also addressed the annual spring PM2.5 pollution episodes in German metropolitan areas, which are associated with high NH3 concentrations. Northwest Germany is a hot-spot of NH3 emissions, primarily emitted from livestock farming and intensive agricultural activities (fertilizer application), with high NH3 concentrations in the early spring and summer months. Winter and spring meteorological conditions are more favorable for PM2.5 formation from NH3 than summer. Unsurprisingly, low temperature (and low boundary layer height) is shown to be a favorable meteorological condition for the formation of PM2.5 from NH3. Regulation of NH3 emissions, primarily from agriculture, has the potential to reduce PM2.5 pollution significantly in German metropolitan areas.
In this study, a COVID-19 emission reduction scenario was created using proxy pollutant concentration changes with meteorology accounted for, assuming that observed proxy pollutant concentration changes are due to the combined direct effects of emission and meteorology changes. Our GC modeling study work reflects the assumed direct relationship between changes in NO2 concentration with meteorology accounted for and changes in NOx emission. This work also shows a direct relationship between changes in SO2 (and CO) concentration with meteorology accounted for and changes in SOx (and CO) emission. However, due to the non-linear feedback system in atmospheric chemistry, this assumption should be investigated further. Because of their similar sources, we use CO concentration as a proxy for anthropogenic VOC concentration. However, this is debatable because VOCs are more reactive than CO. We call for further advancements in estimating the emission changes during the lockdown period, which would allow us to estimate the precise sensitivity of PM2.5 to changes in emissions from various sources and comparison of VOC emission inventories with observations. This will help in the implementation of appropriate air quality regulation strategies in the future. Organic aerosol accounts for nearly 30 % of total PM2.5, which could be influenced by both primary/secondary biogenic and anthropogenic sources. However, our study is limited to examining the effects of NOx emission changes on PM2.5 formation. Therefore, future studies on VOC emission changes on OA formation during high-PM-pollution episodes, particularly in the spring, will be more important in mitigating PM pollution.
Table A1The statistical evaluation (R, RMSE, and mean bias) of the GC model performance (PM2.5) for the 2019 study period (1 January to 31 May).
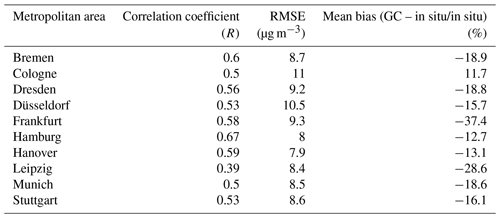
Table B1The statistical evaluation (R, RMSE, and mean bias) of the GC model performance (nitrate and ammonium in PM2.5) for the 2019 study period (1 January to 31 May). For this comparison, data from the urban measurement station (51.75∘ N, 14.33∘ E) in Germany are used.

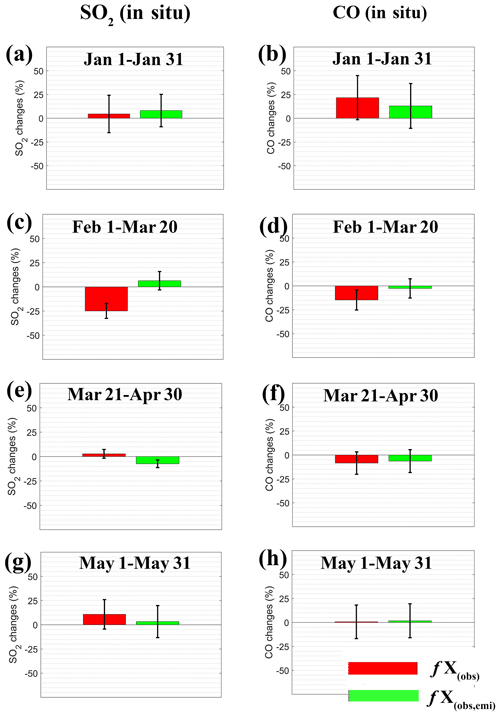
Figure B1Mean changes in in situ SO2 (Bremen, Dresden, Frankfurt, Hamburg, and Leipzig) and in in situ CO (Bremen, Frankfurt, Hamburg, Hanover, Munich, and Stuttgart) with meteorology accounted for (green) and unaccounted for (red) between 2020 and 2019. Error bars represent the 1σ of the mean of the abovementioned metropolitan areas.
Table C1The statistical distribution of meteorological parameters for the cases Independent (each row top) and Simultaneous (each row bottom) in 10 German metropolitan areas for 2018 and 2019.
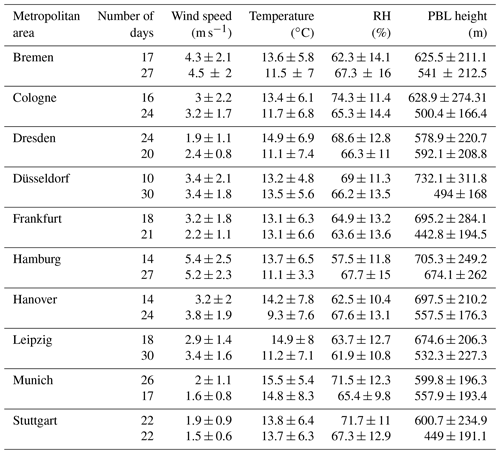
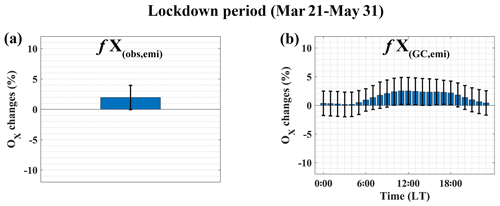
Figure C1Mean changes in in situ Ox with meteorology accounted for between 2020 and 2019 (a). Diurnal cycle of GC Ox concentration changes with emissions accounted for between 2020 lockdown and 2020 BAU (no lockdown) scenarios (fX(GC,emi)) (b). Error bars represent the 1 σ of the mean of 10 metropolitan areas.
Hourly measurements of in situ NO2, O3, PM2.5, SO2, and CO data are downloaded from https://discomap.eea.europa.eu/map/fme/AirQualityExport.htm (European Environment Agency, 2022). The TROPOMI SO2 data are obtained from https://s5phub.copernicus.eu/dhus/#/home (Copernicus Atmosphere Service, 2022). The IASI NH3 data are obtained from https://iasi.aeris-data.fr/catalog/ (IASI, 2022). Hourly ERA5 meteorological data are available at https://doi.org/10.24381/cds.bd0915c6 (Copernicus Climate Change Service, 2022).
VB and XB obtained the measurement data. ZQ performed the modeling work. VB analyzed the data and wrote the manuscript draft. JC and FNK supervised the work and edited the manuscript.
The contact author has declared that neither they nor their co-authors have any competing interests.
Publisher’s note: Copernicus Publications remains neutral with regard to jurisdictional claims in published maps and institutional affiliations.
The authors thank the European Environment Agency, Copernicus Services, the Aeris data infrastructure, and the Copernicus Climate Change Service for providing access to the various datasets used in this study.
This research has been supported by the
Institute for Advanced Study, Technical University of Munich (grant no. 291763) and the German Research Foundation (grant no. 419317138).
This work was supported by the German Research Foundation (DFG) and the Technical University of Munich (TUM) in the framework of the Open Access Publishing Program.
This paper was edited by Theodora Nah and reviewed by Ke Li and two anonymous referees.
Allen, H. M., Draper, D. C., Ayres, B. R., Ault, A., Bondy, A., Takahama, S., Modini, R. L., Baumann, K., Edgerton, E., Knote, C., Laskin, A., Wang, B., and Fry, J. L.: Influence of crustal dust and sea spray supermicron particle concentrations and acidity on inorganic NO aerosol during the 2013 Southern Oxidant and Aerosol Study, Atmos. Chem. Phys., 15, 10669–10685, https://doi.org/10.5194/acp-15-10669-2015, 2015. a, b, c
Ansari, A. S. and Pandis, S. N.: Response of inorganic PM to precursor concentrations, Environ. Sci. Technol., 32, 2706–2714, 1998. a
Ayres, B. R., Allen, H. M., Draper, D. C., Brown, S. S., Wild, R. J., Jimenez, J. L., Day, D. A., Campuzano-Jost, P., Hu, W., de Gouw, J., Koss, A., Cohen, R. C., Duffey, K. C., Romer, P., Baumann, K., Edgerton, E., Takahama, S., Thornton, J. A., Lee, B. H., Lopez-Hilfiker, F. D., Mohr, C., Wennberg, P. O., Nguyen, T. B., Teng, A., Goldstein, A. H., Olson, K., and Fry, J. L.: Organic nitrate aerosol formation via NO biogenic volatile organic compounds in the southeastern United States, Atmos. Chem. Phys., 15, 13377–13392, https://doi.org/10.5194/acp-15-13377-2015, 2015. a
Baker, A. K., Beyersdorf, A. J., Doezema, L. A., Katzenstein, A., Meinardi, S., Simpson, I. J., Blake, D. R., and Rowland, F. S.: Measurements of nonmethane hydrocarbons in 28 United States cities, Atmos. Environ., 42, 170–182, 2008. a
Balamurugan, V., Chen, J., Qu, Z., Bi, X., Gensheimer, J., Shekhar, A., Bhattacharjee, S., and Keutsch, F. N.: Tropospheric NO2 and O3 response to COVID-19 lockdown restrictions at the national and urban scales in Germany, J. Geophys. Res.-Atmos., 126, e2021JD035440, https://doi.org/10.1029/2021JD035440, 2021. a, b, c, d, e
Banzhaf, S., Schaap, M., Wichink Kruit, R. J., Denier van der Gon, H. A. C., Stern, R., and Builtjes, P. J. H.: Impact of emission changes on secondary inorganic aerosol episodes across Germany, Atmos. Chem. Phys., 13, 11675–11693, https://doi.org/10.5194/acp-13-11675-2013, 2013. a
Barré, J., Petetin, H., Colette, A., Guevara, M., Peuch, V.-H., Rouil, L., Engelen, R., Inness, A., Flemming, J., Pérez García-Pando, C., Bowdalo, D., Meleux, F., Geels, C., Christensen, J. H., Gauss, M., Benedictow, A., Tsyro, S., Friese, E., Struzewska, J., Kaminski, J. W., Douros, J., Timmermans, R., Robertson, L., Adani, M., Jorba, O., Joly, M., and Kouznetsov, R.: Estimating lockdown-induced European NO2 changes using satellite and surface observations and air quality models, Atmos. Chem. Phys., 21, 7373–7394, https://doi.org/10.5194/acp-21-7373-2021, 2021. a
Bauer, S. E., Koch, D., Unger, N., Metzger, S. M., Shindell, D. T., and Streets, D. G.: Nitrate aerosols today and in 2030: a global simulation including aerosols and tropospheric ozone, Atmos. Chem. Phys., 7, 5043–5059, https://doi.org/10.5194/acp-7-5043-2007, 2007. a
Bauwens, M., Compernolle, S., Stavrakou, T., Müller, J. F., Van Gent, J., Eskes, H., Levelt, P. F., Van Der A, R., Veefkind, J. P., Vlietinck, J., Yu, H., and Zehner, C.: Impact of coronavirus outbreak on NO2 pollution assessed using TROPOMI and OMI observations, Geophys. Res. Lett., 47, e2020GL087978, https://doi.org/10.1029/2020GL087978, 2020. a
Behera, S. N. and Sharma, M.: Investigating the potential role of ammonia in ion chemistry of fine particulate matter formation for an urban environment, Sci. Total Environ., 408, 3569–3575, 2010. a
Biswal, A., Singh, T., Singh, V., Ravindra, K., and Mor, S.: COVID-19 lockdown and its impact on tropospheric NO2 concentrations over India using satellite-based data, Heliyon, 6, e04764, https://doi.org/10.1016/j.heliyon.2020.e04764, 2020. a
Blanchard, C. L. and Tanenbaum, S. J.: Differences between weekday and weekend air pollutant levels in southern California, J. Air Waste Ma., 53, 816–828, 2003. a
Campbell, P. C., Tong, D., Tang, Y., Baker, B., Lee, P., Saylor, R., Stein, A., Ma, S., Lamsal, L., and Qu, Z.: Impacts of the COVID-19 Economic Slowdown on Ozone Pollution in the US, Atmos. Environ., 264, 118713, https://doi.org/10.1016/j.atmosenv.2021.118713, 2021. a
Carlton, A. G., Wiedinmyer, C., and Kroll, J. H.: A review of Secondary Organic Aerosol (SOA) formation from isoprene, Atmos. Chem. Phys., 9, 4987–5005, https://doi.org/10.5194/acp-9-4987-2009, 2009. a
Cesari, D., De Benedetto, G. E., Bonasoni, P., Busetto, M., Dinoi, A., Merico, E., Chirizzi, D., Cristofanelli, P., Donateo, A., Grasso, F. M., Marinoni, A., Pennetta, A., and Contini, D.: Seasonal variability of PM2.5 and PM10 composition and sources in an urban background site in Southern Italy, Sci. Total Environ., 612, 202–213, 2018. a
Chan, Y.-C., Evans, M. J., He, P., Holmes, C. D., Jaeglé, L., Kasibhatla, P., Liu, X.-Y., Sherwen, T., Thornton, J. A., Wang, X., Xie, Z., Zhai, S., and Alexander B.: Heterogeneous nitrate production mechanisms in intense haze events in the North China Plain, J. Geophys. Res.-Atmos., 126, e2021JD034688, https://doi.org/10.1029/2021JD034688, 2021. a
Chang, W. L., Bhave, P. V., Brown, S. S., Riemer, N., Stutz, J., and Dabdub, D.: Heterogeneous atmospheric chemistry, ambient measurements, and model calculations of N2O5: A review, Aerosol Sci. Tech., 45, 665–695, 2011. a
Chang, W. L., Brown, S. S., Stutz, J., Middlebrook, A. M., Bahreini, R., Wagner, N. L., Dubé, W. P., Pollack, I. B., Ryerson, T. B., and Riemer, N.: Evaluating N2O5 heterogeneous hydrolysis parameterizations for CalNex 2010, J. Geophys. Res.-Atmos., 121, 5051–5070, 2016. a
Clark, H., Bennouna, Y., Tsivlidou, M., Wolff, P., Sauvage, B., Barret, B., Le Flochmoën, E., Blot, R., Boulanger, D., Cousin, J.-M., Nédélec, P., Petzold, A., and Thouret, V.: The effects of the COVID-19 lockdowns on the composition of the troposphere as seen by In-service Aircraft for a Global Observing System (IAGOS) at Frankfurt, Atmos. Chem. Phys., 21, 16237–16256, https://doi.org/10.5194/acp-21-16237-2021, 2021. a
Clerbaux, C., Boynard, A., Clarisse, L., George, M., Hadji-Lazaro, J., Herbin, H., Hurtmans, D., Pommier, M., Razavi, A., Turquety, S., Wespes, C., and Coheur, P.-F.: Monitoring of atmospheric composition using the thermal infrared IASI/MetOp sounder, Atmos. Chem. Phys., 9, 6041–6054, https://doi.org/10.5194/acp-9-6041-2009, 2009. a
Collivignarelli, M. C., Abbà, A., Bertanza, G., Pedrazzani, R., Ricciardi, P., and Miino, M. C.: Lockdown for CoViD-2019 in Milan: What are the effects on air quality?, Sci. Total Environ., 732, 139280, https://doi.org/10.1016/j.scitotenv.2020.139280, 2020. a, b
Copernicus Atmosphere Service: Sentinel-5P Pre-Operations Data Hub, Copernicus Services [data set], https://s5phub.copernicus.eu/dhus/#/home, last access: 15 January 2022. a
Copernicus Climate Change Service: Database of atmospheric, land and oceanic climate variables, Copernicus Climate Change Service [data set], https://doi.org/10.24381/cds.bd0915c6, 2022. a
Deroubaix, A., Brasseur, G., Gaubert, B., Labuhn, I., Menut, L., Siour, G., and Tuccella, P.: Response of surface ozone concentration to emission reduction and meteorology during the COVID-19 lockdown in Europe, Meteorol. Appl., 28, e1990, https://doi.org/10.1002/met.1990, 2021. a
Dietrich, F., Chen, J., Voggenreiter, B., Aigner, P., Nachtigall, N., and Reger, B.: MUCCnet: Munich Urban Carbon Column network, Atmos. Meas. Tech., 14, 1111–1126, https://doi.org/10.5194/amt-14-1111-2021, 2021. a
Doumbia, T., Granier, C., Elguindi, N., Bouarar, I., Darras, S., Brasseur, G., Gaubert, B., Liu, Y., Shi, X., Stavrakou, T., Tilmes, S., Lacey, F., Deroubaix, A., and Wang, T.: Changes in global air pollutant emissions during the COVID-19 pandemic: a dataset for atmospheric modeling, Earth Syst. Sci. Data, 13, 4191–4206, https://doi.org/10.5194/essd-13-4191-2021, 2021. a, b, c, d
European Environment Agency: The European air quality database, European Environment Agency [data set], https://discomap.eea.europa.eu/map/fme/AirQualityExport.htm, last access: 15 January 2022. a
Erisman, J. and Schaap, M.: The need for ammonia abatement with respect to secondary PM reductions in Europe, Environ. Pollut., 129, 159–163, 2004. a
Ernst, J. and Massey, H.: The effects of several factors on volatilization of ammonia formed from urea in the soil, Soil Sci. Soc. Am. J., 24, 87–90, 1960. a
ESA: Mapping Germany’s agricultural landscape, https://www.esa.int/ESA_Multimedia/Images/2017/08/Mapping_Germany_s_agricultural_landscape (last access: 15 January 2022), 2017. a
EUROSAT: Livestock density by NUTS 2 regions, EU-28, 2013, https://ec.europa.eu/eurostat/statistics-explained/index.php?title=File:Livestock_density_by_NUTS_2_regions,_EU-28,_2013.png (last access: 15 January 2022), 2013. a
Field, R. D., Hickman, J. E., Geogdzhayev, I. V., Tsigaridis, K., and Bauer, S. E.: Changes in satellite retrievals of atmospheric composition over eastern China during the 2020 COVID-19 lockdowns, Atmos. Chem. Phys., 21, 18333–18350, https://doi.org/10.5194/acp-21-18333-2021, 2021. a
Filonchyk, M., Hurynovich, V., and Yan, H.: Impact of Covid-19 lockdown on air quality in the Poland, Eastern Europe, Environ. Res., 198, 110454, https://doi.org/10.1016/j.envres.2020.110454, 2021. a
Fisher, J. A., Jacob, D. J., Travis, K. R., Kim, P. S., Marais, E. A., Chan Miller, C., Yu, K., Zhu, L., Yantosca, R. M., Sulprizio, M. P., Mao, J., Wennberg, P. O., Crounse, J. D., Teng, A. P., Nguyen, T. B., St. Clair, J. M., Cohen, R. C., Romer, P., Nault, B. A., Wooldridge, P. J., Jimenez, J. L., Campuzano-Jost, P., Day, D. A., Hu, W., Shepson, P. B., Xiong, F., Blake, D. R., Goldstein, A. H., Misztal, P. K., Hanisco, T. F., Wolfe, G. M., Ryerson, T. B., Wisthaler, A., and Mikoviny, T.: Organic nitrate chemistry and its implications for nitrogen budgets in an isoprene- and monoterpene-rich atmosphere: constraints from aircraft (SEAC4RS) and ground-based (SOAS) observations in the Southeast US, Atmos. Chem. Phys., 16, 5969–5991, https://doi.org/10.5194/acp-16-5969-2016, 2016. a
Fortems‐Cheiney, A., Dufour, G., Hamaoui‐Laguel, L., Foret, G., Siour, G., Van Damme, M., Meleux, F., Coheur, P. F., Clerbaux, C., Clarisse, L., Favez, O., Wallasch, M., and Beekmann, M.: Unaccounted variability in NH3 agricultural sources detected by IASI contributing to European spring haze episode, Geophys. Res. Lett., 43, 5475–5482, 2016. a, b
Fujita, E. M., Campbell, D. E., Zielinska, B., Sagebiel, J. C., Bowen, J. L., Goliff, W. S., Stockwell, W. R., and Lawson, D. R.: Diurnal and weekday variations in the source contributions of ozone precursors in California’s South Coast Air Basin, J. Air Waste Ma., 53, 844–863, 2003. a
Fuzzi, S., Baltensperger, U., Carslaw, K., Decesari, S., Denier van der Gon, H., Facchini, M. C., Fowler, D., Koren, I., Langford, B., Lohmann, U., Nemitz, E., Pandis, S., Riipinen, I., Rudich, Y., Schaap, M., Slowik, J. G., Spracklen, D. V., Vignati, E., Wild, M., Williams, M., and Gilardoni, S.: Particulate matter, air quality and climate: lessons learned and future needs, Atmos. Chem. Phys., 15, 8217–8299, https://doi.org/10.5194/acp-15-8217-2015, 2015. a
Gaubert, B., Bouarar, I., Doumbia, T., Liu, Y., Stavrakou, T., Deroubaix, A., Darras, S., Elguindi, N., Granier, C., Lacey, F., Müller, J. F., Shi, X., Tilmes, S., Wang, T., and Brasseur G. P.: Global changes in secondary atmospheric pollutants during the 2020 COVID-19 pandemic, J. Geophys. Res.-Atmos., 126, e2020JD034213, https://doi.org/10.1029/2020JD034213, 2021. a, b, c, d, e
Gensheimer, J., Turner, A. J., Shekhar, A., Wenzel, A., Keutsch, F. N., and Chen, J.: What are different measures of mobility telling us about surface transportation CO2 emissions during the COVID-19 pandemic?, J. Geophys. Res.-Atmos., 126, e2021JD034664, https://doi.org/10.1029/2021JD034664, 2021. a, b
Geyer, A., Alicke, B., Konrad, S., Schmitz, T., Stutz, J., and Platt, U.: Chemistry and oxidation capacity of the nitrate radical in the continental boundary layer near Berlin, J. Geophys. Res.-Atmos., 106, 8013–8025, 2001. a
Goldberg, D. L., Anenberg, S. C., Griffin, D., McLinden, C. A., Lu, Z., and Streets, D. G.: Disentangling the impact of the COVID-19 lockdowns on urban NO2 from natural variability, Geophys. Res. Lett., 47, e2020GL089269, https://doi.org/10.1029/2020GL089269, 2020. a
Grange, S. K., Lee, J. D., Drysdale, W. S., Lewis, A. C., Hueglin, C., Emmenegger, L., and Carslaw, D. C.: COVID-19 lockdowns highlight a risk of increasing ozone pollution in European urban areas, Atmos. Chem. Phys., 21, 4169–4185, https://doi.org/10.5194/acp-21-4169-2021, 2021. a, b
Guevara, M., Jorba, O., Soret, A., Petetin, H., Bowdalo, D., Serradell, K., Tena, C., Denier van der Gon, H., Kuenen, J., Peuch, V.-H., and Pérez García-Pando, C.: Time-resolved emission reductions for atmospheric chemistry modelling in Europe during the COVID-19 lockdowns, Atmos. Chem. Phys., 21, 773–797, https://doi.org/10.5194/acp-21-773-2021, 2021. a, b, c, d
Hallquist, M., Wenger, J. C., Baltensperger, U., Rudich, Y., Simpson, D., Claeys, M., Dommen, J., Donahue, N. M., George, C., Goldstein, A. H., Hamilton, J. F., Herrmann, H., Hoffmann, T., Iinuma, Y., Jang, M., Jenkin, M. E., Jimenez, J. L., Kiendler-Scharr, A., Maenhaut, W., McFiggans, G., Mentel, Th. F., Monod, A., Prévôt, A. S. H., Seinfeld, J. H., Surratt, J. D., Szmigielski, R., and Wildt, J.: The formation, properties and impact of secondary organic aerosol: current and emerging issues, Atmos. Chem. Phys., 9, 5155–5236, https://doi.org/10.5194/acp-9-5155-2009, 2009. a
Hammer, M. S., van Donkelaar, A., Martin, R. V., McDuffie, E. E., Lyapustin, A., Sayer, A. M., Hsu, N. C., Levy, R. C., Garay, M. J., Kalashnikova, O. V., and Kahn, R. A: Effects of COVID-19 lockdowns on fine particulate matter concentrations, Science Advances, 7, eabg7670, https://doi.org/10.1126/sciadv.abg7670, 2021. a, b, c
He, C., Hong, S., Zhang, L., Mu, H., Xin, A., Zhou, Y., Liu, J., Liu, N., Su, Y., Tian, Y., Ke, B., Wang, Y., and Yang, L.: Global, continental, and national variation in PM2.5, O3, and NO2 concentrations during the early 2020 COVID-19 lockdown, Atmos. Pollut. Res., 12, 136–145, 2021. a, b
Hersbach, H., Bell, B., Berrisford, P., Hirahara, S., Horányi, A., Muñoz‐Sabater, J., Nicolas, J., Peubey, C., Radu, R., Schepers, D., Simmons, A., Soci, C., Abdalla, S., Abellan, X., Balsamo, G., Bechtold, P., Biavati, G., Bidlot, J., Bonavita, M., Chiara, G. D., Dahlgren, P., Dee, D., Diamantakis, M., Dragani, R., Flemming, J., Forbes, R., Fuentes,., Geer, A., Haimberger, L., Healy, S., Hogan, R. J., Hólm, E., Janisková, M., Keeley, S., Laloyaux,P., Lopez, P., Lupu, C., Radnoti, G., Rosnay, P. D., Rozum, I., Vamborg, F., Villaume, S., and Thépaut, J. N.: The ERA5 global reanalysis, Q. J. Roy. Meteor. Soc., 146, 1999–2049, 2020. a
Higham, J., Ramírez, C. A., Green, M., and Morse, A.: UK COVID-19 lockdown: 100 days of air pollution reduction?, Air Qual. Atmos. Hlth., 14, 325–332, 2021. a
Hoesly, R. M., Smith, S. J., Feng, L., Klimont, Z., Janssens-Maenhout, G., Pitkanen, T., Seibert, J. J., Vu, L., Andres, R. J., Bolt, R. M., Bond, T. C., Dawidowski, L., Kholod, N., Kurokawa, J.-I., Li, M., Liu, L., Lu, Z., Moura, M. C. P., O'Rourke, P. R., and Zhang, Q.: Historical (1750–2014) anthropogenic emissions of reactive gases and aerosols from the Community Emissions Data System (CEDS), Geosci. Model Dev., 11, 369–408, https://doi.org/10.5194/gmd-11-369-2018, 2018. a
Hörmann, S., Jammoul, F., Kuenzer, T., and Stadlober, E.: Separating the impact of gradual lockdown measures on air pollutants from seasonal variability, Atmos. Pollut. Res., 12, 84–92, 2021. a
Huang, X., Ding, A., Gao, J., Zheng, B., Zhou, D., Qi, X., Tang, R., Wang, J., Ren, C., Nie, W., Chi, X., Xu, Z., Chen, L., Li, Y., Che, F., Pang, N., Wang, H., Tong, D., Qin, W., Cheng, W., Liu, W., Fu, Q., Liu, B., Chai, F., Davis, S. J., Zhang, Q., and He, K.: Enhanced secondary pollution offset reduction of primary emissions during COVID-19 lockdown in China, Natl. Sci. Rev., 8, nwaa137, https://doi.org/10.1093/nsr/nwaa137, 2021. a
Hudman, R. C., Moore, N. E., Mebust, A. K., Martin, R. V., Russell, A. R., Valin, L. C., and Cohen, R. C.: Steps towards a mechanistic model of global soil nitric oxide emissions: implementation and space based-constraints, Atmos. Chem. Phys., 12, 7779–7795, https://doi.org/10.5194/acp-12-7779-2012, 2012. a
IASI: Atmospheric composition Level 2 data products retrieved from the IASI/Metop observations, IASI [data set], https://iasi.aeris-data.fr/catalog/, last access: 15 January 2022. a
Jacob, D. J.: Introduction to atmospheric chemistry, Princeton University Press, https://doi.org/10.1515/9781400841547, 1999. a
Jacobson, M. Z.: Fundamentals of atmospheric modeling, Cambridge University Press, ISBN 9780521548656, 1999. a
Jiménez, P., Parra, R., Gasso, S., and Baldasano, J. M.: Modeling the ozone weekend effect in very complex terrains: a case study in the Northeastern Iberian Peninsula, Atmos. Environ., 39, 429–444, 2005. a
Juda-Rezler, K., Reizer, M., Maciejewska, K., Błaszczak, B., and Klejnowski, K.: Characterization of atmospheric PM2.5 sources at a Central European urban background site, Sci. Total Environ., 713, 136729, https://doi.org/10.1016/j.scitotenv.2020.136729, 2020. a
Kang, M., Zhang, J., Zhang, H., and Ying, Q.: On the Relevancy of Observed Ozone Increase during COVID-19 Lockdown to Summertime Ozone and PM2.5 Control Policies in China, Environ. Sci. Tech. Lett., 8, 289–294, 2021. a
Kang, Y.-H., You, S., Bae, M., Kim, E., Son, K., Bae, C., Kim, Y., Kim, B.-U., Kim, H. C., and Kim, S.: The impacts of COVID-19, meteorology, and emission control policies on PM2.5 drops in Northeast Asia, Sci. Rep.-UK, 10, 1–8, 2020. a
Keller, C. A., Evans, M. J., Knowland, K. E., Hasenkopf, C. A., Modekurty, S., Lucchesi, R. A., Oda, T., Franca, B. B., Mandarino, F. C., Díaz Suárez, M. V., Ryan, R. G., Fakes, L. H., and Pawson, S.: Global impact of COVID-19 restrictions on the surface concentrations of nitrogen dioxide and ozone, Atmos. Chem. Phys., 21, 3555–3592, https://doi.org/10.5194/acp-21-3555-2021, 2021. a
Kim, Y. J., Spak, S. N., Carmichael, G. R., Riemer, N., and Stanier, C. O.: Modeled aerosol nitrate formation pathways during wintertime in the Great Lakes region of North America, J. Geophys. Res.-Atmos., 119, 12–420, 2014. a
Koukouli, M.-E., Skoulidou, I., Karavias, A., Parcharidis, I., Balis, D., Manders, A., Segers, A., Eskes, H., and van Geffen, J.: Sudden changes in nitrogen dioxide emissions over Greece due to lockdown after the outbreak of COVID-19, Atmos. Chem. Phys., 21, 1759–1774, https://doi.org/10.5194/acp-21-1759-2021, 2021. a
Kroll, J. H., Heald, C. L., Cappa, C. D., Farmer, D. K., Fry, J. L., Murphy, J. G., and Steiner, A. L.: The complex chemical effects of COVID-19 shutdowns on air quality, Nat. Chem., 12, 777–779, 2020. a
Kuttippurath, J., Singh, A., Dash, S. P., Mallick, N., Clerbaux, C., Van Damme, M., Clarisse, L., Coheur, P. F., Raj, S., Abbhishek, K., and Varikoden, H.: Record high levels of atmospheric ammonia over India: Spatial and temporal analyses, Sci. Total Environ., 740, 139986, https://doi.org/10.1016/j.scitotenv.2020.139986, 2020. a
Lee, J. D., Drysdale, W. S., Finch, D. P., Wilde, S. E., and Palmer, P. I.: UK surface NO2 levels dropped by 42 % during the COVID-19 lockdown: impact on surface O3, Atmos. Chem. Phys., 20, 15743–15759, https://doi.org/10.5194/acp-20-15743-2020, 2020. a
Le Quéré, C., Jackson, R. B., Jones, M. W., Smith, A. J., Abernethy, S., Andrew, R. M., De-Gol, A. J., Willis, D. R., Shan, Y., Canadell, J. G., Friedlingstein, P., Creutzig, F., and Peters, G. P.: Temporary reduction in daily global CO2 emissions during the COVID-19 forced confinement, Nat. Clim. Change, 10, 1–7, 2020. a
Liu, L., Bei, N., Hu, B., Wu, J., Liu, S., Li, X., Wang, R., Liu, Z., Shen, Z., and Li, G.: Wintertime nitrate formation pathways in the north China plain: Importance of N2O5 heterogeneous hydrolysis, Environ. Pollut., 266, 115287, https://doi.org/10.1016/j.envpol.2020.115287, 2020. a, b
Marais, E. A., Jacob, D. J., Jimenez, J. L., Campuzano-Jost, P., Day, D. A., Hu, W., Krechmer, J., Zhu, L., Kim, P. S., Miller, C. C., Fisher, J. A., Travis, K., Yu, K., Hanisco, T. F., Wolfe, G. M., Arkinson, H. L., Pye, H. O. T., Froyd, K. D., Liao, J., and McNeill, V. F.: Aqueous-phase mechanism for secondary organic aerosol formation from isoprene: application to the southeast United States and co-benefit of SO2 emission controls, Atmos. Chem. Phys., 16, 1603–1618, https://doi.org/10.5194/acp-16-1603-2016, 2016. a
Matthias, V., Quante, M., Arndt, J. A., Badeke, R., Fink, L., Petrik, R., Feldner, J., Schwarzkopf, D., Link, E.-M., Ramacher, M. O. P., and Wedemann, R.: The role of emission reductions and the meteorological situation for air quality improvements during the COVID-19 lockdown period in central Europe, Atmos. Chem. Phys., 21, 13931–13971, https://doi.org/10.5194/acp-21-13931-2021, 2021. a, b, c, d
Mendez-Espinosa, J. F., Rojas, N. Y., Vargas, J., Pachón, J. E., Belalcazar, L. C., and Ramírez, O.: Air quality variations in Northern South America during the COVID-19 lockdown, Sci. Total Environ., 749, 141621, https://doi.org/10.1016/j.scitotenv.2020.141621, 2020. a
Menut, L., Bessagnet, B., Siour, G., Mailler, S., Pennel, R., and Cholakian, A.: Impact of lockdown measures to combat Covid-19 on air quality over western Europe, Sci. Total Environ., 741, 140426, https://doi.org/10.1016/j.scitotenv.2020.140426, 2020. a, b
Mollner, A. K., Valluvadasan, S., Feng, L., Sprague, M. K., Okumura, M., Milligan, D. B., Bloss, W. J., Sander, S. P., Martien, P. T., Harley, R. A., McCoy, A. B., and Carter, W. P. L.: Rate of gas phase association of hydroxyl radical and nitrogen dioxide, Science, 330, 646–649, 2010. a
Mozurkewich, M.: The dissociation constant of ammonium nitrate and its dependence on temperature, relative humidity and particle size, Atmos. Environ. A-Gen., 27, 261–270, 1993. a
Murray, L. T.: Lightning NOx and impacts on air quality, Current Pollution Reports, 2, 115–133, 2016. a
Ordóñez, C., Garrido-Perez, J. M., and García-Herrera, R.: Early spring near-surface ozone in Europe during the COVID-19 shutdown: Meteorological effects outweigh emission changes, Sci. Total Environ., 747, 141322, https://doi.org/10.1016/j.scitotenv.2020.141322, 2020. a
Pathakoti, M., Muppalla, A., Hazra, S., D. Venkata, M., A. Lakshmi, K., K. Sagar, V., Shekhar, R., Jella, S., M. V. Rama, S. S., and Vijayasundaram, U.: Measurement report: An assessment of the impact of a nationwide lockdown on air pollution – a remote sensing perspective over India, Atmos. Chem. Phys., 21, 9047–9064, https://doi.org/10.5194/acp-21-9047-2021, 2021. a
Pay, M. T., Jiménez-Guerrero, P., and Baldasano, J. M.: Assessing sensitivity regimes of secondary inorganic aerosol formation in Europe with the CALIOPE-EU modeling system, Atmos. Environ., 51, 146–164, 2012. a
Petetin, H., Sciare, J., Bressi, M., Gros, V., Rosso, A., Sanchez, O., Sarda-Estève, R., Petit, J.-E., and Beekmann, M.: Assessing the ammonium nitrate formation regime in the Paris megacity and its representation in the CHIMERE model, Atmos. Chem. Phys., 16, 10419–10440, https://doi.org/10.5194/acp-16-10419-2016, 2016. a, b
Petetin, H., Bowdalo, D., Soret, A., Guevara, M., Jorba, O., Serradell, K., and Pérez García-Pando, C.: Meteorology-normalized impact of the COVID-19 lockdown upon NO2 pollution in Spain, Atmos. Chem. Phys., 20, 11119–11141, https://doi.org/10.5194/acp-20-11119-2020, 2020. a
Putaud, J.-P., Pozzoli, L., Pisoni, E., Martins Dos Santos, S., Lagler, F., Lanzani, G., Dal Santo, U., and Colette, A.: Impacts of the COVID-19 lockdown on air pollution at regional and urban background sites in northern Italy, Atmos. Chem. Phys., 21, 7597–7609, https://doi.org/10.5194/acp-21-7597-2021, 2021. a
Qu, Z., Jacob, D. J., Silvern, R. F., Shah, V., Campbell, P. C., Valin, L. C., and Murray, L. T.: US COVID-19 shutdown demonstrates importance of background NO2 in inferring NOx emissions from satellite NO2 observations, Geophys. Res. Lett., 48, e2021GL092783, https://doi.org/10.1029/2021GL092783, 2021. a, b
Ramanantenasoa, M. M. J., Gilliot, J.-M., Mignolet, C., Bedos, C., Mathias, E., Eglin, T., Makowski, D., and Génermont, S.: A new framework to estimate spatio-temporal ammonia emissions due to nitrogen fertilization in France, Sci. Total Environ., 645, 205–219, 2018. a
Renner, E. and Wolke, R.: Modelling the formation and atmospheric transport of secondary inorganic aerosols with special attention to regions with high ammonia emissions, Atmos. Environ., 44, 1904–1912, 2010. a
Russell, A. G., Cass, G. R., and Seinfeld, J. H.: On some aspects of nighttime atmospheric chemistry, Environ. Sci. Technol., 20, 1167–1172, 1986. a
Salameh, D., Detournay, A., Pey, J., Pérez, N., Liguori, F., Saraga, D., Bove, M. C., Brotto, P., Cassola, F., Massabò, D., Latella, A., Pillon, S., Formenton, G., Patti, S., Armengaud, A., Piga, D., Jaffrezo, J. L., Bartzis. J., Tolis. E., Prati., P., Querol, X., Wortham, H., and Marchand, N.: PM2.5 chemical composition in five European Mediterranean cities: a 1-year study, Atmos. Res., 155, 102–117, 2015. a
Samek, L., Stegowski, Z., Styszko, K., Furman, L., Zimnoch, M., Skiba, A., Kistler, M., Kasper-Giebl, A., Rozanski, K., and Konduracka, E.: Seasonal variations of chemical composition of PM2.5 fraction in the urban area of Krakow, Poland: PMF source attribution, Air Qual. Atmos. Hlth., 13, 89–96, 2020. a
Scarlat, N., Fahl, F., Dallemand, J.-F., Monforti, F., and Motola, V.: A spatial analysis of biogas potential from manure in Europe, Renew. Sust. Energ. Rev., 94, 915–930, 2018. a
Schaap, M., van Loon, M., ten Brink, H. M., Dentener, F. J., and Builtjes, P. J. H.: Secondary inorganic aerosol simulations for Europe with special attention to nitrate, Atmos. Chem. Phys., 4, 857–874, https://doi.org/10.5194/acp-4-857-2004, 2004. a
Schiferl, L. D., Heald, C. L., Van Damme, M., Clarisse, L., Clerbaux, C., Coheur, P.-F., Nowak, J. B., Neuman, J. A., Herndon, S. C., Roscioli, J. R., and Eilerman, S. J.: Interannual variability of ammonia concentrations over the United States: sources and implications, Atmos. Chem. Phys., 16, 12305–12328, https://doi.org/10.5194/acp-16-12305-2016, 2016. a, b, c
Schumann, U., Poll, I., Teoh, R., Koelle, R., Spinielli, E., Molloy, J., Koudis, G. S., Baumann, R., Bugliaro, L., Stettler, M., and Voigt, C.: Air traffic and contrail changes over Europe during COVID-19: a model study, Atmos. Chem. Phys., 21, 7429–7450, https://doi.org/10.5194/acp-21-7429-2021, 2021. a
Seinfeld, J. H. and Pankow, J. F.: Organic atmospheric particulate material, Annu. Rev. Phys. Chem., 54, 121–140, 2003. a
Shah, V., Jaeglé, L., Thornton, J. A., Lopez-Hilfiker, F. D., Lee, B. H., Schroder, J. C., Campuzano-Jost, P., Jimenez, J. L., Guo, H., Sullivan, A. P., Weber, R. J., Green, J. R., Fiddler, M. N., Bililign, S., Campos, T. L., Stell, M., Weinheimer, A. J., Montzka, D. D., and Brown S. S.: Chemical feedbacks weaken the wintertime response of particulate sulfate and nitrate to emissions reductions over the eastern United States, P. Natl. Acad. Sci. USA, 115, 8110–8115, 2018. a
Shah, V., Jacob, D. J., Li, K., Silvern, R. F., Zhai, S., Liu, M., Lin, J., and Zhang, Q.: Effect of changing NOx lifetime on the seasonality and long-term trends of satellite-observed tropospheric NO2 columns over China, Atmos. Chem. Phys., 20, 1483–1495, https://doi.org/10.5194/acp-20-1483-2020, 2020. a, b
Sharma, M., Kishore, S., Tripathi, S., and Behera, S.: Role of atmospheric ammonia in the formation of inorganic secondary particulate matter: a study at Kanpur, India, J. Atmos. Chem., 58, 1–17, 2007. a
Sillman, S.: The relation between ozone, NOx and hydrocarbons in urban and polluted rural environments, Atmos. Environ., 33, 1821–1845, 1999. a
Sillman, S., Logan, J. A., and Wofsy, S. C.: The sensitivity of ozone to nitrogen oxides and hydrocarbons in regional ozone episodes, J. Geophys. Res.-Atmos., 95, 1837–1851, 1990. a
SO2 emission (EEA), Indicator Assessment:Sulphur dioxide (SO2) emissions. https://www.eea.europa.eu/data-and-maps/indicators/eea-32-sulphur-dioxide-so2-emissions-1/assessment-3 (last access: 15 January 2022), 2021. a
Solberg, S., Walker, S.-E., Schneider, P., and Guerreiro, C.: Quantifying the Impact of the Covid-19 Lockdown Measures on Nitrogen Dioxide Levels throughout Europe, Atmosphere, 12, 131, https://doi.org/10.3390/atmos12020131, 2021. a
Souri, A. H., Chance, K., Bak, J., Nowlan, C. R., González Abad, G., Jung, Y., Wong, D. C., Mao, J., and Liu, X.: Unraveling pathways of elevated ozone induced by the 2020 lockdown in Europe by an observationally constrained regional model using TROPOMI, Atmos. Chem. Phys., 21, 18227–18245, https://doi.org/10.5194/acp-21-18227-2021, 2021. a
Squizzato, S., Masiol, M., Brunelli, A., Pistollato, S., Tarabotti, E., Rampazzo, G., and Pavoni, B.: Factors determining the formation of secondary inorganic aerosol: a case study in the Po Valley (Italy), Atmos. Chem. Phys., 13, 1927–1939, https://doi.org/10.5194/acp-13-1927-2013, 2013. a
Steinfeld, J. I.: Atmospheric chemistry and physics: from air pollution to climate change, Environment: Science and Policy for Sustainable Development, 40, 26–26, 1998. a
Steinmetz, H., Batzdorfer, V., and Bosnjak, M.: The ZPID lockdown measures dataset for Germany, ZPID Science Information Online [data set], 20, https://doi.org/10.23668/psycharchives.6679, 2020. a
Stephens, S., Madronich, S., Wu, F., Olson, J. B., Ramos, R., Retama, A., and Muñoz, R.: Weekly patterns of México City's surface concentrations of CO, NOx, PM10 and O3 during 1986–2007, Atmos. Chem. Phys., 8, 5313–5325, https://doi.org/10.5194/acp-8-5313-2008, 2008. a
Tai, A. P. K., Mickley, L. J., and Jacob, D. J.: Impact of 2000–2050 climate change on fine particulate matter (PM2.5) air quality inferred from a multi-model analysis of meteorological modes, Atmos. Chem. Phys., 12, 11329–11337, https://doi.org/10.5194/acp-12-11329-2012, 2012. a
Theys, N., De Smedt, I., Yu, H., Danckaert, T., van Gent, J., Hörmann, C., Wagner, T., Hedelt, P., Bauer, H., Romahn, F., Pedergnana, M., Loyola, D., and Van Roozendael, M.: Sulfur dioxide retrievals from TROPOMI onboard Sentinel-5 Precursor: algorithm theoretical basis, Atmos. Meas. Tech., 10, 119–153, https://doi.org/10.5194/amt-10-119-2017, 2017. a
Turner, A. J., Kim, J., Fitzmaurice, H., Newman, C., Worthington, K., Chan, K., Wooldridge, P. J., Köehler, P., Frankenberg, C., and Cohen, R. C.: Observed Impacts of COVID-19 on Urban CO2 Emissions, Geophys. Res. Lett., 47, e2020GL090037, https://doi.org/10.1029/2020GL090037, 2020. a
Viatte, C., Wang, T., Van Damme, M., Dammers, E., Meleux, F., Clarisse, L., Shephard, M. W., Whitburn, S., Coheur, P. F., Cady-Pereira, K. E., and Clerbaux, C.: Atmospheric ammonia variability and link with particulate matter formation: a case study over the Paris area, Atmos. Chem. Phys., 20, 577–596, https://doi.org/10.5194/acp-20-577-2020, 2020. a, b, c, d, e, f
Viatte, C., Petit, J. E., Yamanouchi, S., Van Damme, M., Doucerain, C., Germain-Piaulenne, E., Gros, V., Favez, O., Clarisse, L., Coheur, P. F., Strong, K., and Clerbaux. C.: Ammonia and PM2.5 Air Pollution in Paris during the 2020 COVID Lockdown, Atmosphere, 12, 160, https://doi.org/10.3390/atmos12020160, 2021. a, b
Von Schneidemesser, E., Monks, P. S., and Plass-Duelmer, C.: Global comparison of VOC and CO observations in urban areas, Atmos. Environ., 44, 5053–5064, 2010. a
Wang, L., Wang, J., and Fang, C.: Assessing the Impact of Lockdown on Atmospheric Ozone Pollution Amid the First Half of 2020 in Shenyang, China, Int. J. Env. Res. Pub. Hea., 17, 9004, https://doi.org/10.3390/ijerph17239004, 2020. a
Wang, S., Nan, J., Shi, C., Fu, Q., Gao, S., Wang, D., Cui, H., Saiz-Lopez, A., and Zhou, B.: Atmospheric ammonia and its impacts on regional air quality over the megacity of Shanghai, China, Sci. Rep,-UK, 5, 1–13, 2015. a
Wang, W., van der A, R., Ding, J., van Weele, M., and Cheng, T.: Spatial and temporal changes of the ozone sensitivity in China based on satellite and ground-based observations, Atmos. Chem. Phys., 21, 7253–7269, https://doi.org/10.5194/acp-21-7253-2021, 2021. a
Wang, Y., Zhang, Q. Q., He, K., Zhang, Q., and Chai, L.: Sulfate-nitrate-ammonium aerosols over China: response to 2000–2015 emission changes of sulfur dioxide, nitrogen oxides, and ammonia, Atmos. Chem. Phys., 13, 2635–2652, https://doi.org/10.5194/acp-13-2635-2013, 2013. a
Watson, J. G., Chow, J. C., Lurmann, F. W., and Musarra, S. P.: Ammonium nitrate, nitric acid, and ammonia equilibrium in wintertime Phoenix, Arizona, Air & Waste, 44, 405–412, 1994. a
Webb, J., Menzi, H., Pain, B., Misselbrook, T., Dämmgen, U., Hendriks, H., and Döhler, H.: Managing ammonia emissions from livestock production in Europe, Environ. Pollut., 135, 399–406, 2005. a
van der Werf, G. R., Randerson, J. T., Giglio, L., van Leeuwen, T. T., Chen, Y., Rogers, B. M., Mu, M., van Marle, M. J. E., Morton, D. C., Collatz, G. J., Yokelson, R. J., and Kasibhatla, P. S.: Global fire emissions estimates during 1997–2016, Earth Syst. Sci. Data, 9, 697–720, https://doi.org/10.5194/essd-9-697-2017, 2017. a
Womack, C. C., McDuffie, E. E., Edwards, P. M., Bares, R., de Gouw, J. A., Docherty, K. S., Dubé, W. P., Fibiger, D. L., Franchin, A., Gilman, J. B., Goldberger, L., Lee, B. H., Lin, J. C., Long, R., Middlebrook, A. M., Millet, D. B., Moravek, A., Murphy, J. G., Quinn, P. K., Riedel, T. P., Roberts, J. M., Thornton, J. A., Valin, L. C., Veres, P. R., Whitehill, A. R., Wild, R. J., Warneke, C., Yuan, B., Baasandorj, M., and Brown, S. S.: An odd oxygen framework for wintertime ammonium nitrate aerosol pollution in urban areas: NOx and VOC control as mitigation strategies, Geophys. Res. Lett., 46, 4971–4979, 2019. a
Wu, S.-Y., Hu, J.-L., Zhang, Y., and Aneja, V. P.: Modeling atmospheric transport and fate of ammonia in North Carolina – Part II: Effect of ammonia emissions on fine particulate matter formation, Atmos. Environ., 42, 3437–3451, 2008. a
Wu, Y., Gu, B., Erisman, J. W., Reis, S., Fang, Y., Lu, X., and Zhang, X.: PM2.5 pollution is substantially affected by ammonia emissions in China, Environ. Pollut., 218, 86–94, 2016. a
Yan, C., Tham, Y. J., Zha, Q., Wang, X., Xue, L., Dai, J., Wang, Z., and Wang, T.: Fast heterogeneous loss of N2O5 leads to significant nighttime NOx removal and nitrate aerosol formation at a coastal background environment of southern China, Sci. Total Environ., 677, 637–647, 2019. a
Yarwood, G., Stoeckenius, T. E., Heiken, J. G., and Dunker, A. M.: Modeling weekday/weekend ozone differences in the Los Angeles region for 1997, J. Air Waste Ma., 53, 864–875, 2003. a
Yin, H., Lu, X., Sun, Y., Li, K., Gao, M., Zheng, B., and Liu, C.: Unprecedented decline in summertime surface ozone over eastern China in 2020 comparably attributable to anthropogenic emission reductions and meteorology, Environ. Res. Lett., 16, 124069, https://doi.org/10.1088/1748-9326/ac3e22, 2021. a
Zhai, S., Jacob, D. J., Wang, X., Liu, Z., Wen, T., Shah, V., Li, K., Moch, J. M., Bates, K. H., Song, S., Shen, L., Zhang, Y., Luo, G., Yu, F., Sun, Y., Wang, L., Qi, M., Tao, J., Gui, K., Xu, H., Zhang, Q., Zhao, T., Wang, Y., Lee, H. C., Choi, H., and Liao, H.: Control of particulate nitrate air pollution in China, Nat. Geosci., 14, 1–7, 2021. a
Zhang, R., Wang, G., Guo, S., Zamora, M. L., Ying, Q., Lin, Y., Wang, W., Hu, M., and Wang, Y.: Formation of urban fine particulate matter, Chem. Rev., 115, 3803–3855, 2015. a, b


