the Creative Commons Attribution 4.0 License.
the Creative Commons Attribution 4.0 License.
The long-term trend and production sensitivity change in the US ozone pollution from observations and model simulations
Chao Sun
Zhining Tao
Daniel Q. Tong
We investigated the ozone pollution trend and its sensitivity to key precursors from 1990 to 2015 in the United States using long-term EPA Air Quality System (AQS) observations and mesoscale simulations. The modeling system, a coupled regional climate–air quality model (CWRF-CMAQ; Climate-Weather Research Forecast and the Community Multiscale Air Quality), captured well the summer surface ozone pollution during the past decades, having a mean slope of linear regression with AQS observations of ∼0.75. While the AQS network has limited spatial coverage and measures only a few key chemical species, CWRF-CMAQ provides comprehensive simulations to enable a more rigorous study of the change in ozone pollution and chemical sensitivity. Analysis of seasonal variations and diurnal cycle of ozone observations showed that peak ozone concentrations in the summer afternoon decreased ubiquitously across the United States, up to 0.5 ppbv yr−1 in major non-attainment areas such as Los Angeles, while concentrations at certain hours such as the early morning and late afternoon increased slightly. Consistent with the AQS observations, CMAQ simulated a similar decreasing trend of peak ozone concentrations in the afternoon, up to 0.4 ppbv yr−1, and increasing ozone trends in the early morning and late afternoon. A monotonically decreasing trend (up to 0.5 ppbv yr−1) in the odd oxygen () concentrations are simulated by CMAQ at all daytime hours. This result suggests that the increased ozone in the early morning and late afternoon was likely caused by reduced NO–O3 titration, driven by continuous anthropogenic NOx emission reductions in the past decades. Furthermore, the CMAQ simulations revealed a shift in chemical regimes of ozone photochemical production. From 1990 to 2015, surface ozone production in some metropolitan areas, such as Baltimore, has transited from a VOC-sensitive environment (>50 % probability) to a NOx-sensitive regime. Our results demonstrated that the long-term CWRF-CMAQ simulations can provide detailed information of the ozone chemistry evolution under a changing climate and may partially explain the US ozone pollution responses to regional and national regulations.
- Article
(12326 KB) - Full-text XML
-
Supplement
(425 KB) - BibTeX
- EndNote
Tropospheric ozone (O3) is one of the major air pollutants, regulated by the US Environmental Protection Agency (EPA), that pose myriad threats to public health and the environment (Adams et al., 1989; WHO, 2003; Ashmore, 2005; Anderson, 2009; Jerrett et al., 2009). It is also an important greenhouse gas due to the absorption of thermal radiation, affecting the climate (Fishman et al., 1979; Ramanathan and Dickinson, 1979; IPCC, 2013). The major source of tropospheric ozone is photochemical production from ozone precursors such as carbon monoxide (CO), volatile organic compounds (VOCs) and nitrogen oxides (NOx) in the presence of sunlight (Crutzen, 1974; National Research Council, 1991; Jacob, 2000; USEPA, 2006), while downward transport of stratospheric air mass contributes substantially to ozone concentrations in the upper troposphere (Levy et al., 1985; Holton et al., 1995; Stevenson et al., 2006). In the past decades, ozone pollution in the United States has been reduced substantially due to regulations on anthropogenic emissions of ozone precursors (Oltmans et al., 2006; Lefohn et al., 2008, 2010; Cooper et al., 2012, 2014; He et al., 2013), although some studies suggested no trend or slight increases in some rural areas (Jaffe and Ray, 2007; Lefohn et al., 2010; Cooper et al., 2012). Most of these analyses focused on peak ozone concentrations, e.g., daily maximum 8 h average ozone (MDA8), during summer, but studies of trends in seasonal and diurnal patterns of ozone pollution are limited. He et al. (2019) analyzed measurements from four monitoring sites in the eastern United States and found different ozone trends between rural and urban sites from the late 1990s to the early 2010s, including some increases at certain hours, suggesting effects of national regulations could be regionally dependent. Thus, it is important to extend our study to other regions of the United States in a longer time period.
The nonmonotonic trends in United States ozone pollution could be caused by the complex nonlinear chemistry of ozone production involving NOx and VOCs (Logan et al., 1981; Finlayson-Pitts and Pitts, 1999; Seinfeld and Pandis, 2006). With continuous reduction in anthropogenic emissions of ozone precursors mainly NOx and VOCs in the United States, we need to better understand the photochemical regime change for local ozone production (i.e., ozone production sensitivity), because air pollution regulations could have different effects under NOx-sensitive and VOC-sensitive environments (Dodge, 1987; Kleinman, 1994). For instance, under a VOC-sensitive photochemical regime, the decrease in NOx emissions has limited impacts on improving ozone pollution. Previous studies have developed photochemical indicators to identify the ozone production sensitivity (Sillman, 1995; Sillman et al., 1997; Tonnesen and Dennis, 2000b, a; Sillman and He, 2002). Sillman (1999) found the ratio of VOCs and NOx (VOC ∕ NOx) has a typical value of less than 4 for the VOC-sensitive environment and higher than 15 for the NOx-sensitive regime. Observation-based studies of ozone production sensitivity relied on research-grade measurements of ozone precursors and photochemical intermediates that are not routinely measured by air quality management agencies such as the US EPA. These species include reactive nitrogen compounds (NOy), nitric acid (HNO3) and hydrogen peroxide (H2O2), normally observed during field campaigns (e.g., Shon et al., 2007; Peng et al., 2011), which only covered limited areas in certain periods. Studies based on air quality models (AQMs) could identify the ozone production regimes at regional scales (Sillman et al., 1997; Sillman and He, 2002; Zhang et al., 2009a, b; Xie et al., 2011), but the simulation periods were usually short (less than 1 year) and thus could not capture the long-term change in ozone production sensitivity.
Regional AQMs are widely used for investigating the US air quality (Tagaris et al., 2007; Tang et al., 2009; Hogrefe et al., 2011; Pour-Biazar et al., 2011; He et al., 2016a, 2018). They incorporate finer resolutions, more detailed emissions and more explicit chemical mechanism than global chemical transport models to better resolve characteristics of tropospheric and surface dynamics, physical and chemical processes that are essential for air quality. Our group has developed and used coupled regional climate–air quality models to study air quality variations under a changing regional climate (Huang et al., 2007; Zhu and Liang, 2013; He et al., 2016a, 2018). Our previous studies showed the ability of the model to capture the decadal US air quality change (e.g., Zhu and Liang, 2013). In this study, we coupled the latest Climate-Weather Research Forecast (CWRF) and the EPA Community Multiscale Air Quality (CMAQ) models. CWRF has demonstrated substantial improvement in downscaling regional climate and extremes (Liang et al., 2012, 2019; Chen et al., 2016; Liu et al., 2016; Sun and Liang, 2020a, b) and thus can provide more realistic weather conditions for AQMs in order to produce more credible air quality simulations.
To supplement the limited observations in both spatial coverage and chemical species, we conducted a continuous 26-year CWRF-CMAQ simulation from 1990 to 2015 for a more rigorous analysis of long-term US ozone trend. The model performance of the US air quality was first evaluated against gridded ozone observations. The ozone seasonal variations and diurnal cycles were then extracted to determine the observed long-term trend. The model simulations were subsequently analyzed to explain the observed ozone trends and change in ozone production sensitivity.
2.1 Long-term EPA observations
Hourly measurements of surface ozone concentrations from 1990 to 2015 were available from the EPA Air Quality System (AQS) database (https://www.epa.gov/outdoor-air-quality-data, last access: May 2016). They have been examined following EPA guidance, including for quality assurance and quality control. The locations and durations of AQS monitoring sites have changed substantially due to logistics and requirements to cover the regions sensitive to air pollution. Figure 1 shows that more than 2000 sites reported ozone measurements during the period of 1990 to 2015. To alleviate the impacts from missing data and short durations, we selected 640 sites that had ozone observation records of longer than 20 years. Hourly ozone observations were processed following the approach described in He et al. (2019) in order to create the long-term seasonal and diurnal records for these stations.
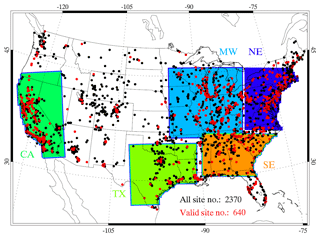
Figure 1Locations of EPA AQS sites for surface ozone monitoring during 1990–2015. Red dots stand for monitoring sites with records of more than 20 years. Black dots show the locations of monitoring sites have short data records, which are not used in this study. The map shows the CWRF-CMAQ 30 km domain and five subdomains sensitive to air pollution. CA: California (including nearby parts of Nevada, Arizona and Oregon); TX: Texas (including nearby parts of Louisiana, Arkansas and Oklahoma); SE: Southeast; NE: Northeast; and MW: Midwest. Please note that our CA and TX subdomains include more area than the states of California and Texas.
2.2 Regional climate modeling
CWRF (Liang et al., 2012) was driven by the European Centre for Medium-Range Weather Forecasts ERA-Interim reanalysis (ERI; Dee et al., 2011) in order to downscale regional climate variations during 1989–2015, with the first year as the spin-up and not used. We adopted the well-established CWRF North American domain with a 30 km grid spacing (Fig. 1), covering the contiguous United States (CONUS) and neighboring southern Canada, northern Mexico and adjacent oceans. The CWRF was developed as a climate extension of the WRF model (Skamarock et al., 2008), incorporating numerous improvements in representation of physical processes and integration of external forcings that are crucial to climate scales, including interactions between land–atmosphere–ocean, convection–microphysics and cloud–aerosol–radiation, and system consistency throughout all process modules (Liang et al., 2012; Qiao and Liang, 2015, 2016; Chen et al., 2016; Liu et al., 2016). CWRF is built with a comprehensive ensemble of many alternate mainstream parameterization schemes for each of key physical processes. It has been vigorously tested in North America and Asia, showing an outstanding ability to capture regional climate characteristics (Yuan and Liang, 2011; Chen et al., 2016; Liu et al., 2016; Liang et al., 2019). The CWRF downscaling has been shown to provide realistic meteorological fields and regional climate signals that can be cordially used to drive the CMAQ for long air quality simulations. Major CWRF physics configurations include the semiempirical cloudiness parameterization of Xu and Randall (1996), the cloud microphysics scheme of Tao et al. (1989), the shortwave and longwave radiation scheme of Chou et al. (2001), the ensemble cumulus parameterization (Qiao and Liang, 2015, 2016, 2017) and the planetary boundary layer scheme of Holtslag and Boville (1993). Hourly CWRF outputs were processed using a modified Meteorology-Chemistry Interface Processor (MCIP, version 4.3) for CMAQ simulations.
2.3 Emissions preparation
To prepare anthropogenic emissions, we chose 2014 as the baseline year. The emissions from this year were modified from the National Emissions Inventory 2011 (NEI2011). The modifications were based on measurements from the Ozone Monitoring Instrument (OMI) on board the satellite Aura, the ground-based AQS network and the in situ continuous emissions monitoring in power plants (Tong et al., 2015, 2016). The so-modified NEI2011 inventory was processed using the Sparse Matrix Operator Kernel Emissions (SMOKE) version 3.7 (Houyoux et al., 2000). Emissions from on-road, off-road and area sources were placed at the model layer closest to the surface. Emissions from point sources, e.g., stacks from power plants, were distributed vertically based on stack height and plume rise. The plume rise was estimated based on the method in Briggs (1972). The inventory pollutants were speciated according to the Carbon Bond Mechanism version 5 (CB05) and AERO5 aerosol mechanism. To fill the gap where NEI2011 data were not available, the Emissions Database for Global Atmospheric Research (EDGAR v3; http://edgar.jrc.ec.europa.eu/, last access: October 2016) at a resolution developed by the Joint Research Centre of the European Commission was adapted. Figure 2 shows an example of 2010–2015 mean NOx emissions distribution over the modeling domain. Daily mean NOx emissions have high values in urban areas of cities such as Los Angeles and Chicago and the Northeast corridor from Washington DC to Boston.
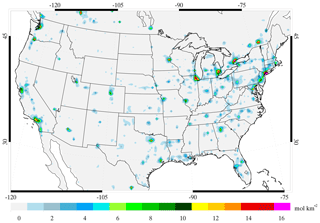
Figure 2Averaged daily NOx emissions between 2010 and 2015 in the modeling domain (in moles per square kilometer).
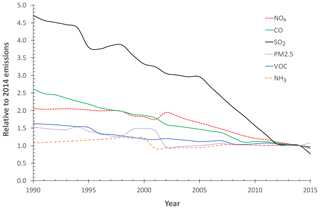
To project emissions from the baseline year into all individual years, we used the scaling factors from Air Pollutant Emissions Trends (APETs) data compiled by the US EPA (https://www.epa.gov/air-emissions-inventories/air-pollutant-emissions-trends-data, last access: October 2016). Emissions of the baseline year are based on EPA NEI2011 inventory, which can provide the best available anthropogenic emissions to the CONUS and are currently used in the operational US national air quality forecast. The usage of APET scaling factors can guarantee the domain total emissions are consistent with the US EPA emissions trend, although assuming the same spatial distribution of anthropogenic emissions from year to year may not be realistic. Without a reasonable observation of actual spatiotemporal variations, it is the cost-effective approach as a first-order approximation to simulate long-term US air quality driven by consistent CONUS total anthropogenic emissions that account interannual trends. Figure 3 shows the emission evolution from 1990 to 2015. Since 1990 anthropogenic emissions of NOx, CO, sulfur dioxide (SO2) and VOCs have steadily decreasing trends, with SO2 experiencing the largest reduction. On the other hand, anthropogenic PM2.5 and NH3 emissions have stayed mostly flat since the early 2000s.
The wildfire emissions were based on the Global Fire Emissions Database, Version 4, with small fires (GFEDv4s; Randerson et al., 2017; van der Werf et al., 2017). The degree resolution GFEDv4s data were projected onto the modeling domain and speciated into the CB05 and AERO5 species. GFEDv4s had a monthly resolution from 1997 to 2000 and daily resolution from 2000 onward. Figure 4 illustrates the fire emissions evolution during 1990 to 2015 relative to 2014. Fire emissions have large interannual variations, with high emissions in 1998, 2002, 2013 and 2015 and low emissions in 2001, 2004 and 2014. We developed a method to merge the aforementioned anthropogenic and wildfire emissions into the temporalized, gridded and speciated data ready for CMAQ.
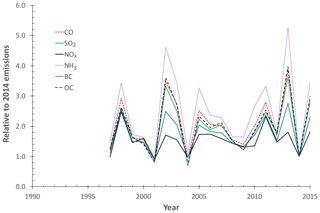
Figure 4Fire emission evolution relative to 2014 in the modeling domain from 1990 to 2015. Note that Global Fire Emissions Database (GFED) fire emissions are not available before 1997.
Table 1Summary of multiyear mean average of daily CO, NOx and NMVOCs emissions in the CONUS and five subdomains (in moles per square kilometer per second). Please note that our California and Texas subdomains include more area than the states of California and Texas.
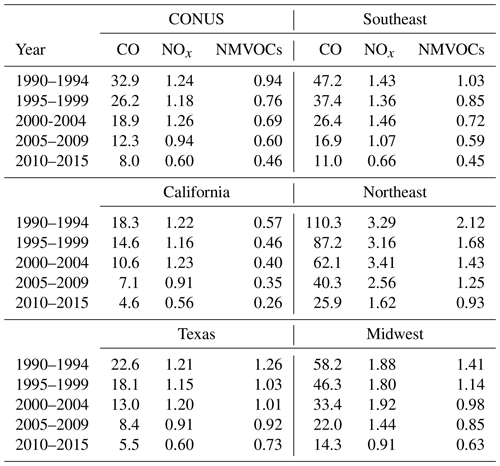
The biogenic emissions were calculated on-line within CMAQ based on the Biogenic Emissions Landuse Database, Version 3 (BELD3; https://www.epa.gov/air-emissions-modeling/biogenic-emissions-landuse-database-version-3-beld3, last access: October 2016). The 1 km resolution BELD3 data with spatial distribution of 230 vegetation classes over the North America were processed through the Spatial Allocator developed by the Community Modeling and Analysis System (CMAS) center (https://www.cmascenter.org/sa-tools/, last access: October 2016) to generate the gridded vegetation distribution over the study domain. Table 1 lists the 5-year mean variations of daily major ozone precursor (CO, NOx and NMVOCs: non-methane VOCs) emissions in the modeling domain and five subdomains. The emission data show regionally dependent reductions. For instance, compared with 2000–2004, the NOx emissions in 2005–2009 decreased by ∼36 % on average in the CONUS, while 38 % and 35 % reductions existed in states of California and Texas.
2.4 Air quality modeling
The EPA CMAQ model version 5.2 (EPA, 2017) was selected to simulate the US air quality variations driven by CWRF meteorological fields (Sect. 2.2) and constructed emissions (Sect. 2.3). Major chemical mechanisms include the Carbon Bond 6 revision 3 (CB6r3) gas phase chemical scheme with updated secondary organic aerosol (SOA) and nitrate chemistry (Yarwood et al., 2010) and the latest AERO6 aerosol scheme (EPA, 2017), which improved US air quality simulations over previous chemical mechanisms (Appel et al., 2016). Chemical initial and boundary conditions were obtained from the default concentration profiles built in CMAQ (EPA, 2017). Simulations were conducted continuously for each 5-year segment (1990–1994, 1995–1999, etc.) with a 2-week spin-up in December prior to each starting year in order to speed up simulation turn around. Hourly concentrations of ozone and its key precursors such as nitric oxide (NO) and nitrogen dioxide (NO2) were saved for subsequent analyses.
3.1 Evaluation of CMAQ performance
Our previous studies showed that the direct comparison of observation data from monitoring sites and CMAQ results in 30 km grid could introduce inconsistency for evaluating the model performance (He et al., 2016a). The direct comparison is usually conducted by sampling the grid of CMAQ where the AQS site is located, but the distribution of AQS monitoring sites is usually uneven with more sites concentrated in populous urban and suburban areas where high ozone levels prevail. Sampling 30 km CMAQ grids over the locations of AQS measurements, i.e., direct comparison of averaged concentrations in the 900 km2 CMAQ grid and pointwise AQS observations, could introduce notable biases. So we applied the EPA Remote Sensing Information Gateway (RSIG) software (available at https://www.epa.gov/rsig, last access: July 2016) to map the site observations onto our CMAQ grid. The RSIG has the capability to “re-grid” the AQS observations on a selected model grid using the inverse-distance-weighted method to calculate the gridded mean concentrations (https://www.epa.gov/hesc/how-rsig-regrids-data, last access: July 2016). Figure 5 compares summer (JJA) mean MDA8 ozone in 2014 between gridded AQS observations and CMAQ outputs and shows that the model can capture well the US ozone pollution, except for an underestimation in urban areas such as the Los Angeles basin.
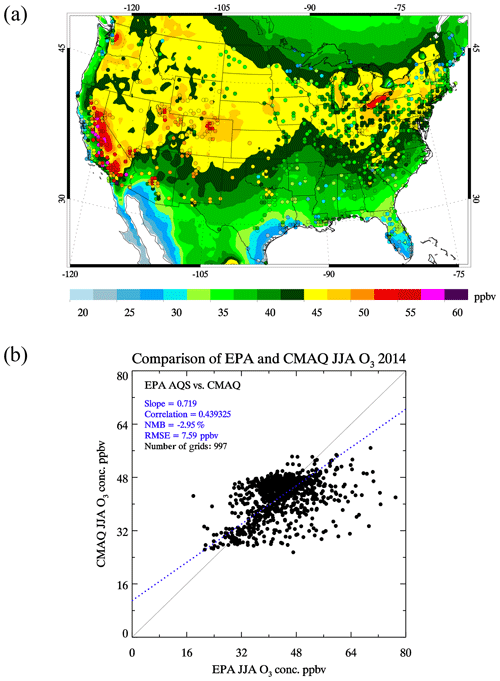
Figure 5Comparison of summer MDA8 ozone concentrations from EPA AQS observations and CMAQ simulations in 2014. AQS station data were gridded to the CMAQ grid using the EPA RSIG software. (a) Contour plot, the background stands for the CMAQ outputs and the dots stand for gridded AQS observations; (b) scatter plot of the gridded AQS observations and collocated CMAQ outputs.
Table 2 summarizes the statistics of CMAQ performance while simulating the summer ozone concentrations during 2000–2015 in the CONUS and subdomains. Linear regression analyses of MDA8 ozone result in a mean slope value of 0.75 for the CONUS; i.e., CMAQ slightly underestimates ozone over the United States. In subdomains, CMAQ performance exhibits large interannual variations. For instance, in Texas the linear regression slope and correlation coefficient ranges from 0.58 to 0.97 and 0.55 to 0.86, respectively. With a gradual reduction in anthropogenic emissions, the fluctuations of CMAQ performance could be related to climate signals that control the regional ozone pollution. Future work is needed to identify the relationship between these regional climate variations and the US ozone pollution. Generally, this modeling system has substantially improved performance in the Southeast, California and Texas and moderately improved performance in the Northeast and Midwest as compared with our previous modeling system (He et al., 2016a), which significantly underestimated the US ozone pollution. One reason is that CWRF with a more sophisticated representation of physical processes have the capability to better simulate the US climate, especially surface temperature and precipitation (Liang et al., 2012; Chen et al., 2016; Liu et al., 2016; Sun and Liang, 2020a, b), which are key to accurate air quality simulations. The evaluation of CMAQ performance demonstrates the capability of CWRF-CMAQ to credibly simulate historical air quality.
Table 2Summary of the comparison of JJA MDA8 ozone concentrations from AQS observations and CMAQ simulations during 2000–2015 in the CONUS and subdomains. Slope and correlation (corr. R) are calculated for each year based on linear regression analysis. Please note that our California and Texas subdomains include more area than the states of California and Texas.
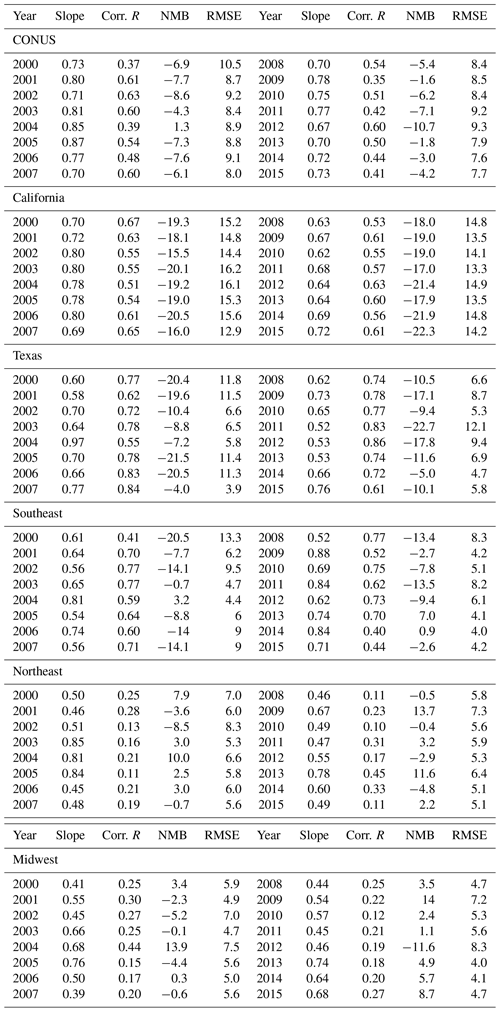
NMB: normalized mean bias (in percent); RMSE: root mean square error (in parts per billion by volume).
3.2 Long-term ozone trend in AQS observations
We applied a box-averaging technique (He et al., 2016b, 2019) to analyze ozone measurements at the selected AQS monitoring sites (Fig. 1). This approach used an hour by month box to calculate the mean 24 h diurnal cycle of ozone for each month. Then we calculated the climatology mean over 24 h by 12 months and the respective anomaly for each month at each AQS site. Figure 6 shows samples of long-term mean ozone concentrations and anomalies at four non-attainment cities: Baltimore, Maryland; Los Angeles, California; Denver, Colorado; and New York City (NYC), New York. The hour by month climatology (left column of Fig. 6) shows that the peak ozone concentrations in the afternoon during the ozone season (April to September) have been reduced significantly in these cities. However, ozone concentrations in the morning (08:00 LT to 12:00 LT) and at night (20:00 LT to 08:00 LT) increased slightly. These results confirm the effectiveness of recent emission controls, which were designed to reduce the peak ozone. But the expansion of ozone at moderate levels (40–50 ppbv), which are higher than the natural background of US ozone (Fiore et al., 2002, 2003; Wang et al., 2009; Lefohn et al., 2014), could cause negative health impacts.
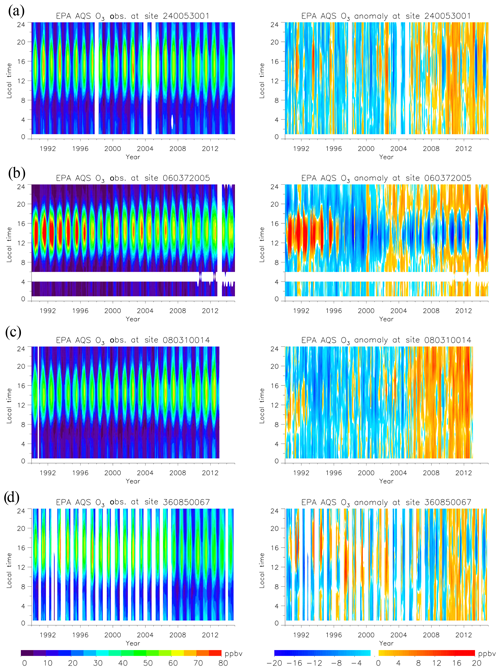
Figure 6The box-averaging analyses of AQS ozone observations at selected sites from 1990 to 2015. (a) Essex, Maryland (suburban Baltimore; AQS ID 240053001); (b) Pasadena, California (downtown Los Angeles; AQS ID 060372005); (c) Denver, Colorado (downtown Denver; AQS ID 080310014); (d) Staten Island, New York (suburban New York City; AQS ID 360850067). Left column shows the monthly mean, and right column shows the anomaly values. White patches stand for missing data or not sufficient data for the box-averaging analysis.
The anomaly (right column of Fig. 6) shows large variabilities in ozone concentrations because the ozone production is significantly impacted by regional climate (e.g., temperature, precipitation) with interannual and decadal variations. A large ozone reduction occurred after 2003 when the EPA NOx State Implementation Plan (SIP) call was implemented (He et al., 2013). The anomalies at Los Angeles (Fig. 6b) and NYC (Fig. 6d) show decreases in the peak ozone in the afternoon in summer and increases in other times and seasons. For Baltimore and Denver, the peak ozone was not monotonically reduced but rather increased in some years after 2002. Given the continuous reduction of anthropogenic emissions in the past decades, the increased ozone pollution in these areas could be caused by other factors that need further investigation in the future.
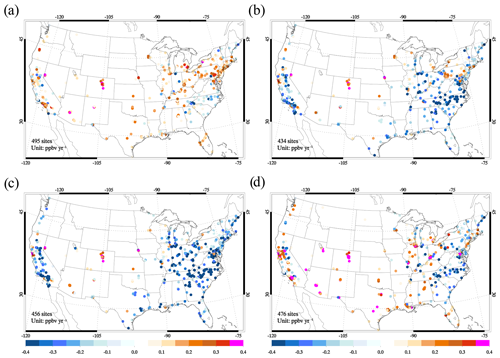
Figure 7Trend in ozone observations at selected EPA AQS sites during 1990–2015 (in parts per billion by volume per year) at (a) 08:00 LT, (b) 12:00 LT, (c) 16:00 LT and (d) 20:00 LT. We only show the sites with a statistically significant linear trend in the plots.
We used the linear regression analysis to calculate the slope, correlation (R) and p value of ozone trend at each local hour. Figure 7 shows ozone trends (slope; in parts per billion per year) at AQS sites that are statistically significant (R2>0.5; p<0.05) in the early morning (08:00 LT), at noon (12:00 LT), in the afternoon (16:00 LT) and in the evening (20:00 LT). Consistent results with the four cities (Fig. 6) are found ubiquitously. The peak ozone at noon and in the afternoon generally had a decreasing trend in the CONUS, up to 0.5 ppbv yr−1, confirming the improved air quality due to regulations, while ozone in the early morning and late afternoon increased slightly at most of monitoring sites. However, AQS sites in the Bay Area (San Francisco, California) and Denver had stronger positive trends in the daytime. The possible explanations include the trans-Pacific transport of ozone and its precursors to the US West Coast (Hudman et al., 2004; Huang et al., 2010; Lin et al., 2012b) and stratosphere–troposphere exchange of ozone to high altitude regions (Langford et al., 2009; Lin et al., 2012a).
3.3 Ozone trends derived from CMAQ simulations
We applied the same box-averaging technique to hourly surface ozone simulations of the CONUS and conducted the linear regression analysis to estimate the ozone trend at each model grid (Fig. 8). Compared with ozone trends derived from AQS observations (Fig. 7), the CMAQ model successfully captured the spatial pattern and magnitude of change in ozone pollution. For instance, at 16:00 LT, CMAQ simulated an up to 0.4 ppbv yr−1 decrease in surface ozone in the eastern United States and southern region of California state. However, CMAQ simulated statistically insignificant trends (white color in Fig. 8c) at 16:00 LT in the Bay Area, Los Angeles and Denver where AQS observations showed increasing trends (Fig. 7c). The discrepancy occurred because our model used the static chemical lateral boundary conditions (LBCs) that did not include the change in trans-Pacific transport of air pollutants, which were known to elevate the background ozone on the West Coast. Also CMAQ does not contain stratospheric chemistry and hence cannot account the contribution of downward transport of stratospheric ozone to the high altitude region.
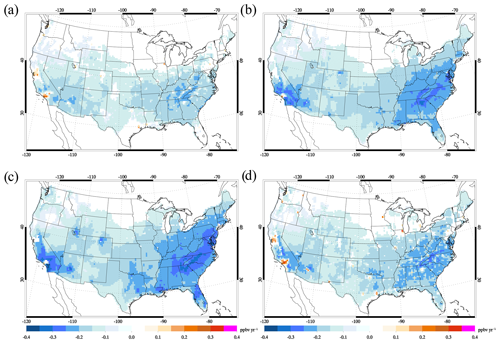
Figure 8Trends in ozone simulations from CMAQ during 1990-2015 (in parts per billion by volume per year) at (a) 08:00 LT, (b) 12:00 LT, (c) 16:00 LT and (d) 20:00 LT. We only show CMAQ grids with a statistically significant linear trend in the plots.
Consistent with trends derived from AQS observations, CMAQ also simulated increasing ozone trends in the early morning (08:00 LT, Fig. 8a) and late afternoon (20:00 LT, Fig 8d), especially in urban regions such as Los Angeles and Chicago. He et al. (2019) found ozone increases from observations at four sites in the eastern United States and a possible cause suggested by the reduced NO–O3 titration through examining the trend in odd oxygen (). Due to known interferences from nitrogen compounds such as NOx and organic nitrates to standard NO2 measurements employed by EPA (Fehsenfeld et al., 1987; Dunlea et al., 2007; Dickerson et al., 2019), the analysis of Ox required a research-grade NO2 analyzer (e.g., photolytic NO2 conversion) which is not available in current AQS network. Thus, our simulations provide a unique opportunity to expand such a study to the whole CONUS.
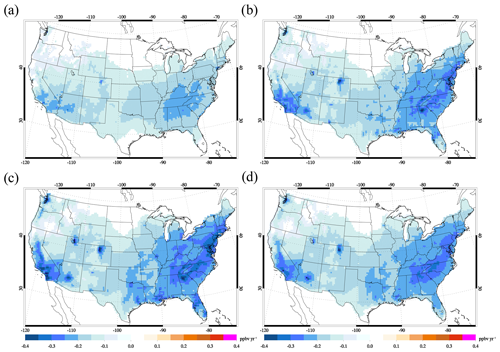
Figure 9Trend in Ox () simulated by CMAQ during 1990–2015 at (a) 08:00 LT, (b) 12:00 LT, (c) 16:00 LT and (d) at 20:00 LT. We only show CMAQ grids with a statistically significant linear trend in the plots.
Trends in Ox concentrations simulated by CMAQ at 08:00 LT, 12:00 LT, 16:00 LT and 20:00 LT show a consistent decreasing trend over the modeling domain, up to 0.5 ppbv yr−1 reductions in the eastern United States (Fig. 9). The result confirms our hypothesis that the reduced NO–O3 titration elevated surface ozone concentrations in the early morning and late afternoon when the photochemical production of ozone is low or not active. Nowadays, the EPA ozone standard focuses on peak ozone concentrations, i.e., MDA8 ozone, which usually has maximum values at noon or in the early afternoon, so the damage from additional ozone exposure from these elevated ozone concentrations in the early morning and late afternoon is not considered under the current environment policy. These increased ozone levels could offset the benefit from reduced peak ozone in past decades, which needs further investigations to provide scientific evidence for future policy decision.
3.4 Change in photochemical regime
With the continuous reduction in ozone precursor emissions, changes in the complex O3–NOx–VOC chemistry are anticipated. We used the O3 ∕ NOy ratio as the indicator to study the photochemical regime change in the US surface ozone production. The usage of the O3 ∕ NOy ratio was first proposed by Sillman (Sillman, 1995; Sillman et al., 1997). Sillman et al. (1997) conducted a case study of observations in urban areas (Atlanta, New York and Los Angeles) and modeling results from the Urban Airshed Model and suggested the threshold of 7 as the transition region from a VOC-sensitive environment to a NOx-sensitive environment. Zhang et al. (2009a, b) expanded this method to the CONUS with 1-year observations and CMAQ simulations (36 km spatial resolution) and suggested a threshold of 15 for ozone pollution at the national scale. In this study, we did not have access to the long-term research-grade NOy observations from the AQS network and did not conduct sensitivity experiments (due to computational resource limit) with reduced NOx emissions following Sillman et al. (1997), so we have to reply on the O3 ∕ NOy threshold from literature. We conducted a simple evaluation of our CMAQ results and found the threshold of 7 would be more appropriate for urban areas, and the threshold of 15 is more applicable to our study of the whole United States (Fig. S1 in the Supplement). Please note that the O3 ∕ NOy ratio could depend on the modeling framework, so due to the similarity of our modeling system (30 km CMAQ) and the model used in Zhang et al. (2009a, b), our analysis suggest the same threshold of 15.
The threshold of 15 proposed by Zhang et al. (2009b) was adopted to identify the VOC-sensitive or NOx-sensitive regime, i.e., O3 ∕ NOy <15, indicating the VOC-sensitive regime. For each local hour, we calculated the probability that O3 ∕ NOy is lower than 15 in every month. Figure 10 shows the probability of VOC-sensitive regime at 14:00 LT in July of 1995, 2005 and 2015. Most regions dominated by the VOC-sensitive chemistry are urban or suburban, where anthropogenic NOx emissions are relatively high as compared with anthropogenic and/or biogenic VOCs emissions, areas such as in the Los Angeles basin, the Northeast corridor (Washington DC–Baltimore–Philadelphia–NYC) and the Chicago metropolitan area. Note that these maps are created based on ozone photochemical production simulated at the surface level, so the distributions are slightly different from recent studies using satellite data (Duncan et al., 2010; Jin et al., 2017; Ring et al., 2018).
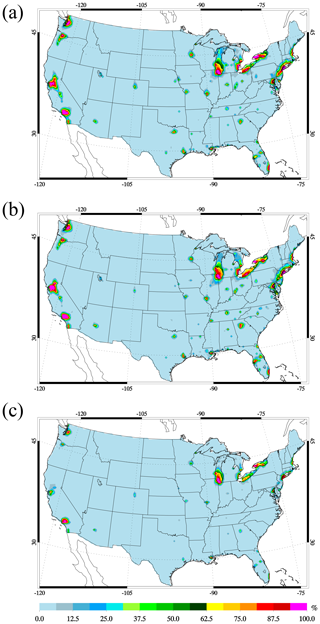
Figure 10Probability of VOC-sensitive photochemical ozone production (i.e., ) in the CONUS simulated by CMAQ at 14:00 LT in July of (a) 1995, (b) 2005 and (c) 2015.
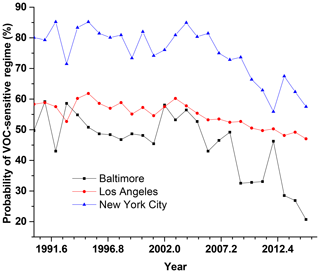
We calculated the mean probability of VOC-sensitivity (14:00 LT in July) in a 3×3 CMAQ grid in metropolitan areas of Baltimore, Los Angeles and NYC from 1990 to 2015 (Fig. 11). CMAQ simulations suggest the transition from a VOC-sensitive regime to a NOx-sensitive regime in these urban areas. There were interannual variabilities in the probability of VOC-sensitive photochemistry in Baltimore (∼50 %) and NYC (∼80 %) in the 1990s and the early 2000s. After the EPA 2003 NOx SIP call, anthropogenic NOx emissions decreased substantially, leading to reduced ozone pollution in the eastern United States (He et al., 2013), so the photochemical production of surface ozone is expected to gradually become NOx-sensitive. In 2015, ozone photochemical production in Baltimore was dominated by NOx emissions (only ∼20 % probability of VOC-sensitive), while NYC had higher probability (>50 %) of VOC-sensitive chemistry. In Los Angeles, ozone chemistry slowly leaned toward being NOx-sensitive, but until 2015 the local ozone production was still controlled by VOCs emissions. In regions with VOC-sensitive photochemistry in summer, reduction in NOx emissions had a limited impact on the local rate of ozone production until the photochemistry of ozone production became NOx-sensitive. Our analysis can partially explain the different responses of ozone pollution in major US cities to national air quality regulations during the past decades (Cooper et al., 2012) and can provide some insights for future policy decision.
EPA AQS observations in the United States from 1990 to 2015 were analyzed in order to study the trend in surface ozone seasonal variations and diurnal cycles. We found that the peak ozone concentrations in the afternoon decreased significantly, especially in major non-attainment regions, but the concentrations in the early morning and late afternoon increased slightly. Regional climate-air quality model captured the long-term records of US ozone pollution and suggested that the increased ozone was caused by reduced NO–O3 titration due to the continuous reduction in NOx emissions. Model simulations also showed changes in ozone photochemical regime. The US urban and suburban areas generally transited from the VOC-sensitive regime in the early 1990s to a more NOx-sensitive regime recently. But ozone production in some cities such as NYC and Los Angeles are still substantially impacted by VOC emissions. The current national and regional regulations focus on the MDA8 ozone concentrations, mainly determined by the peak ozone in the afternoon. Our study revealed the elevated ozone concentrations in the early morning and late afternoon, which must be considered for their impacts on public health. Because NOx emissions are currently the main target of national and regional control measures, our study suggests that regulations on anthropogenic VOCs emissions could be important in certain regions. This study can improve our understanding about the effectiveness of regulations in the past decades and will provide scientific evidence for future policy decision.
Ozone production is highly nonlinear, so accurate emissions are essential to simulations of its long-term variations. Due to limited resources, we scaled the anthropogenic emissions from a baseline year (2014) to the 1990s using factors derived from the national trend data in order to construct consistent emissions for the CONUS with respect to the EPA data. This scaling cannot accurately reflect the detailed regional-dependent regulations for individual state such as the 2012 Health Air Act in Maryland (He et al., 2016b). Also, because the GFED data were only available after 1997, the contribution of wildfire emissions to ozone pollution was not included in model simulations between 1990 and 1996. Thus, we anticipated some uncertainties in ozone simulations in the early 1990s. Our model also has limitations in reproducing ozone records in high altitude regions such as Denver because of the lack of stratospheric chemistry in CMAQ and missing the effect of stratosphere–troposphere exchange on surface ozone. Lastly, due to limited resources, our experiments used static chemical LBCs for CMAQ, which excluded the long-range transport of air pollutants into the United States. So our current modeling system cannot take the historical changes in air pollution outside the United States into account. That is, the effect of long-range transport of air pollutants through model domain boundaries is presumed to be secondary to the long-term trends over the United States. For some West Coast regions such as the state of California, the trans-Pacific transport had been enhanced in the past decades and could play a more important role in determining the local air quality. With these increased air pollutant transported into the United States, our study may underestimate the impacts of domestic emission reductions on US ozone pollution, especially on the West Coast and in the Southwest. To accurately evaluate the contribution from transboundary emission, dynamic LBCs from a global chemical transport model are needed in future studies.
EPA AQS observation data are available at https://www.epa.gov/outdoor-air-quality-data (US EPA, 2016). The CMAQ is a community model and is freely available at https://www.cmascenter.org/cmaq/ (US EPA, 2017). The ECMWF ERI data are distributed by NCAR (at https://rda.ucar.edu/datasets/ds627.0/, ECMWF, 2016). The CWRF model source code is available upon request.
The supplement related to this article is available online at: https://doi.org/10.5194/acp-20-3191-2020-supplement.
HH, XZL and ZT designed the experiment; HH and CS developed the CWRF-CMAQ system and performed the CWRF modeling; ZT and DQT prepared the emission data; HH conducted the CMAQ simulations; HH, ZT and CS analyzed the data; HH prepared the manuscript with contributions from all co-authors.
The authors declare that they have no conflict of interest.
This work has not been formally reviewed by EPA. The views expressed in this document are solely those of the authors and do not necessarily reflect those of the funding agency. EPA does not endorse any products or commercial services mentioned in this publication.
This work was supported by the US Environmental Protection Agency under Assistance Agreement no. RD-83587601. We thank the support of University of Illinois at Urbana-Champaign (UIUC)/EPA award 20110150701. We also acknowledge partial support from the US National Science Foundation Innovations at the Nexus of Food, Energy and Water Systems (EAR-1639327). We thank the National Center for Supercomputing Applications (NCSA) and the National Center for Atmospheric Research (NCAR) Computation and Information System Laboratory for supercomputing support. We thank Plessel Todd for the help on the RSIG software (https://www.epa.gov/rsig).
This research has been supported by the US Environmental Protection Agency (grant no. RD83587601).
This paper was edited by Hailong Wang and reviewed by three anonymous referees.
Adams, R. M., Glyer, J. D., Johnson, S. L., and McCarl, B. A.: A reassessment of the economic-effects of ozone on United-States agriculture, J. Air Waste Manage., 39, 960–968, 1989.
Anderson, H. R.: Air pollution and mortality: A history, Atmos. Environ., 43, 142–152, https://doi.org/10.1016/j.atmosenv.2008.09.026, 2009.
Appel, K. W., Napelenok, S. L., Hogrefe, C., Foley, K. M., Pouliot, G., Murphy, B. N., Luecken, D. J., and Heath, N.: Evaluation of the Community Multiscale Air Quality (CMAQ) Model Version 5.2, 2016 CMAS Conference, 15 October 2016, Chapel Hill, NC, USA, 2016.
Ashmore, M. R.: Assessing the future global impacts of ozone on vegetation, Plant Cell Environ., 28, 949–964, https://doi.org/10.1111/j.1365-3040.2005.01341.x, 2005.
Briggs, G. A.: Chimney plumes in neutral and stable surroundings Shwartz and Tulin, Atmos. Environ., 6, 507–510, https://doi.org/10.1016/0004-6981(72)90120-5, 1972.
Chen, L. G., Liang, X. Z., DeWitt, D., Samel, A. N., and Wang, J. X. L.: Simulation of seasonal US precipitation and temperature by the nested CWRF-ECHAM system, Clim. Dynam., 46, 879–896, https://doi.org/10.1007/s00382-015-2619-9, 2016.
Chou, M.-D., Suarez, M. J., Liang, X.-Z., Yan, M. M.-H., and Cote, C.: A thermal infrared radiation parameterization for atmospheric studies, Technical Report Series on Global Modeling and Data Assimilation, Volume 19, NASA Goddard Space Flight Center, July, 2001.
Cooper, O. R., Parrish, D., Ziemke, J., Balashov, N., Cupeiro, M., Galbally, I., Gilge, S., Horowitz, L., Jensen, N., and Lamarque, J.-F.: Global distribution and trends of tropospheric ozone: An observation-based review, Elementa, 2, 000029, https://doi.org/10.12952/journal.elementa.000029, 2014.
Cooper, O. R., Gao, R. S., Tarasick, D., Leblanc, T., and Sweeney, C.: Long-term ozone trends at rural ozone monitoring sites across the United States, 1990–2010, J. Geophys. Res.-Atmos., 117, D22307, https://doi.org/10.1029/2012jd018261, 2012.
Crutzen, P. J.: Photochemical reactions initiated by and influencing ozone in unpolluted tropospheric air, Tellus, 26, 47–57, 1974.
Dee, D. P., Uppala, S. M., Simmons, A. J., Berrisford, P., Poli, P., Kobayashi, S., Andrae, U., Balmaseda, M. A., Balsamo, G., Bauer, P., Bechtold, P., Beljaars, A. C. M., van de Berg, L., Bidlot, J., Bormann, N., Delsol, C., Dragani, R., Fuentes, M., Geer, A. J., Haimberger, L., Healy, S. B., Hersbach, H., Hólm, E. V., Isaksen, L., Kållberg, P., Köhler, M., Matricardi, M., McNally, A. P., Monge-Sanz, B. M., Morcrette, J. J., Park, B. K., Peubey, C., de Rosnay, P., Tavolato, C., Thépaut, J. N., and Vitart, F.: The ERA-Interim reanalysis: configuration and performance of the data assimilation system, Q. J. Roy. Meteor. Soc., 137, 553–597, https://doi.org/10.1002/qj.828, 2011.
Dickerson, R. R., Anderson, D. C., and Ren, X.: On the use of data from commercial NOx analyzers for air pollution studies, Atmos. Environ., 214, 116873, https://doi.org/10.1016/j.atmosenv.2019.116873, 2019.
Dodge, M.: Chemistry of Oxidant Formation: Implications for Designing Effective Control Strategies U.S. Environmental Protection Agency, Washington, D.C., USA, EPA/600/D-87/114 (NTIS PB87179990), 1987.
Duncan, B. N., Yoshida, Y., Olson, J. R., Sillman, S., Martin, R. V., Lamsal, L., Hu, Y. T., Pickering, K. E., Retscher, C., Allen, D. J., and Crawford, J. H.: Application of OMI observations to a space-based indicator of NOx and VOC controls on surface ozone formation, Atmos. Environ., 44, 2213–2223, https://doi.org/10.1016/j.atmosenv.2010.03.010, 2010.
Dunlea, E. J., Herndon, S. C., Nelson, D. D., Volkamer, R. M., San Martini, F., Sheehy, P. M., Zahniser, M. S., Shorter, J. H., Wormhoudt, J. C., Lamb, B. K., Allwine, E. J., Gaffney, J. S., Marley, N. A., Grutter, M., Marquez, C., Blanco, S., Cardenas, B., Retama, A., Ramos Villegas, C. R., Kolb, C. E., Molina, L. T., and Molina, M. J.: Evaluation of nitrogen dioxide chemiluminescence monitors in a polluted urban environment, Atmos. Chem. Phys., 7, 2691–2704, https://doi.org/10.5194/acp-7-2691-2007, 2007.
ECMWF: ERI data, available at: https://rda.ucar.edu/datasets/ds627.0, last access: October 2016.
EPA: CMAQ (Version 5.2) Scientific Document, Zenodo, https://doi.org/10.5281/zenodo.1167892, 2017.
Fehsenfeld, F. C., Dickerson, R. R., Hubler, G., Luke, W. T., Nunnermacker, L. J., Williams, E. J., Roberts, J. M., Calvert, J. G., Curran, C. M., Delany, A. C., Eubank, C. S., Fahey, D. W., Fried, A., Gandrud, B. W., Langford, A. O., Murphy, P. C., Norton, R. B., Pickering, K. E., and Ridley, B. A.: A ground-based intercomparison of NO, NOx, and NOy measurement techniques, J. Geophys. Res.-Atmos., 92, 14710–14722, 1987.
Finlayson-Pitts, B. J. and Pitts, J. N.: Chemistry of the Upper and Lower Atmosphere, 1st edn., Academic Press, London, UK, 1999.
Fiore, A. M., Jacob, D. J., Bey, I., Yantosca, R. M., Field, B. D., Fusco, A. C., and Wilkinson, J. G.: Background ozone over the United States in summer: Origin, trend, and contribution to pollution episodes, J. Geophys. Res.-Atmos., 107, ACH 11-11–ACH 11-25, https://doi.org/10.1029/2001jd000982, 2002.
Fiore, A. M., Jacob, D. J., Liu, H., Yantosca, R. M., Fairlie, T. D., and Li, Q.: Variability in surface ozone background over the United States: Implications for air quality policy, J. Geophys. Res.-Atmos., 108, 4787, https://doi.org/10.1029/2003jd003855, 2003.
Fishman, J., Ramanathan, V., Crutzen, P. J., and Liu, S. C.: Tropospheric ozone and climate, Nature, 282, 818–820, https://doi.org/10.1038/282818a0, 1979.
He, H., Stehr, J. W., Hains, J. C., Krask, D. J., Doddridge, B. G., Vinnikov, K. Y., Canty, T. P., Hosley, K. M., Salawitch, R. J., Worden, H. M., and Dickerson, R. R.: Trends in emissions and concentrations of air pollutants in the lower troposphere in the Baltimore/Washington airshed from 1997 to 2011, Atmos. Chem. Phys., 13, 7859–7874, https://doi.org/10.5194/acp-13-7859-2013, 2013.
He, H., Liang, X.-Z., Lei, H., and Wuebbles, D. J.: Future U.S. ozone projections dependence on regional emissions, climate change, long-range transport and differences in modeling design, Atmos. Environ., 128, 124–133, https://doi.org/10.1016/j.atmosenv.2015.12.064, 2016a.
He, H., Vinnikov, K. Y., Li, C., Krotkov, N. A., Jongeward, A. R., Li, Z. Q., Stehr, J. W., Hains, J. C., and Dickerson, R. R.: Response of SO2 and particulate air pollution to local and regional emission controls: A case study in Maryland, Earth's Future, 4, 94–109, https://doi.org/10.1002/2015ef000330, 2016b.
He, H., Liang, X. Z., and Wuebbles, D. J.: Effects of emissions change, climate change and long-range transport on regional modeling of future US particulate matter pollution and speciation, Atmos. Environ., 179, 166–176, https://doi.org/10.1016/j.atmosenv.2018.02.020, 2018.
He, H., Vinnikov, K. Y., Krotkov, N. A., Edgerton, E. S., Schwab, J. J., and Dickerson, R. R.: Chemical climatology of atmospheric pollutants in the eastern United States: Seasonal/diurnal cycles and contrast under clear/cloudy conditions for remote sensing, Atmos. Environ., 206, 85–107, https://doi.org/10.1016/j.atmosenv.2019.03.003, 2019.
Hogrefe, C., Hao, W., Zalewsky, E. E., Ku, J.-Y., Lynn, B., Rosenzweig, C., Schultz, M. G., Rast, S., Newchurch, M. J., Wang, L., Kinney, P. L., and Sistla, G.: An analysis of long-term regional-scale ozone simulations over the Northeastern United States: variability and trends, Atmos. Chem. Phys., 11, 567–582, https://doi.org/10.5194/acp-11-567-2011, 2011.
Holton, J. R., Haynes, P. H., McIntyre, M. E., Douglass, A. R., Rood, R. B., and Pfister, L.: Stratosphere-troposphere exchange, Rev. Geophys., 33, 403–439, https://doi.org/10.1029/95rg02097, 1995.
Holtslag, A. A. M. and Boville, B. A.: Local Versus Nonlocal Boundary-Layer Diffusion in a Global Climate Model, J. Climate, 6, 1825–1842, https://doi.org/10.1175/1520-0442(1993)006<1825:lvnbld>2.0.co;2, 1993.
Houyoux, M. R., Vukovich, J. M., Coats Jr., C. J., Wheeler, N. J. M., and Kasibhatla, P. S.: Emission inventory development and processing for the Seasonal Model for Regional Air Quality (SMRAQ) project, J. Geophys. Res.-Atmos., 105, 9079–9090, https://doi.org/10.1029/1999jd900975, 2000.
Huang, H. C., Liang, X. Z., Kunkel, K. E., Caughey, M., and Williams, A.: Seasonal simulation of tropospheric ozone over the midwestern and northeastern United States: An application of a coupled regional climate and air quality modeling system, J. Appl. Meteorol. Clim., 46, 945–960, https://doi.org/10.1175/jam2521.1, 2007.
Huang, M., Carmichael, G. R., Adhikary, B., Spak, S. N., Kulkarni, S., Cheng, Y. F., Wei, C., Tang, Y., Parrish, D. D., Oltmans, S. J., D'Allura, A., Kaduwela, A., Cai, C., Weinheimer, A. J., Wong, M., Pierce, R. B., Al-Saadi, J. A., Streets, D. G., and Zhang, Q.: Impacts of transported background ozone on California air quality during the ARCTAS-CARB period – a multi-scale modeling study, Atmos. Chem. Phys., 10, 6947–6968, https://doi.org/10.5194/acp-10-6947-2010, 2010.
Hudman, R., Jacob, D. J., Cooper, O., Evans, M., Heald, C., Park, R., Fehsenfeld, F., Flocke, F., Holloway, J., and Hübler, G.: Ozone production in transpacific Asian pollution plumes and implications for ozone air quality in California, J. Geophys. Res.-Atmos., 109, D23S10, https://doi.org/10.1029/2004JD004974, 2004.
IPCC: Climate Change 2013: The Physical Science Basis., Contribution of Working Group I to the Fifth Assessment Report (AR5) of the Intergovernmental Panel on Climate Change, 1535 pp., https://doi.org/10.1017/CBO9781107415324, 2013.
Jacob, D. J.: Heterogeneous chemistry and tropospheric ozone, Atmos. Environ., 34, 2131–2159, https://doi.org/10.1016/s1352-2310(99)00462-8, 2000.
Jaffe, D. and Ray, J.: Increase in surface ozone at rural sites in the western US, Atmos. Environ., 41, 5452–5463, https://doi.org/10.1016/j.atmosenv.2007.02.034, 2007.
Jerrett, M., Burnett, R. T., Pope, C. A., Ito, K., Thurston, G., Krewski, D., Shi, Y., Calle, E., and Thun, M.: Long-Term Ozone Exposure and Mortality, N. Engl. J. Med., 360, 1085–1095, https://doi.org/10.1056/NEJMoa0803894, 2009.
Jin, X., Fiore, A. M., Murray, L. T., Valin, L. C., Lamsal, L. N., Duncan, B., Folkert Boersma, K., De Smedt, I., Abad, G. G., Chance, K., and Tonnesen, G. S.: Evaluating a Space-Based Indicator of Surface Ozone-NOx-VOC Sensitivity Over Midlatitude Source Regions and Application to Decadal Trends, J. Geophys. Res.-Atmos., 122, 10439–10461, https://doi.org/10.1002/2017JD026720, 2017.
Kleinman, L. I.: Low and high NOx tropospheric photochemistry, J. Geophys. Res.-Atmos., 99, 16831–16838, https://doi.org/10.1029/94jd01028, 1994.
Langford, A., Aikin, K., Eubank, C., and Williams, E.: Stratospheric contribution to high surface ozone in Colorado during springtime, Geophys. Res. Lett., 36, L12801, https://doi.org/10.1029/2009GL038367, 2009.
Lefohn, A. S., Shadwick, D., and Oltmans, S. J.: Characterizing long-term changes in surface ozone levels in the United States (1980–2005), Atmos. Environ., 42, 8252–8262, https://doi.org/10.1016/j.atmosenv.2008.07.060, 2008.
Lefohn, A. S., Shadwick, D., and Oltmans, S. J.: Characterizing changes in surface ozone levels in metropolitan and rural areas in the United States for 1980-2008 and 1994–2008, Atmos. Environ., 44, 5199–5210, https://doi.org/10.1016/j.atmosenv.2010.08.049, 2010.
Lefohn, A. S., Emery, C., Shadwick, D., Wernli, H., Jung, J., and Oltmans, S. J.: Estimates of background surface ozone concentrations in the United States based on model-derived source apportionment, Atmos. Environ., 84, 275–288, https://doi.org/10.1016/j.atmosenv.2013.11.033, 2014.
Levy, H., Mahlman, J. D., Moxim, W. J., and Liu, S. C.: Tropospheric ozone – the role of transport, J. Geophys. Res.-Atmos., 90, 3753–3772, https://doi.org/10.1029/JD090iD02p03753, 1985.
Liang, X.-Z., Xu, M., Yuan, X., Ling, T., Choi, H. I., Zhang, F., Chen, L., Liu, S., Su, S., Qiao, F., He, Y., Wang, J. X. L., Kunkel, K. E., Gao, W., Joseph, E., Morris, V., Yu, T.-W., Dudhia, J., and Michalakes, J.: Regional Climate-Weather Research and Forecasting Model, B. Am. Meteorol. Soc., 93, 1363–1387, https://doi.org/10.1175/bams-d-11-00180.1, 2012.
Liang, X.-Z., Sun, C., Zheng, X., Dai, Y., Xu, M., Choi, H. I., Ling, T., Qiao, F., Kong, X., Bi, X., Song, L., and Wang, F.: CWRF performance at downscaling China climate characteristics, Clim. Dynam., 52, 2159–2184, https://doi.org/10.1007/s00382-018-4257-5, 2019.
Lin, M., Fiore, A. M., Cooper, O. R., Horowitz, L. W., Langford, A. O., Levy, H., Johnson, B. J., Naik, V., Oltmans, S. J., and Senff, C. J.: Springtime high surface ozone events over the western United States: Quantifying the role of stratospheric intrusions, J. Geophys. Res.-Atmos., 117, D00V22, https://doi.org/10.1029/2012JD018151, 2012a.
Lin, M., Fiore, A. M., Horowitz, L. W., Cooper, O. R., Naik, V., Holloway, J., Johnson, B. J., Middlebrook, A. M., Oltmans, S. J., and Pollack, I. B.: Transport of Asian ozone pollution into surface air over the western United States in spring, J. Geophys. Res.-Atmos., 117, D00V07, https://doi.org/10.1029/2011JD016961, 2012b.
Liu, S., Wang, J. X. L., Liang, X.-Z., and Morris, V.: A hybrid approach to improving the skills of seasonal climate outlook at the regional scale, Clim. Dynam., 46, 483–494, https://doi.org/10.1007/s00382-015-2594-1, 2016.
Logan, J. A., Prather, M. J., Wofsy, S. C., and McElroy, M. B.: Tropospheric chemistry – a global perspective, J. Geophys. Res.-Oc. Atm., 86, 7210–7254, https://doi.org/10.1029/JC086iC08p07210, 1981.
National Research Council: Rethinking the Ozone Problem in Urban and Regional Air Pollution, National Academics Press, Washingtong, D.C., USA, 1991.
Oltmans, S. J., Lefohn, A. S., Harris, J. M., Galbally, I., Scheel, H. E., Bodeker, G., Brunke, E., Claude, H., Tarasick, D., Johnson, B. J., Simmonds, P., Shadwick, D., Anlauf, K., Hayden, K., Schmidlin, F., Fujimoto, T., Akagi, K., Meyer, C., Nichol, S., Davies, J., Redondas, A., and Cuevas, E.: Long-term changes in tropospheric ozone, Atmos. Environ., 40, 3156–3173, https://doi.org/10.1016/j.atmosenv.2006.01.029, 2006.
Peng, Y. P., Chen, K. S., Wang, H. K., and Lai, C. H.: In Situ Measurements of Hydrogen Peroxide, Nitric Acid and Reactive Nitrogen to Assess the Ozone Sensitivity in Pingtung County, Taiwan, Aerosol Air Qual. Res., 11, 59–69, https://doi.org/10.4209/aaqr.2010.10.0091, 2011.
Pour-Biazar, A., Khan, M., Wang, L. H., Park, Y. H., Newchurch, M., McNider, R. T., Liu, X., Byun, D. W., and Cameron, R.: Utilization of satellite observation of ozone and aerosols in providing initial and boundary condition for regional air quality studies, J. Geophys. Res.-Atmos., 116, D18309, https://doi.org/10.1029/2010jd015200, 2011.
Qiao, F. X. and Liang, X. Z.: Effects of cumulus parameterizations on predictions of summer flood in the Central United States, Clim. Dynam., 45, 727–744, https://doi.org/10.1007/s00382-014-2301-7, 2015.
Qiao, F. X. and Liang, X. Z.: Effects of cumulus parameterization closures on simulations of summer precipitation over the United States coastal oceans, J. Adv. Model. Earth Syst., 8, 764–785, https://doi.org/10.1002/2015ms000621, 2016.
Qiao, F. X. and Liang, X.-Z.: Effects of cumulus parameterization closures on simulations of summer precipitation over the continental United States, Clim. Dynam., 49, 225–247, https://doi.org/10.1007/s00382-016-3338-6, 2017.
Ramanathan, V. and Dickinson, R. E.: Role of stratospheric ozone in the zonal and seasonal radiative energy-balance of the Earth-troposphere system, J. Atmos. Sci., 36, 1084–1104, 1979.
Randerson, J. T., Van Der Werf, G. R., Giglio, L., Collatz, G. J., and Kasibhatla, P. S.: Global Fire Emissions Database, Version 4.1 (GFEDv4), ORNL Distributed Active Archive Center, Oak Ridge, Tennessee, 2017.
Ring, A. M., Canty, T. P., Anderson, D. C., Vinciguerra, T. P., He, H., Goldberg, D. L., Ehrman, S. H., Dickerson, R. R., and Salawitch, R. J.: Evaluating commercial marine emissions and their role in air quality policy using observations and the CMAQ model, Atmos. Environ., 173, 96–107, https://doi.org/10.1016/j.atmosenv.2017.10.037, 2018.
Seinfeld, J. H. and Pandis, S. N.: Atmospheric Chemistry and Physics: From Air Pollution to Climate Change, 2nd ed., John Wiley & Sons, Inc., New York City, New York, 2006.
Shon, Z.-H., Lee, G., Song, S.-K., Lee, M., Han, J., and Lee, D.: Characteristics of reactive nitrogen compounds and other relevant trace gases in the atmosphere at urban and rural areas of Korea during May–June, 2004, J. Atmos. Chem., 58, 203–218, https://doi.org/10.1007/s10874-007-9088-4, 2007.
Sillman, S.: The use of NOy, H2O2, and HNO3 as indicators for ozone-NOx-hydrocarbon sensitivity in urban locations, J. Geophys. Res.-Atmos., 100, 14175–14188, https://doi.org/10.1029/94jd02953, 1995.
Sillman, S.: The relation between ozone, NOx and hydrocarbons in urban and polluted rural environments, Atmos. Environ., 33, 1821–1845, https://doi.org/10.1016/s1352-2310(98)00345-8, 1999.
Sillman, S. and He, D.: Some theoretical results concerning O3-NOx-VOC chemistry and NOx-VOC indicators, J. Geophys. Res.-Atmos., 107, 4659, https://doi.org/10.1029/2001jd001123, 2002.
Sillman, S., He, D., Cardelino, C., and Imhoff, R. E.: The Use of Photochemical Indicators to Evaluate Ozone-NOx-Hydrocarbon Sensitivity: Case Studies from Atlanta, New York, and Los Angeles, J. Air Waste Manage., 47, 1030–1040, https://doi.org/10.1080/10962247.1997.11877500, 1997.
Skamarock, W. C., Klemp, J. B., Dudhia, J., Gill, D. O., Barker, D. M., Duda, M. G., Huang, X.-Y., Wang, W., and Powers, J. G.: A Description of the Advanced Research WRF Version 3, NCAR Technical Note, NCAR/TN-475+STR, Boulder, Colorado, 113 pp., 2008.Boulder, Colorado
Stevenson, D. S., Dentener, F. J., Schultz, M. G., Ellingsen, K., van Noije, T. P. C., Wild, O., Zeng, G., Amann, M., Atherton, C. S., Bell, N., Bergmann, D. J., Bey, I., Butler, T., Cofala, J., Collins, W. J., Derwent, R. G., Doherty, R. M., Drevet, J., Eskes, H. J., Fiore, A. M., Gauss, M., Hauglustaine, D. A., Horowitz, L. W., Isaksen, I. S. A., Krol, M. C., Lamarque, J. F., Lawrence, M. G., Montanaro, V., Muller, J. F., Pitari, G., Prather, M. J., Pyle, J. A., Rast, S., Rodriguez, J. M., Sanderson, M. G., Savage, N. H., Shindell, D. T., Strahan, S. E., Sudo, K., and Szopa, S.: Multimodel ensemble simulations of present-day and near-future tropospheric ozone, J. Geophys. Res.-Atmos., 111, D08301, https://doi.org/10.1029/2005jd006338, 2006.
Sun, C. and Liang, X. Z.: Improving U.S. extreme precipitation simulation: Dependence on cumulus parameterization and underlying mechanism, Clim. Dynam., in preparation, 2020a.
Sun, C. and Liang, X. Z.: Improving U.S. extreme precipitation simulation: Sensitivity to physics parameterizations, Clim. Dynam., in preparation, 2020b.
Tagaris, E., Manomaiphiboon, K., Liao, K.-J., Leung, L. R., Woo, J.-H., He, S., Amar, P., and Russell, A. G.: Impacts of global climate change and emissions on regional ozone and fine particulate matter concentrations over the United States, J. Geophys. Res.-Atmos., 112, D14312, https://doi.org/10.1029/2006JD008262, 2007.
Tang, Y., Lee, P., Tsidulko, M., Huang, H.-C., McQueen, J. T., DiMego, G. J., Emmons, L. K., Pierce, R. B., Thompson, A. M., Lin, H.-M., Kang, D., Tong, D., Yu, S., Mathur, R., Pleim, J. E., Otte, T. L., Pouliot, G., Young, J. O., Schere, K. L., Davidson, P. M., and Stajner, I.: The impact of chemical lateral boundary conditions on CMAQ predictions of tropospheric ozone over the continental United States, Environ. Fluid Mech., 9, 43–58, https://doi.org/10.1007/s10652-008-9092-5, 2009.
Tao, W.-K., Simpson, J., and McCumber, M.: An Ice-Water Saturation Adjustment, Mon. Weather Rev., 117, 231–235, https://doi.org/10.1175/1520-0493(1989)117<0231:aiwsa>2.0.co;2, 1989.
Tong, D. Q., Lamsal, L., Pan, L., Ding, C., Kim, H., Lee, P., Chai, T. F., Pickering, K. E., and Stajner, I.: Long-term NOx trends over large cities in the United States during the great recession: Comparison of satellite retrievals, ground observations, and emission inventories, Atmos. Environ., 107, 70–84, https://doi.org/10.1016/j.atmosenv.2015.01.035, 2015.
Tong, D. Q., Pan, L., Chen, W., Lamsal, L., Lee, P., Tang, Y., Kim, H., Kondragunta, S., and Stajner, I.: Impact of the 2008 Global Recession on air quality over the United States: Implications for surface ozone levels from changes in NOx emissions, Geophys. Res. Lett., 43, 9280–9288, https://doi.org/10.1002/2016gl069885, 2016.
Tonnesen, G. S. and Dennis, R. L.: Analysis of radical propagation efficiency to assess ozone sensitivity to hydrocarbons and NOx: 1. Local indicators of instantaneous odd oxygen production sensitivity, J. Geophys. Res.-Atmos., 105, 9213–9225, https://doi.org/10.1029/1999jd900371, 2000a.
Tonnesen, G. S. and Dennis, R. L.: Analysis of radical propagation efficiency to assess ozone sensitivity to hydrocarbons and NOx: 2. Long-lived species as indicators of ozone concentration sensitivity, J. Geophys. Res.-Atmos., 105, 9227–9241, https://doi.org/10.1029/1999jd900372, 2000b.
US EPA: Air quality criteria for ozone and related photochemical oxidants, Environ. Prot. Agency, Research Triangle Park, N.C., USA, 2006.
US EPA: AQS observation data, available at: https://www.epa.gov/outdoor-air-quality-data, last access in May 2016.
US EPA: CMAQ, available at: https://www.cmascenter.org/cmaq/, last access: August 2017.
van der Werf, G. R., Randerson, J. T., Giglio, L., van Leeuwen, T. T., Chen, Y., Rogers, B. M., Mu, M., van Marle, M. J. E., Morton, D. C., Collatz, G. J., Yokelson, R. J., and Kasibhatla, P. S.: Global fire emissions estimates during 1997–2016, Earth Syst. Sci. Data, 9, 697–720, https://doi.org/10.5194/essd-9-697-2017, 2017.
Wang, H., Jacob, D. J., Le Sager, P., Streets, D. G., Park, R. J., Gilliland, A. B., and van Donkelaar, A.: Surface ozone background in the United States: Canadian and Mexican pollution influences, Atmos. Environ., 43, 1310–1319, https://doi.org/10.1016/j.atmosenv.2008.11.036, 2009.
WHO: Health aspects of air pollution with particulate matter, ozone and nitrogen dioxide, Wolrd Health Organisation, Bonn, Germany, 2003.
Xie, Y., Elleman, R., Jobson, T., and Lamb, B.: Evaluation of O3-NOx-VOC sensitivities predicted with the CMAQ photochemical model using Pacific Northwest 2001 field observations, J. Geophys. Res.-Atmos., 116, D20303, https://doi.org/10.1029/2011jd015801, 2011.
Xu, K.-M. and Randall, D. A.: A Semiempirical Cloudiness Parameterization for Use in Climate Models, J. Atmos. Sci., 53, 3084–3102, https://doi.org/10.1175/1520-0469(1996)053<3084:ascpfu>2.0.co;2, 1996.
Yarwood, G. S., Whitten, G. Z., Jung, J., Heo, G., and Allen, D.: Development, Evaluation and Testing of Version 6 of the Carbon Bond Chemical Mechanism (CB6), available at: https://www.tceq.texas.gov/assets/public/implementation/air/am/contracts/reports/pm/5820784005FY1026-20100922-environ-cb6.pdf (last access: August 2017), 2010.
Yuan, X. and Liang, X. Z.: Improving cold season precipitation prediction by the nested CWRF-CFS system, Geophys. Res. Lett., 38, L02706, https://doi.org/10.1029/2010gl046104, 2011.
Zhang, Y., Vijayaraghavan, K., Wen, X. Y., Snell, H. E., and Jacobson, M. Z.: Probing into regional ozone and particulate matter pollution in the United States: 1. A 1 year CMAQ simulation and evaluation using surface and satellite data, J. Geophys. Res.-Atmos., 114, D22304, https://doi.org/10.1029/2009jd011898, 2009a.
Zhang, Y., Wen, X. Y., Wang, K., Vijayaraghavan, K., and Jacobson, M. Z.: Probing into regional O-3 and particulate matter pollution in the United States: 2. An examination of formation mechanisms through a process analysis technique and sensitivity study, J. Geophys. Res.-Atmos., 114, D22305, https://doi.org/10.1029/2009jd011900, 2009b.
Zhu, J. H. and Liang, X. Z.: Impacts of the Bermuda High on Regional Climate and Ozone over the United States, J. Climate, 26, 1018–1032, https://doi.org/10.1175/jcli-d-12-00168.1, 2013.


