the Creative Commons Attribution 4.0 License.
the Creative Commons Attribution 4.0 License.
Concentrations, composition, and sources of ice-nucleating particles in the Canadian High Arctic during spring 2016
Erin Evoy
Jingwei Yun
Yu Xi
Sarah J. Hanna
Alina Chivulescu
Kevin Rawlings
Daniel Veber
Andrew Platt
Daniel Kunkel
Peter Hoor
Sangeeta Sharma
W. Richard Leaitch
Modelling studies suggest that the climate and the hydrological cycle are sensitive to the concentrations of ice-nucleating particles (INPs). However, the concentrations, composition, and sources of INPs in the atmosphere remain uncertain. Here, we report daily concentrations of INPs in the immersion freezing mode and tracers of mineral dust (Al, Fe, Ti, and Mn), sea spray aerosol (Na+ and Cl−), and anthropogenic aerosol (Zn, Pb, , , and non-sea-salt ) at Alert, Canada, during a 3-week campaign in March 2016. In total, 16 daily measurements of INPs are reported. The average INP concentrations measured in the immersion freezing mode were 0.005±0.002, 0.020±0.004, and 0.186±0.040 L−1 at −15, −20, and −25 ∘C, respectively. These concentrations are within the range of concentrations measured previously in the Arctic at ground level or sea level. Mineral dust tracers all correlated with INPs at −25 ∘C (correlation coefficient, R, ranged from 0.70 to 0.76), suggesting that mineral dust was a major contributor to the INP population at −25 ∘C. Particle dispersion modelling suggests that the source of the mineral dust may have been long-range transport from the Gobi Desert. Sea spray tracers were anti-correlated with INPs at −25 ∘C (). In addition, INP concentrations at −25 ∘C divided by mass concentrations of aluminum were anti-correlated with sea spray tracers ( and −0.55 for Na+ and Cl−, respectively), suggesting that the components of sea spray aerosol suppressed the ice-nucleating ability of mineral dust in the immersion freezing mode. Correlations between INPs and anthropogenic aerosol tracers were not statistically significant. These results will improve our understanding of INPs in the Arctic during spring.
- Article
(5112 KB) - Full-text XML
-
Supplement
(5287 KB) - BibTeX
- EndNote
The formation of ice in clouds can be initiated by homogeneous or heterogeneous nucleation. Heterogeneous nucleation of ice in clouds occurs on only a small subset of atmospheric particles, referred to as ice-nucleating particles (INPs) (Vali et al., 2015). A variety of aerosol particle types have been identified as possible INPs, including, but not limited to, mineral dust, sea spray aerosol containing biological material, and primary biological particles from terrestrial sources (Coluzza et al., 2017; Cziczo et al., 2017; Hoose and Möhler, 2012; Kanji et al., 2017; Murray et al., 2012). INPs can change the frequency and properties of clouds in the atmosphere and influence climate and precipitation (Andreae and Rosenfeld, 2008; Curry, 1995; DeMott et al., 2010; Du et al., 2011; Lohmann and Feichter, 2005; Prenni et al., 2007; Xie et al., 2013). As a result, to predict precipitation and Earth's climate, an understanding of the concentrations, composition, and sources of INPs in the atmosphere is required.
INPs have been measured in the Arctic since as early as the 1970s (Bigg, 1996; Bigg and Leck, 2001; Borys, 1989; Conen et al., 2016; Creamean et al., 2018; DeMott et al., 2016; Flyger et al., 1973, 1976; Flyger and Heidam, 1978; Fountain and Ohtake, 1985; Mason et al., 2016; McFarquhar et al., 2011; Prenni et al., 2007, 2009; Radke et al., 1976; Rogers et al., 2001). Nevertheless, our understanding of the concentrations, composition, and sources of INPs in this region is incomplete. In the following, we focus on INPs in the Arctic during the spring. In the Arctic winter–spring, land is mostly covered by snow, and hence local emissions of mineral dust and primary terrestrial biological particles are expected to be small. In addition, a large fraction of the Arctic Ocean is covered by ice, limiting emissions of sea spray aerosol. On the other hand, during the winter–spring, long-range transport of particles from midlatitudes is important, and removal processes of aerosols are reduced, leading to elevated aerosol particle concentrations in the region, referred to as Arctic haze (Barrie, 1986; Barrie et al., 1981; Norman et al., 1999; Pacyna, 1995; Quinn et al., 2007; Shaw, 1995).
There have only been a small number of measurements of INPs in the Arctic during the spring (Borys, 1989; Creamean et al., 2018; Fountain and Ohtake, 1985; Mason et al., 2016; McFarquhar et al., 2011; Radke et al., 1976; Rogers et al., 2001). Of note, Borys (1989) measured INP concentrations in April 1986 and found that low concentrations of INPs were associated with tracers of pollution, while high concentrations of INPs were associated with a tracer of mineral dust. Fountain and Ohtake (1985) measured surface INP concentrations in Alaska from August 1978 to March 1979 and observed that high INP concentrations in March were correlated with air masses transported from Eurasia. Rogers et al. (2001) measured concentrations and the chemical composition of INPs during aircraft studies in May 1998. Chemical analysis of the INPs indicated that a significant fraction of the INPs (approximately 37 %) contained mineral dust. Mason et al. (2016) carried out size-resolved measurements of INPs from the end of March to late July 2014. They found that a large fraction (>60 % at −20 ∘C) of the INPs were larger than 1 µm, indicating that supermicron particles such as mineral dust or sea spray aerosol containing biological material contributed to a majority of the INPs.
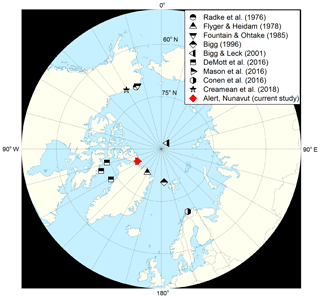
Figure 1The locations of previous ground-based and ship-based INP studies in the Arctic. For Bigg (1996) and Bigg and Leck (2001), samples were collected along the ship track, but only one location for each study is shown in this map. The red diamond represents the location of current study.
In the following, we investigate the composition and sources of INPs at Alert, Nunavut in the Canadian High Arctic from 11 to 29 March 2016. This study was carried out as part of the Network on Climate and Aerosols: Addressing Key Uncertainties in Remote Canadian Environments (NETCARE). Specifically, we measured the concentrations of INPs daily in the immersion freezing mode, and concentrations of tracers of mineral dust (Al, Fe, Ti, and Mn), sea spray aerosol (Na+ and Cl−), and anthropogenic aerosol (Zn, Pb, , , and non-sea-salt ). These data were used to determine if mineral dust, sea spray aerosol, and anthropogenic aerosol are a major contributor to the INP population at −15, −20, and −25 ∘C in the Canadian High Arctic during spring. Studies as a function of temperature are necessary since different types of aerosols are ice active at different temperatures. Although a few studies have identified mineral dust particles as an important contributor to the INP population in the Arctic during spring, additional studies are needed to determine how often mineral dust is an important contributor. The measurements reported here together with particle dispersion modelling were also used to assess the source of the INPs at a freezing temperature of −25 ∘C.
2.1 Sampling location
Sampling was conducted at the Dr. Neil Trivett Global Atmosphere Watch Observatory (82.5∘ N, 62.5∘ W) at Alert, Nunavut (Fig. 1), a research laboratory operated by Environment and Climate Change Canada. The research laboratory is on a plateau that is approximately 185 m a.s.l. (above sea level) and is powered by electricity generated by the Canadian Forces Station Alert, which is 6 km to the north of the research laboratory. The population at Alert is about 75 on a regular basis. The closest community is Grise Fiord (population 129) located approximately 800 km to the south of Alert.
2.2 INP measurements
Concentrations of INPs were determined by first collecting particles on hydrophobic glass slides with an inertia impactor followed by determining the freezing temperatures of the collected aerosol particles with the droplet freezing technique (DeMott et al., 2016; Irish et al., 2019). Details are given below.
2.2.1 Inertia impactor
The inertia impactor (model 100–180nm–10lpm; MSP Corp., Shoreview, MN, USA) consisted of two impactor stages. The first impactor stage collected particles with aerodynamic diameters > 10 µm, and the second impactor stage collected particles with aerodynamic diameters between 0.18 and 10 µm. For each collection period, three circular hydrophobic glass slides (HR3-277; Hampton Research, USA) were placed on the second impactor stage simultaneously to collect particles for INP analysis. As a result, each collected sample consisted of three hydrophobic glass slides. Due to the design of the impactor, the collected particles were concentrated into spots on the hydrophobic glass slides. Particles collected on the first stage were not analyzed. The hydrophobic glass slides were cleaned with Millipore water and dried with ultrapure nitrogen gas before being sent to the field for particle collection. After collection, all slides were placed in petri dishes, wrapped in aluminum foil, and stored at 4 ∘C before analysis. The inertia impactor was operated at a flow rate of 10 L min−1, and the average collection time for INP samples was approximately 2 h.
The inertia impactor was located within the Dr. Neil Trivett Global Atmosphere Watch Observatory. Aerosol particles were first sampled through a louvered total suspended particulate (TSP) inlet (Mesa Labs Inc., Butler, NJ, USA) that was approximately 10 m a.g.l. (above ground level). Next, the aerosol particles were passed through a humidifier (model FC125-240; Perma Pure LLC, Lakewood, NJ, USA) to condition the aerosol particles to an average relative humidity (RH) of 84 % at room temperature. Finally, the aerosol particles were passed through the inertia impactor to collect the particles on the hydrophobic glass slides for INP analysis. In total, 16 daily measurements of INPs are reported in this study.
When sampling aerosol particles with an inertia impactor, a possible issue is particle rebound from the collection substrate. Rebound occurs when the kinetic energy of the particles striking the impactor substrate exceeds the adhesion and dissipation energies at impact (Bateman et al., 2014). If rebound is a factor, the measured INP concentrations will be lower than the actual INP concentrations in the atmosphere. Previous work has shown that particle rebound can be reduced when RH is above 70 % (Bateman et al., 2014; Chen et al., 2011; Fang et al., 1991), although this will depend on the chemical composition of the particles. In addition, field measurements of INP concentrations using a similar inertia impactor have shown good agreement with INP concentrations measured by a continuous flow diffusion chamber (a technique that is not susceptible to rebound) when the RH of the sampled aerosol stream was as low as 40 % (DeMott et al., 2017; Mason et al., 2015). In our experiments, the RH was increased to an average value of 84 % at room temperature with a humidifier to reduce rebound. However, rebound cannot be completely ruled out.
2.2.2 Droplet freezing technique
The INP number concentrations in the immersion freezing mode were determined with the droplet freezing technique (Iannone et al., 2011; Mason et al., 2015; Wheeler et al., 2015). Briefly, the hydrophobic glass slides used to collect aerosol particles with the inertia impactor were placed in a temperature- and humidity-controlled flow cell coupled to an optical microscope (Axiolab; Zeiss, Oberkochen, Germany) with a CCD camera. Typically between 15 and 25 spots of particles (out of 300 spots generated by the inertia impactor) were visible in the microscopic field of view. The diameter of each spot was approximately 110 µm. After locating the hydrophobic glass slides in the flow cell, the temperature in the flow cell was decreased to approximately 0 ∘C and a humidified flow of helium with a dew point of approximately 3 ∘C was passed over the hydrophobic glass slide, resulting in water droplets with diameters of approximately 100–500 µm condensing on the spots of particles as well as other areas on the glass slides. Droplets that condensed on the spots of particles are referred to as spot droplets, while droplets that condensed on other areas of the slide are referred to as non-spot droplets. After condensation of the water droplets, the flow cell was cooled down to −40 ∘C at a rate of −10 ∘C min−1 while images of the droplets were recorded. A small flow of dry helium (∼0.2 L min−1) was passed through the flow cell during the cooling process to prevent further condensation of water vapour. The freezing temperature of each droplet was then determined from the images. The droplets that overlapped with spots of particles were also identified from these images. The number of INPs, #INPs, within the microscopic field of view was calculated as a function of temperature using the following equation:
where Nus(T) is the number of unfrozen spot droplets at temperature T, and Ns is the total number of spots analyzed in the microscopic field of view. Equation (1) represents the cumulative nucleus spectrum or the number of INPs active at all temperatures ≥ T. The use of Eq. (1) to quantify the number of INPs active at all temperatures ≥ T from droplet freezing experiments has been justified using Poisson's law and Monte Carlo simulations (Vali, 1971).
Equation (1) assumes that each droplet covered only one spot. However, sometimes more than one droplet formed on one spot. In these cases, the first droplet to freeze was considered in Eq. (1), which should give the equivalent result to one droplet condensing on one spot. Another situation is when one droplet covered two spots (this occurred for less than 5 % of the total analyzed spot droplets). For these cases, an upper limit of the number of INPs was calculated by assuming two droplets covered the two spots and both droplets froze at the observed freezing temperature. A lower limit was calculated by assuming two droplets covered the two spots with one droplet freezing at the observed freezing temperature and the other freezing at −37 ∘C (approximately the homogeneous freezing temperature of the droplets). A similar approach was applied to cases where one droplet covered three or more spots.
Freezing of non-spot droplets was less frequent than freezing of spot droplets at temperatures ≥ −25 ∘C. For example, the ratio of frozen non-spot droplets to frozen spot droplets was 0.2 at −25 ∘C. Freezing of non-spot droplets may have been due to INPs < 0.18 µm in diameter not focused into the spots or a small fraction of INPs ≥ 0.18 µm not concentrated into the spots due to rebound from the hydrophobic glass slides. To take into account the INPs in the non-spot droplets, we assumed each frozen non-spot droplet contained one INP, and the number of frozen non-spot droplets, Nns, was added to Eq. (1), resulting in the following equation:
During the freezing experiments, most freezing events occurred by immersion freezing, while some occurred by contact freezing, which refers to the freezing of liquid droplets coming into contact with neighbouring frozen droplets. Contact freezing only accounted for approximately 2 % of the total freezing events, and droplets that froze by contact freezing were not considered when determining the INP concentrations.
The INP concentration as a function of temperature in the atmosphere, [INPs(T)], was calculated using the following equation:
where 300 is the number of nozzles in the nozzle plate of the impactor, and consequently, the number of spots of particles generated on the second stage of the impactor, V is the total volume of air sampled by the impactor, and fne represents the uncertainty associated with the limited number of nucleation events detected and is based on nucleation statistics (Koop et al., 1997). In Eq. (3), the ratio of 300∕Ns accounts for the fact that only a fraction of total spots was analyzed with the droplet freezing technique. The overall uncertainty in the concentrations of INPs reported here includes the uncertainty from the limited number of nucleation events, as well as the other uncertainties discussed above.
Droplet freezing experiments were also performed on glass slides that were not exposed to any particles. These slides are referred to as blanks. One field blank was collected by treating the slides in the same manner as the sample hydrophobic slides including locating the hydrophobic slides in the impactor, except that the pump was not turned on. Lab blanks refer to slides cleaned in the same manner as the ones used for sampling in the field but not sent to the field. For the blanks, we assumed the number of INPs was equal to the number of observed freezing events since multiple INPs within the same droplet were unlikely at temperatures ≥ −25 ∘C. [INPs(T)] was then calculated using Eq. (3) with the assumptions that Ns is 21 (average number of spots analyzed in one experiment) and V is 1208 L (average air volume sampled).
2.3 Meteorological parameters
Local ground-level meteorological conditions were monitored at the site by Environment and Climate Change Canada. The March 2016 data were retrieved from http://climate.weather.gc.ca/ (last access: 28 August 2018) (climate IDs 2400305 and 2400306). The ambient temperature, ambient RH, wind speed, and wind direction were measured hourly. The sum of the total rainfall and the water equivalent of the total snowfall in millimetres was measured daily as total precipitation.
2.4 Tracers of mineral dust, sea spray, and anthropogenic aerosol
The elements Al, Fe, Ti, and Mn were used as tracers of mineral dust, as done previously (Balasubramanian et al., 2003; Barrie and Barrie, 1990; Formenti et al., 2003; Malm et al., 1994; Quinn et al., 2004). These elements are components of the Earth's crust (Usher et al., 2003; Wedepohl, 1995). The species Na+ and Cl−, which are the major inorganic components of seawater (Holland, 1978), were used as tracers of sea spray, as done previously (Balasubramanian et al., 2003; Malm et al., 1994; Quinn et al., 2002, 2004). For tracers of anthropogenic aerosol, we used Zn, Pb, , , and non-sea-salt (nss-). Pb and Zn are almost exclusively from anthropogenic sources (Macdonald et al., 2000; Nriagu and Pacyna, 1988; Pacyna, 1995). The major anthropogenic sources for Pb are gasoline combustion and, to a lesser extent, non-ferrous metal industry and fossil fuel combustion, and the major anthropogenic sources for Zn are non-ferrous metal industry followed by fossil fuel combustion (Barrie et al., 1992; Nriagu and Pacyna, 1988; Pacyna, 1995). , , and nss- can come from both anthropogenic and natural sources, but mostly from anthropogenic sources. is mainly formed from NOx, which is emitted from combustion processes (Seinfeld and Pandis, 2006). originates mainly from agricultural activities (Follett and Hatfield, 2001). The main anthropogenic source of nss- is fossil fuel combustion (Schwikowski et al., 1999; Ward, 2009).
To determine the concentrations of the tracers discussed above, aerosol particulate samples were collected on 20×25 cm Whatman-41 quartz filters daily using a high-volume sampler (Barrie et al., 1981, 1989), which was located approximately 500 m away from the laboratory on the ground. The face velocity of sampling (50 cm s−1) and typical filter loadings ensured collection efficiencies better than 95 % (Watts et al., 1987). The average sampling time was 23.5 h except for the first sample, which was collected over 2 days due to a storm making it difficult to change the filter. Hence, collection times for tracer measurements (∼24 h) were different than the collection times for INP measurements (∼2 h). The implications of the different collection times are discussed in Sect. 3.3. For the filter samples, the average total air volume sampled was roughly 2300 m3 at standard conditions of 1 atm pressure and 0 ∘C. The precision of volume sampled was estimated to be ±5 % (Sirois and Barrie, 1999). The quartz filter samples were stored at room temperature before analysis.
The concentrations of Al, Fe, Ti, Mn, Zn, and Pb were determined using inductively coupled plasma atomic emission spectroscopy (ICP-AES). These experiments were carried out at Chester LabNet, Oregon, USA. Punches from the quartz filters were submerged in a solution containing ultrapure HNO3 and HCl. The solution was then heated and sonicated, and then further diluted and filtered before being nebulized and analyzed by the ICP-AES (Perkin-Elmer Optima 8300). Sample duplicates were also analyzed to estimate the method precision. The accuracy and precision of the technique were estimated to be ±10 %.
The concentrations of Cl−, Na+, , , and were determined using ion chromatography (IC) (Macdonald et al., 2017; Toom-Sauntry and Barrie, 2002). These experiments were carried out at Environment and Climate Change Canada in Ontario, Canada. To quantify water-soluble cations and anions, punches taken from each quartz filter were extracted in deionized water, and the extraction solution was passed through an IC (Dionex IC: DX600). The concentration of nss- was calculated using the following equation based on the assumption that the chemical composition of sea salt particles is the same as that of seawater (Millero, 1974):
To determine whether the calculated concentrations of nss- were sensitive to depletion of Cl− in the particles, we also calculated nss- using Na+ rather than Cl− (Balasubramanian, 2003). The difference between the concentrations of nss- based on Cl− and the concentrations based on Na+ was less than 5 %.
2.5 Particle dispersion modelling
The source regions of measured air masses were investigated using the Lagrangian FLEXible PARTicle dispersion model (FLEXPART) (Stohl et al., 2005), which was driven using operational meteorological analyses from the European Centre for Medium-Range Weather Forecasts (ECMWF). FLEXPART was run at hourly intervals in the backward mode for each sample collected for INP analysis. In each run, 40 000 particles were released over 1 min in a 0.1∘ × 0.1∘ area. The particles were followed backward for 20 days with output generated at 1 h intervals. In backward mode, FLEXPART provides potential emission sensitivities as output. This is the response function of a source–receptor matrix (Seibert and Frank, 2004) and corresponds directly to the residence time of the released particles in a given volume of air. For each run, the hourly output was integrated over the 20 days to produce a potential emission sensitivity (PES) plot. For a given INP sample, the mean PES plot was generated by averaging all hourly PES plots. Since the focus of this study is INP sources close to the surface, near-surface PES plots (from the surface up to 100 m) were plotted as footprint PES plots.
2.6 Statistical analysis
To compute a correlation coefficient (R), Pearson correlation analysis was applied between INPs and the variables measured in this study. The P values were also calculated using a t test for Student's t distribution to determine if the correlations were statistically significant at the 95 % confidence level (P<0.05).
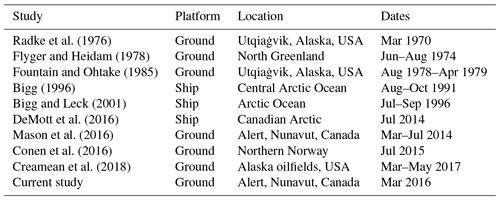
Table 1Measurements of the concentrations of INPs at ground level or sea level in the Arctic. Included is the information on the sampling platform (ground vs. ship based), location, and dates.
3.1 Concentrations of INPs
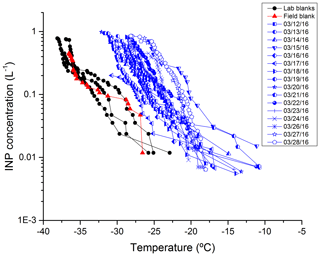
Concentrations of INPs in the immersion mode are plotted as a function of temperature in Fig. 2. Concentrations of INPs measured were higher than concentrations of the blanks. In addition, all of the samples have warmer onset temperatures than the blanks, with onset temperatures of the samples varying from approximately −11 to −22 ∘C. For the remainder of this document, we focus on INP concentrations at −15, −20, and −25 ∘C. INP concentrations at temperatures warmer than −15 ∘C are not discussed because freezing events at these temperatures were rare. INP concentrations at temperatures below −25 ∘C are not discussed since freezing of the blanks became significant at these temperatures. Since freezing was rarely observed at ∘C in the blank experiments, the INP concentrations determined in the blank experiments were not subtracted from the INP concentrations reported in this study.
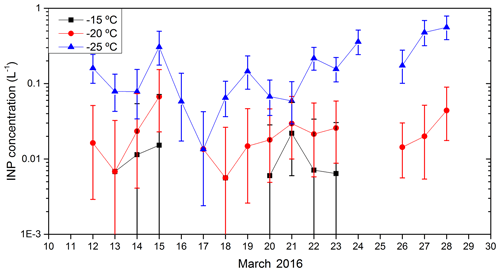
Figure 4The time series of INP concentrations at −15, −20, and −25 ∘C. INP samples were not collected on 25 March due to time constraints. On several days, INP concentrations are shown at −25 ∘C, but not at −15 ∘C and some cases not at −20 ∘C. In these cases, INP concentration was below the detection limit and hence not shown in this figure. The uncertainties in INP concentrations were calculated as described in Sect. 2.2.2.
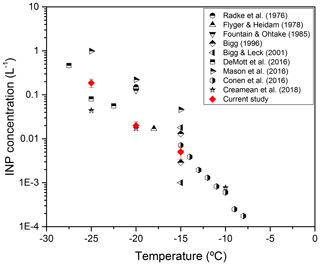
In the current study, the mean number concentration of INPs was 0.005±0.002 L−1 at −15 ∘C, 0.020±0.004 L−1 at −20 ∘C, and 0.186±0.040 L−1 at −25 ∘C (Fig. 3). These concentrations are within the range of INP concentrations measured in previous studies at ground level or sea level in the Arctic (Fig. 3). The sampling platform, location, and dates of previous Arctic INP studies at ground level or sea level that are shown in Fig. 3 are summarized in Table 1 and Fig. 1 for comparison purposes.
The time series of INP concentrations measured in the current study at −15, −20, and −25 ∘C is plotted in Fig. 4. The difference between the highest INP concentration at −25 ∘C (measured on 28 March) and the lowest INP concentration at −25 ∘C (measured on 17 March) was roughly a factor of 50.
Table 2The correlation coefficient (R) matrix between each of the measured aerosol constituents. Strong correlations (R≥0.7) that are statistically significant at the 95 % confidence level (P<0.05) are highlighted in bold.
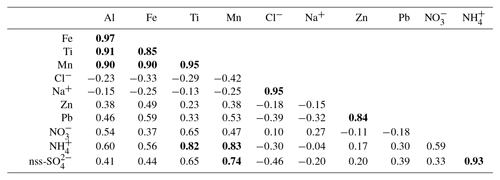
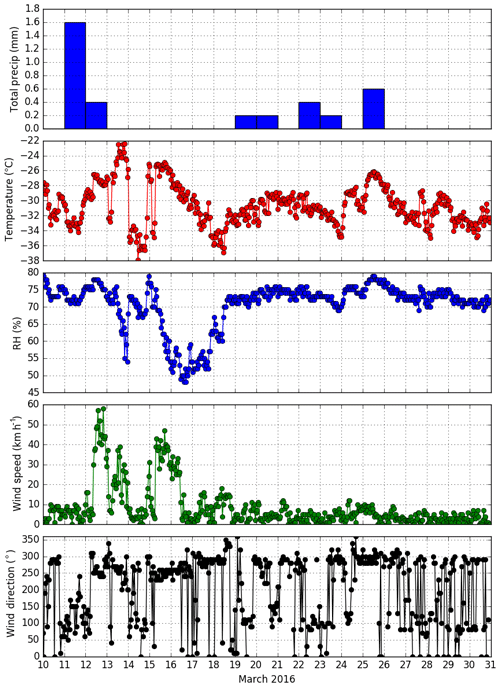
Figure 5The time series of meteorological parameters, including total precipitation, ambient temperature, ambient relative humidity (RH), wind speed, and wind direction. The meteorological data were retrieved from http://climate.weather.gc.ca/ (last access: 28 August 2018). For wind direction, a value of zero denotes a calm wind, and a value of 360 denotes a wind blowing from the geographic North Pole.
3.2 Meteorological parameters and correlations with INPs
Shown in Fig. 5 is the time series of meteorological parameters measured at Alert during the field campaign. Precipitation was rare throughout the campaign, and the average ambient temperature was approximately −30 ∘C. The RH was above 70 % for most of the time. The wind speed was below 10 km h−1 except for two storm events during the first part of the campaign. During the field campaign, the wind came mainly from the SW (more than half of the time) with some contribution from the SE and NW.
In the current study, INP concentrations at freezing temperatures of −15, −20, and −25 ∘C were not correlated with any meteorological parameters (Table S1 in the Supplement). This result is consistent with the results from Fountain and Ohtake (1985), who also did not find any correlations between meteorological variables (including air temperature, precipitation, fog, and wind direction, etc.) and INP concentrations measured in Utqiaġvik (formerly Barrow), Alaska, from August 1978 to April 1979. In contrast, measurements by Radke et al. (1976) in Utqiaġvik, Alaska, during March found that the INP concentrations were affected by local weather conditions.
3.3 Tracers of mineral dust: concentrations, correlations with INPs, and sources
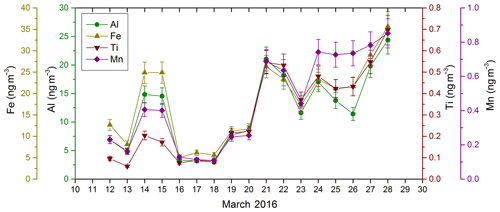
The time series of concentrations of mineral dust tracers (Al, Fe, Ti, and Mn) is plotted in Fig. 6. Figure 6 shows that concentrations of different tracers of mineral dust are correlated with each other. Shown in Table 2 is a correlation coefficient matrix between each of the tracers based on a Pearson correlation analysis. Correlations that are both strong (R≥0.7) and statistically significant (P<0.05) are highlighted in bold. The correlation coefficients show that the mineral dust tracers are strongly correlated with each other (R≥0.85), which is expected since these elements are almost exclusively from the mineral dust sources.
In Fig. 7a, we compared the mean mass concentration of aluminum we measured at the site during the campaign with the concentrations reported in Sirois and Barrie (1999) for the same site and for the time period from 1980 to 1995. The mean mass concentration of aluminum measured during the current study was lower than the previous concentrations measured in March at Alert, indicating that the concentration of mineral dust during the current campaign was lower than many of the previous measurements at Alert during March.
Table 3Results of Pearson correlation analysis between the INP number concentrations (at freezing temperatures of −15, −20, and −25 ∘C) and tracers of aerosol components measured in this study. R is the correlation coefficient, P is the probability value (two tailed), and the sample number is 16. Correlations that are statistically significant at the 95 % confidence interval (P<0.05) are highlighted in bold.
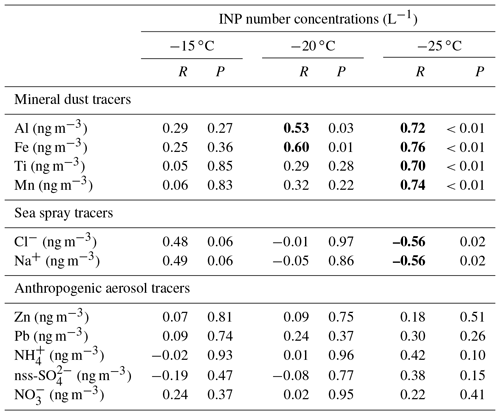
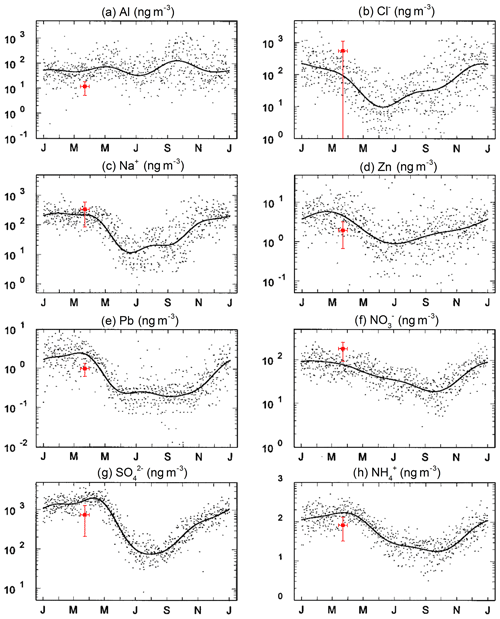
Figure 7Comparison between the mean mass concentrations of each of the aerosol tracers measured at the Alert site during the current study and the concentrations reported from a 15-year (1980–1995) study at the same site (Sirois and Barrie, 1999). The x axis represents the months. The black dots represent the weekly concentrations measured by Sirois and Barrie (1999), and the black line represents the estimated seasonal variations. The red symbols represent the mean mass concentrations measured in this study with standard deviation as y-error bars. The x-error bars represent the time period of this study. The mass concentrations of Fe, Ti, and Mn were not available from the 15-year study.
Pearson regression analysis was also done between INP concentrations at −15, −20 and −25 ∘C, and tracers of mineral dust. The correlation coefficients and P values are summarized in Table 3. The linear regression plots between INP concentrations at −25 ∘C and mineral dust tracers are shown in Fig. 8. When calculating the correlation coefficients, a value of zero was used when tracer concentrations and INP concentrations were below the detection limits. It is important to keep in mind that the collection time was different for INPs (∼2 h) and the aerosol tracers (∼24 h), and that the analysis presented here is based on the assumption that the average concentrations of the aerosol tracers during the INP sampling time were the same as the average concentrations determined from the quartz filters. If this assumption is not correct, correlation coefficients between INPs and aerosol tracers will be smaller than expected. Shown in Fig. S1 in the Supplement are air mass back trajectories initiated every 2 h during each 24 h quartz filter sampling period. The back trajectories suggest that, for a large fraction of the samples, the source of the air masses during INP sampling was similar to the source of the air masses measured during quartz filter sampling.
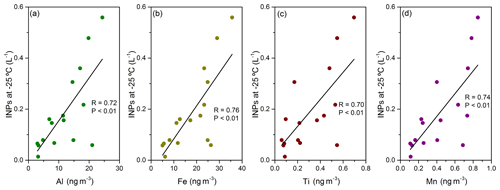
Figure 8Correlation plots between INP concentrations at −25 ∘C and mineral dust tracers (Al, Fe, Ti, and Mn). Included in each panel are the correlation coefficient (R) and the probability value (P).
As shown in Table 3, at −15 ∘C, the correlations between INP concentrations and tracers of mineral dust were not statistically significant (P>0.05). At −20 ∘C, the correlations between INPs and Ti and Mn were not statistically significant. Al and Fe were moderately correlated with INPs at −20 ∘C (R=0.53 and 0.60, respectively), and the correlations were statistically significant (P<0.05). At −25 ∘C, all four tracers were strongly correlated with INPs (R ranged from 0.70 to 0.76), and the correlations were statistically significant. This suggests that mineral dust was a component of the sampled INPs at a freezing temperature of −25 ∘C. This is consistent with previous field measurements that have identified mineral dust as a major component of the INP population at different locations (Boose et al., 2016; Cziczo et al., 2013; DeMott et al., 2003; Klein et al., 2010; Pratt et al., 2009; Prenni et al., 2009). A previous study of ice nucleation of Arctic aerosol found that the elements of crustal or natural dust were associated with high concentrations of INPs at −15 and −25 ∘C (Borys, 1989). Chemical analysis of the INPs during aircraft studies in the Arctic indicated that a significant fraction of the INPs (approximately 37 %) contained mineral dust (Rogers et al., 2001). Another study of snow crystals during summer on the Greenland ice cap also suggested that the natural snow crystals mainly formed on clay mineral particles by heterogeneous nucleation (Kumai and Francis, 1962).
Mineral dust at Alert can come from both local sources and long-range transport, but during the spring local sources are not likely important since land is covered with snow during this time of the year. To investigate the origins of mineral dust measured in this study, the FLEXPART model was used to generate the footprint PES plots, which show the residence time of aerosol particles in the layer from 0 to 100 m in altitude during the 20 days prior to sampling. Results are shown in Fig. 9. Figure 9a shows the surface coverage type on the first day of sampling (12 March). The sampling location at Alert was surrounded by ice and snow during the campaign. Figure 9b shows the average footprint PES plot for all samples, and Fig. 9c shows the average footprint PES plot for the four samples with the highest mineral dust concentrations, which were collected on 21, 22, 27, and 28 March. Note that since average footprint PES plots are shown in Fig. 9b and c, Fig. 9c is not a subset of Fig. 9b. Shown in Fig. 9d is a ratio plot of the sum of footprint PES plots of the four samples with the highest mineral dust concentrations to the sum of footprint PES plots of all samples. These types of ratio plots are often used as a sensitive method to identify the source regions of a component under investigation (Hirdman et al., 2010). In these types of plots, a value close to 1 indicates a more likely source region. Figure 9d suggests that the north Pacific Ocean, Alaska, and the Gobi Desert were possible source regions of the mineral dust sampled. Alaska was covered in snow during the sampling period, so this was not likely the source of the mineral dust, although mineral dust resuspended from blowing snow cannot be ruled out. Mineral dust from shorelines also cannot be ruled out. The north Pacific Ocean is not likely the source of mineral dust either since the Pacific Ocean is not considered as a traditional source of mineral dust. Based on the surface coverage types (Fig. 9a) and the ratio plot (Fig. 9d), a possible source of the mineral dust was long-range transport of dust from the Gobi Desert. This conclusion is consistent with previous studies that have shown that a substantial fraction of the dust reaching Alert in spring months comes from long-range transport of Asian dust (Drab et al., 2002; Franzén et al., 1994; Pacyna and Ottar, 1989; Sirois and Barrie, 1999; Welch et al., 1991).
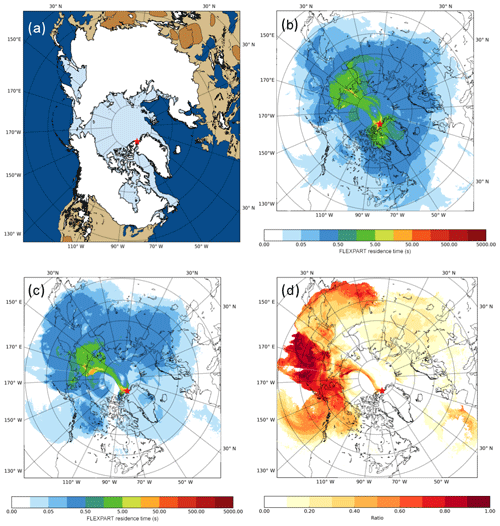
Figure 9Panel (a) shows the surface coverage types on the first day of sampling (12 March 2016). White represents snow, light blue represents ice, dark blue represents ocean, light brown represents land, and dark brown represents desert (data from National Snow and Ice Data Center, https://doi.org/10.7265/N52R3PMC, last access: 20 March 2018); panel (b) is the average footprint PES plot from a 20-day FLEXPART analysis for all samples; panel (c) is the average footprint PES plot for the four samples with the highest mineral dust concentrations, which were collected on 21, 22, 27, and 28 March; panel (d) shows the ratio of the sum of footprint PES plots of the four samples with the highest mineral dust concentrations to the sum of footprint PES plots of all samples. The red star indicates the sampling location.
3.4 Tracers of sea spray aerosol: concentrations and correlations with INPs
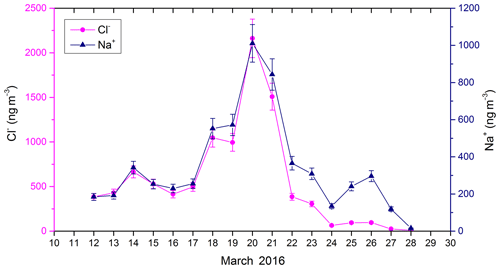
The time series of sea spray aerosol tracers (Na+ and Cl−) is shown in Fig. 10, and the results of the Pearson correlation analysis between these tracers are listed in Table 2. The correlation coefficients show that sea spray tracers are strongly correlated with each other (R=0.95), which is expected since these species are almost exclusively from sea spray.
A comparison between the mean mass concentrations of Na+ and Cl− measured in the current study and the values measured by Sirois and Barrie (1999) from 1980 to 1995 is shown in Fig. 7b and c. Figure 7b and c illustrate that the concentrations of Na+ and Cl− measured in the current study were consistent with many of previous measurements at Alert during March.
The correlation coefficients between INP concentrations at −15, −20, and −25 ∘C, and tracers of sea spray aerosol are listed in Table 3. The linear regression plots between INP concentrations at −25 ∘C and the sea spray tracers are shown in Fig. 11. At −15 and −20 ∘C, the correlations between INP concentrations and tracers of sea spray aerosol were not statistically significant (P>0.05). At −25 ∘C, the sea spray tracers were negatively correlated with INPs with moderate correlation coefficients () and statistical significance (P<0.05). Previous field studies and modelling studies have suggested sea spray aerosol as an important source of ambient INPs in marine environments when other sources of INPs, such as mineral dust, are low (Burrows et al., 2013; DeMott et al., 2016; Rosinski et al., 1986, 1988; Schnell, 1982; Vergara-Temprado et al., 2017; Wilson et al., 2015). Our results suggest that mineral dust is a more important source of INPs at −25 ∘C than sea spray aerosol for the time and location studied.
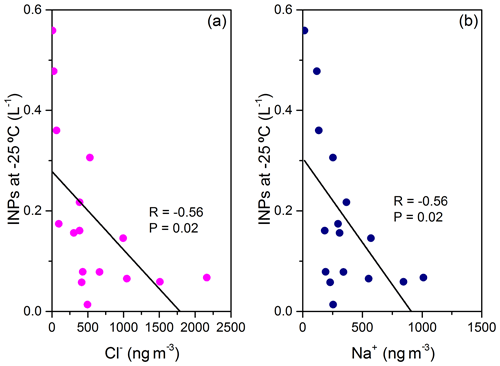
Figure 11Correlation plots between INP concentrations at −25 ∘C and sea spray tracers (Cl− and Na+). Included in each panel are the correlation coefficient (R) and the probability value (P).
Due to the method of particle collection and the method of forming liquid droplets in the freezing experiments, soluble material, such as salts including NaCl, was mixed with mineral dust particles within the same droplets during the freezing experiments. Salts decrease the freezing temperature of droplets by decreasing the water activity in the solution. However, the decrease in freezing temperature by this mechanism is not expected to be important in our experiments since the concentration of salts within a droplet is small. For example, the maximum concentration of NaCl in the water droplets formed during the droplet freezing experiments was estimated to be ∼0.03 M based on the mass concentrations of Na+ and Cl− sampled. This concentration of NaCl in the droplets would only cause a freezing point depression of ∼0.1 ∘C, which is within the uncertainty of the measured freezing temperatures and is too small to explain the negative correlation between INP concentrations and tracers of sea spray aerosol shown in Fig. 11.
On the other hand, other studies have illustrated that trace amounts of NaCl can lower the freezing temperature of mineral dust by surface-specific interactions between NaCl and the mineral dust surface, and the decrease in freezing temperature by this mechanism is more than expected based on the traditional freezing point depression mechanism (Reischel and Vali, 1975; Whale et al., 2018). For example, Reischel and Vali (1975) studied the effects of 0.01, 0.1, and 1 M solutions of NaCl on the nucleating ability of kaolin and found that the presence of NaCl led to lower freezing temperatures, by as much as 4 ∘C, for kaolin. A recent study by Whale et al. (2018) also found that a 0.015 M NaCl solution caused a decrease in freezing temperature of approximately 2 to 4 ∘C for BCS376 microcline, Eifel sanidine, quartz, and Arizona test dust, but had no effect on silica. To investigate the influence of NaCl on the ice-nucleating ability of mineral dust at −25 ∘C in the current study, INP concentrations at a freezing temperature of −25 ∘C ([INPs]) were divided by the mass concentration of aluminum ([Al]), and this ratio was then plotted as a function of Cl− and Na+ (Fig. 12). The variable [INPs][Al] is used as an estimation of the ice-nucleating ability of mineral dust, and it was negatively correlated with Cl− and Na+ with moderate correlation coefficients ( and −0.55, respectively) and statistical significance (P<0.05), which suggests that NaCl suppressed the ice-nucleating ability of mineral dust in the current study. This result is consistent with the two previous laboratory studies mentioned above and is the first field study that we are aware of that suggests that NaCl can suppress the ice-nucleating ability of mineral dust particles in the immersion freezing mode even in dilute solution droplets.
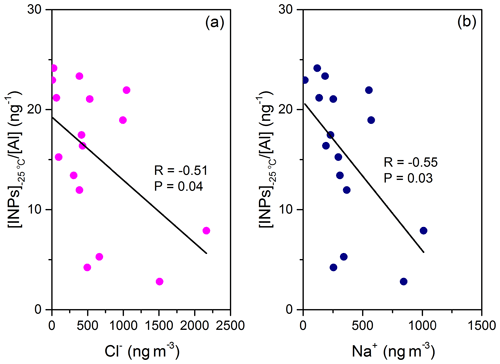
Figure 12Correlation plots between the ratio of INP number concentration at −25 ∘C to aluminum mass concentration and sea spray tracers (Cl− and Na+). Included in each panel are the correlation coefficient (R) and the probability value (P).
Another possible explanation for the negative correlation between INP concentrations at −25 ∘C and sea spray tracers is that the air masses containing sea spray aerosol have relatively few mineral dust particles. In this case, the sea spray aerosol does not influence the ice-nucleating ability of mineral dust but rather appears as a negative correlation by coincidence. However, Table 2 shows that the correlations between tracers of mineral dust and tracers of sea spray aerosol are not statistically significant, suggesting that this possible explanation is not the major reason for the negative correlation between INP concentrations at −25 ∘C and sea spray tracers.
3.5 Tracers of anthropogenic aerosol: concentrations and correlations with INPs
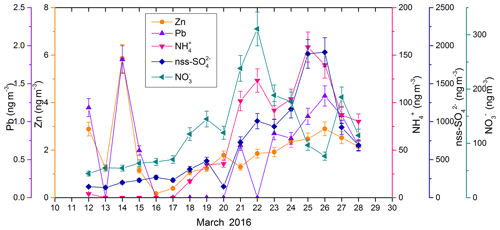
The time series of anthropogenic aerosol tracers (Zn, Pb, , , and nss-) is plotted in Fig. 13. The results of the Pearson correlation analysis between these different tracers are listed in Table 2. Not all the anthropogenic aerosol tracers are correlated with each other. This is not surprising since these tracers come from different sources. However, there is a correlation between Zn and Pb, and between nss- and . Zn and Pb are strongly correlated with each other (R=0.84, P<0.01), and nss- and are strongly correlated with each other (R=0.93, P<0.01).
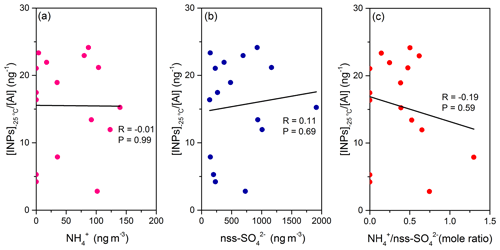
Figure 14Correlation plots between the ratio of INP number concentration at −25 ∘C to aluminum mass concentration and anthropogenic pollution tracers ( and nss-) and ∕ nss- mole ratio. Included in each panel are the correlation coefficient (R) and the probability value (P).
The comparison between the mean mass concentrations of Zn, Pb, , , and measured in the current study and the values measured by Sirois and Barrie (1999) from 1980 to 1995 is shown in Fig. 7d–h. The concentrations of Zn, Pb, , and were lower than previous concentrations measured in March at Alert, which might be due to the reduced emissions from Eurasia after the dissolution of the former USSR in 1991 (Christensen, 1997). The concentration of was higher than previous concentrations measured in March. An increasing trend of annual concentrations of has been observed by others in the Arctic (Hole et al., 2006; Neftel et al., 1985).
The correlation coefficients between INP concentrations at −15, −20, and −25 ∘C, and tracers of anthropogenic aerosol are listed in Table 3. None of the correlations were statistically significant, consistent with a recent study that showed no effect of atmospheric pollution on INP concentrations in Beijing at freezing temperatures down to −25 ∘C (Chen et al., 2018). In contrast, Borys (1989) found that pollution-derived Arctic haze aerosol had lower INP concentrations than unpolluted troposphere aerosol.
There have been a few studies that investigated the effect of sulfate coating on the ice-nucleating properties of mineral dust particles. Most laboratory studies have shown decreased freezing abilities for sulfate-coated mineral dust particles compared to uncoated particles (Chernoff and Bertram, 2010; Eastwood et al., 2008; Gallavardin et al., 2008; Sullivan et al., 2010). However, other studies have shown an increase in the freezing temperature of droplets containing mineral dust particles in the presence of ammonium sulfate (Reischel and Vali, 1975; Whale et al., 2018). To investigate the effect of ammonium, sulfate, and the ammonium-to-sulfate ratio on the ice-nucleating ability of mineral dust at −25 ∘C, the parameter [INPs][Al] was plotted as a function of , nss-, and the ∕ nss- ratio as shown in Fig. 14. The ∕ nss- ratio was between 0 and 1. The correlations between the ice-nucleating ability of mineral dust at −25 ∘C and , nss-, and the ∕ nss- ratio were not statistically significant.
The INP concentrations measured at Alert during March 2016 fell into the range of previously reported INP concentrations measured in the Arctic at ground level or sea level. At −25 ∘C, the INP concentrations were strongly correlated with tracers of mineral dust (Al, Fe, Ti, and Mn), anti-correlated with tracers of sea spray (Cl−, Na+), and not correlated with tracers of anthropogenic aerosol (Zn, Pb, , , and nss-) or meteorological variables. This suggests that mineral dust was a major contributor to INP populations at −25 ∘C at this site during the sampling period. The ice-nucleating ability of mineral dust, represented as the ratio of INP number concentration to the mass concentration of aluminum, was also anti-correlated with the tracers of sea spray at −25 ∘C, which suggests that NaCl suppressed the ice-nucleating ability of mineral dust particles in the immersion freezing mode. This is the first field study that we are aware of that showed the suppression effect of NaCl on the ice-nucleating ability of mineral dust. Due to the way particles were collected and droplets were formed in our experiments, soluble material, such as NaCl, was internally mixed with mineral dust within the same droplets. However, in the atmosphere, the soluble material, such as NaCl, may not be internally mixed with mineral dust. Studies of the mixing state of soluble material with mineral dust at Alert during the same time of the year are needed.
The particle dispersion model analysis suggests that a likely source of mineral dust that caused freezing at −25 ∘C was long-range transport of dust from the Gobi Desert. Additional measurements of the composition of individual INP or ice crystal residuals in the Arctic are needed to confirm the conclusions reached in the current study.
Data used in this study are available on the Government of Canada Open Government Portal under NETCARE (https://open.canada.ca/, last access: 13 February 2019; Si et al., 2019) and can also be obtained from the corresponding author upon request.
The supplement related to this article is available online at: https://doi.org/10.5194/acp-19-3007-2019-supplement.
MS and AKB designed the experiments. EE collected the samples with help from KR, DV and AP. MS, JY, and YX carried out the droplet freezing experiments. SH made the PES plots. AC carried out the ion chromatography analysis. DK and PH provided FLEXPART results. SS and WRL gave constructive advice. MS wrote the paper, with contributions from all co-authors.
The authors declare that they have no conflict of interest.
This article is part of the special issue “NETCARE (Network on Aerosols and Climate: Addressing Key Uncertainties in Remote Canadian Environments) (ACP/AMT/BG inter-journal SI)”. It is not associated with a conference.
The authors would like to thank Desiree Toom for assistance with ion
chromatography analysis. We want to acknowledge that the FLEXPART was downloaded
from https://www.flexpart.eu/ (last access: 20 March 2018) and the ECMWF data were retrieved from the
MARS server. We also would like to thank all the staff at the Alert site for
their assistance during the field study.
Edited by: Barbara Ervens
Reviewed by: two anonymous referees
Andreae, M. O. and Rosenfeld, D.: Aerosol–cloud–precipitation interactions. Part 1. The nature and sources of cloud-active aerosols, Earth-Sci. Rev., 89, 13–41, https://doi.org/10.1016/j.earscirev.2008.03.001, 2008.
Balasubramanian, R., Qian, W.-B., Decesari, S., Facchini, M. C., and Fuzzi, S.: Comprehensive characterization of PM2.5 aerosols in Singapore, J. Geophys. Res., 108, 4523, https://doi.org/10.1029/2002JD002517, 2003.
Barrie, L. A.: Arctic air pollution: An overview of current knowledge, Atmos. Environ., 20, 643–663, https://doi.org/10.1016/0004-6981(86)90180-0, 1986.
Barrie, L. A. and Barrie, M. J.: Chemical components of lower tropospheric aerosols in the high arctic: Six years of observations, J. Atmos. Chem., 11, 211–226, https://doi.org/10.1007/BF00118349, 1990.
Barrie, L. A., Hoff, R. M., and Daggupaty, S. M.: The influence of mid-latitudinal pollution sources on haze in the Canadian arctic, Atmos. Environ., 15, 1407–1419, https://doi.org/10.1016/0004-6981(81)90347-4, 1981.
Barrie, L. A., den Hartog, G., Bottenheim, J. W., and Landsberger, S.: Anthropogenic aerosols and gases in the lower troposphere at Alert Canada in April 1986, J. Atmos. Chem., 9, 101–127, https://doi.org/10.1007/BF00052827, 1989.
Barrie, L. A., Gregor, D., Hargrave, B., Lake, R., Muir, D., Shearer, R., Tracey, B., and Bidleman, T.: Arctic contaminants: sources, occurrence and pathways, Sci. Total Environ., 122, 1–74, https://doi.org/10.1016/0048-9697(92)90245-N, 1992.
Bateman, A. P., Belassein, H., and Martin, S. T.: Impactor Apparatus for the Study of Particle Rebound: Relative Humidity and Capillary Forces, Aerosol Sci. Tech., 48, 42–52, https://doi.org/10.1080/02786826.2013.853866, 2014.
Bigg, E. K.: Ice forming nuclei in the high Arctic, Tellus B, 48, 223–233, https://doi.org/10.1034/j.1600-0889.1996.t01-1-00007.x, 1996.
Bigg, E. K. and Leck, C.: Cloud-active particles over the central Arctic Ocean, J. Geophys. Res.-Atmos., 106, 32155–32166, https://doi.org/10.1029/1999JD901152, 2001.
Boose, Y., Kanji, Z. A., Kohn, M., Sierau, B., Zipori, A., Crawford, I., Lloyd, G., Bukowiecki, N., Herrmann, E., Kupiszewski, P., Steinbacher, M., and Lohmann, U.: Ice Nucleating Particle Measurements at 241 K during Winter Months at 3580 m MSL in the Swiss Alps, J. Atmos. Sci., 73, 2203–2228, https://doi.org/10.1175/JAS-D-15-0236.1, 2016.
Borys, R. D.: Studies of ice nucleation by Arctic aerosol on AGASP-II, J. Atmos. Chem., 9, 169–185, https://doi.org/10.1007/BF00052831, 1989.
Burrows, S. M., Hoose, C., Pöschl, U., and Lawrence, M. G.: Ice nuclei in marine air: biogenic particles or dust?, Atmos. Chem. Phys., 13, 245–267, https://doi.org/10.5194/acp-13-245-2013, 2013.
Chen, J., Wu, Z., Augustin-Bauditz, S., Grawe, S., Hartmann, M., Pei, X., Liu, Z., Ji, D., and Wex, H.: Ice-nucleating particle concentrations unaffected by urban air pollution in Beijing, China, Atmos. Chem. Phys., 18, 3523–3539, https://doi.org/10.5194/acp-18-3523-2018, 2018.
Chen, S., Tsai, C., Chen, H., Huang, C., and Roam, G.: The Influence of Relative Humidity on Nanoparticle Concentration and Particle Mass Distribution Measurements by the MOUDI, Aerosol Sci. Tech., 45, 596–603, https://doi.org/10.1080/02786826.2010.551557, 2011.
Chernoff, D. I. and Bertram, A. K.: Effects of sulfate coatings on the ice nucleation properties of a biological ice nucleus and several types of minerals, J. Geophys. Res., 115, D20205, https://doi.org/10.1029/2010JD014254, 2010.
Christensen, J. H.: The Danish eulerian hemispheric model – a three-dimensional air pollution model used for the arctic, Atmos. Environ., 31, 4169–4191, https://doi.org/10.1016/S1352-2310(97)00264-1, 1997.
Coluzza, I., Creamean, J., Rossi, M., Wex, H., Alpert, P., Bianco, V., Boose, Y., Dellago, C., Felgitsch, L., Fröhlich-Nowoisky, J., Herrmann, H., Jungblut, S., Kanji, Z., Menzl, G., Moffett, B., Moritz, C., Mutzel, A., Pöschl, U., Schauperl, M., Scheel, J., Stopelli, E., Stratmann, F., Grothe, H., and Schmale, D.: Perspectives on the Future of Ice Nucleation Research: Research Needs and Unanswered Questions Identified from Two International Workshops, Atmosphere (Basel), 8, 138, https://doi.org/10.3390/atmos8080138, 2017.
Conen, F., Stopelli, E., and Zimmermann, L.: Clues that decaying leaves enrich Arctic air with ice nucleating particles, Atmos. Environ., 129, 91–94, https://doi.org/10.1016/j.atmosenv.2016.01.027, 2016.
Creamean, J. M., Kirpes, R. M., Pratt, K. A., Spada, N. J., Maahn, M., de Boer, G., Schnell, R. C., and China, S.: Marine and terrestrial influences on ice nucleating particles during continuous springtime measurements in an Arctic oilfield location, Atmos. Chem. Phys., 18, 18023–18042, https://doi.org/10.5194/acp-18-18023-2018, 2018.
Curry, J. A.: Interactions among aerosols, clouds, and climate of the Arctic Ocean, Sci. Total Environ., 160–161, 777–791, https://doi.org/10.1016/0048-9697(95)04411-S, 1995.
Cziczo, D. J., Froyd, K. D., Hoose, C., Jensen, E. J., Diao, M., Zondlo, M. A., Smith, J. B., Twohy, C. H., and Murphy, D. M.: Clarifying the Dominant Sources and Mechanisms of Cirrus Cloud Formation, Science, 1320, 1–8, https://doi.org/10.1126/science.1234145, 2013.
Cziczo, D. J., Ladino, L., Boose, Y., Kanji, Z. A., Kupiszewski, P., Lance, S., Mertes, S., and Wex, H.: Measurements of Ice Nucleating Particles and Ice Residuals, Meteorol. Monogr., 58, 8.1–8.13, https://doi.org/10.1175/AMSMONOGRAPHS-D-16-0008.1, 2017.
DeMott, P. J., Sassen, K., Poellot, M. R., Baumgardner, D., Rogers, D. C., Brooks, S. D., Prenni, A. J., and Kreidenweis, S. M.: African dust aerosols as atmospheric ice nuclei, Geophys. Res. Lett., 30, 26–29, https://doi.org/10.1029/2003GL017410, 2003.
DeMott, P. J., Prenni, A. J., Liu, X., Kreidenweis, S. M., Petters, M. D., Twohy, C. H., Richardson, M. S., Eidhammer, T., and Rogers, D. C.: Predicting global atmospheric ice nuclei distributions and their impacts on climate, P. Natl. Acad. Sci. USA, 107, 11217–11222, https://doi.org/10.1073/pnas.0910818107, 2010.
DeMott, P. J., Hill, T. C. J., McCluskey, C. S., Prather, K. A., Collins, D. B., Sullivan, R. C., Ruppel, M. J., Mason, R. H., Irish, V. E., Lee, T., Hwang, C. Y., Rhee, T. S., Snider, J. R., McMeeking, G. R., Dhaniyala, S., Lewis, E. R., Wentzell, J. J. B., Abbatt, J., Lee, C., Sultana, C. M., Ault, A. P., Axson, J. L., Diaz Martinez, M., Venero, I., Santos-Figueroa, G., Stokes, M. D., Deane, G. B., Mayol-Bracero, O. L., Grassian, V. H., Bertram, T. H., Bertram, A. K., Moffett, B. F., and Franc, G. D.: Sea spray aerosol as a unique source of ice nucleating particles, P. Natl. Acad. Sci. USA, 113, 5797–5803, https://doi.org/10.1073/pnas.1514034112, 2016.
DeMott, P. J., Hill, T. C. J., Petters, M. D., Bertram, A. K., Tobo, Y., Mason, R. H., Suski, K. J., McCluskey, C. S., Levin, E. J. T., Schill, G. P., Boose, Y., Rauker, A. M., Miller, A. J., Zaragoza, J., Rocci, K., Rothfuss, N. E., Taylor, H. P., Hader, J. D., Chou, C., Huffman, J. A., Pöschl, U., Prenni, A. J., and Kreidenweis, S. M.: Comparative measurements of ambient atmospheric concentrations of ice nucleating particles using multiple immersion freezing methods and a continuous flow diffusion chamber, Atmos. Chem. Phys., 17, 11227–11245, https://doi.org/10.5194/acp-17-11227-2017, 2017.
Drab, E., Gaudichet, A., Jaffrezo, J. L., and Colin, J. L.: Mineral particles content in recent snow at Summit (Greenland), Atmos. Environ., 36, 5365–5376, https://doi.org/10.1016/S1352-2310(02)00470-3, 2002.
Du, P., Girard, E., Bertram, A. K., and Shupe, M. D.: Modeling of the cloud and radiation processes observed during SHEBA, Atmos. Res., 101, 911–927, https://doi.org/10.1016/j.atmosres.2011.05.018, 2011.
Eastwood, M. L., Cremel, S., Gehrke, C., Girard, E., and Bertram, A. K.: Ice nucleation on mineral dust particles: Onset conditions, nucleation rates and contact angles, J. Geophys. Res., 113, D22203, https://doi.org/10.1029/2008JD010639, 2008.
Fang, C. P., McMurry, P. H., Marple, V. A., and Rubow, K. L.: Effect of Flow-induced Relative Humidity Changes on Size Cuts for Sulfuric Acid Droplets in the Microorifice Uniform Deposit Impactor (MOUDI), Aerosol Sci. Tech., 14, 266–277, https://doi.org/10.1080/02786829108959489, 1991.
Flyger, H. and Heidam, N. Z.: Ground level measurements of the summer tropospheric aerosol in Northern Greenland, J. Aerosol Sci., 9, 157–168, https://doi.org/10.1016/0021-8502(78)90075-7, 1978.
Flyger, H., Hansen, K., Megaw, W. J., and Cox, L. C.: The Background Level of the Summer Tropospheric Aerosol Over Greenland and the North Atlantic Ocean, J. Appl. Meteorol., 12, 161–174, https://doi.org/10.1175/1520-0450(1973)012<0161:TBLOTS>2.0.CO;2, 1973.
Flyger, H., Heidam, N., Hansen, K., Megaw, W., Walther, E., and Hogan, A.: The background level of the summer tropospheric aerosol, sulphur dioxide and ozone over Greenland and the North Atlantic Ocean, J. Aerosol Sci., 7, 103–140, https://doi.org/10.1016/0021-8502(76)90069-0, 1976.
Follett, R. F. and Hatfield, J. L.: Nitrogen in the Environment: Sources, Problems, and Management, Elsevier, Amsterdam, the Netherlands, 2001.
Formenti, P., Elbert, W., Maenhaut, W., Haywood, J., and Andreae, M. O.: Chemical composition of mineral dust aerosol during the Saharan Dust Experiment (SHADE) airborne campaign in the Cape Verde region, September 2000, J. Geophys. Res., 108, 8576, https://doi.org/10.1029/2002JD002648, 2003.
Fountain, A. G. and Ohtake, T.: Concentrations and Source Areas of Ice Nuclei in the Alaskan Atmosphere, J. Clim. Appl. Meteorol., 2, 377–382, https://doi.org/10.1175/1520-0450(1985)024<0377:CASAOI>2.0.CO;2, 1985.
Franzén, L. G., Hjelmroos, M., Kållberg, P., Brorström-Lunden, E., Juntto, S., and Savolainen, A. L.: The “yellow snowepisode” of northern Fennoscandia, march 1991-A case study of long-distance transport of soil, pollen and stable organic compounds, Atmos. Environ., 28, 3587–3604, https://doi.org/10.1016/1352-2310(94)00191-M, 1994.
Gallavardin, S. J., Froyd, K. D., Lohmann, U., Moehler, O., Murphy, D. M., and Cziczo, D. J.: Single Particle Laser Mass Spectrometry Applied to Differential Ice Nucleation Experiments at the AIDA Chamber, Aerosol Sci. Tech., 42, 773–791, https://doi.org/10.1080/02786820802339538, 2008.
Hirdman, D., Sodemann, H., Eckhardt, S., Burkhart, J. F., Jefferson, A., Mefford, T., Quinn, P. K., Sharma, S., Ström, J., and Stohl, A.: Source identification of short-lived air pollutants in the Arctic using statistical analysis of measurement data and particle dispersion model output, Atmos. Chem. Phys., 10, 669–693, https://doi.org/10.5194/acp-10-669-2010, 2010.
Hole, L. R., Christensen, J., Ginzburg, V. A., Makarov, V., Pershina, N. A., Polischuk, A. I., Ruoho-Airola, T., Svistov, P. P., and Vasilenko, V. N.: AMAP Assessment 2006: Acidifying Pollutants, Arctic Haze, and Acidification in the Arctic, Arctic Monitoring and Assessment Programme (AMAP), Oslo, Norway, 11–30, 2006.
Holland, H. D.: The Chemistry of the Atmosphere and Oceans, John Wiley, Hoboken, NJ, 1978.
Hoose, C. and Möhler, O.: Heterogeneous ice nucleation on atmospheric aerosols: a review of results from laboratory experiments, Atmos. Chem. Phys., 12, 9817–9854, https://doi.org/10.5194/acp-12-9817-2012, 2012.
Iannone, R., Chernoff, D. I., Pringle, A., Martin, S. T., and Bertram, A. K.: The ice nucleation ability of one of the most abundant types of fungal spores found in the atmosphere, Atmos. Chem. Phys., 11, 1191–1201, https://doi.org/10.5194/acp-11-1191-2011, 2011.
Irish, V. E., Hanna, S. J., Willis, M. D., China, S., Thomas, J. L., Wentzell, J. J. B., Cirisan, A., Si, M., Leaitch, W. R., Murphy, J. G., Abbatt, J. P. D., Laskin, A., Girard, E., and Bertram, A. K.: Ice nucleating particles in the marine boundary layer in the Canadian Arctic during summer 2014, Atmos. Chem. Phys., 19, 1027–1039, https://doi.org/10.5194/acp-19-1027-2019, 2019.
Kanji, Z. A., Ladino, L. A., Wex, H., Boose, Y., Burkert-Kohn, M., Cziczo, D. J., and Krämer, M.: Overview of Ice Nucleating Particles, Meteorol. Monogr., 58, 1.1–1.33, https://doi.org/10.1175/AMSMONOGRAPHS-D-16-0006.1, 2017.
Klein, H., Nickovic, S., Haunold, W., Bundke, U., Nillius, B., Ebert, M., Weinbruch, S., Schuetz, L., Levin, Z., Barrie, L. A., and Bingemer, H.: Saharan dust and ice nuclei over Central Europe, Atmos. Chem. Phys., 10, 10211–10221, https://doi.org/10.5194/acp-10-10211-2010, 2010.
Koop, T., Luo, B., Biermann, U. M., Crutzen, P. J., and Peter, T.: Freezing of HNO3∕H2 SO4∕H2O Solutions at Stratospheric Temperatures: Nucleation Statistics and Experiments, J. Phys. Chem. A, 101, 1117–1133, https://doi.org/10.1021/jp9626531, 1997.
Kumai, M. and Francis, K. E.: Nuclei in Snow and Ice Crystals on the Greenland Ice Cap under Natural and Artificially Stimulated Conditions, J. Atmos. Sci., 19, 474–481, https://doi.org/10.1175/1520-0469(1962)019<0474:NISAIC>2.0.CO;2, 1962.
Lohmann, U. and Feichter, J.: Global indirect aerosol effects: a review, Atmos. Chem. Phys., 5, 715–737, https://doi.org/10.5194/acp-5-715-2005, 2005.
Macdonald, K. M., Sharma, S., Toom, D., Chivulescu, A., Hanna, S., Bertram, A. K., Platt, A., Elsasser, M., Huang, L., Tarasick, D., Chellman, N., McConnell, J. R., Bozem, H., Kunkel, D., Lei, Y. D., Evans, G. J., and Abbatt, J. P. D.: Observations of atmospheric chemical deposition to high Arctic snow, Atmos. Chem. Phys., 17, 5775–5788, https://doi.org/10.5194/acp-17-5775-2017, 2017.
Macdonald, R. W., Barrie, L. A., Bidleman, T. F., Diamond, M. L., Gregor, D. J., Semkin, R. G., Strachan, W. M. J., Li, Y. F., Wania, F., Alaee, M., Alexeeva, L. B., Backus, S. M., Bailey, R., Bewers, J. M., Gobeil, C., Halsall, C. J., Harner, T., Hoff, J. T., Jantunen, L. M. M., Lockhart, W. L., Mackay, D., Muir, D. C. G., Pudykiewicz, J., Reimer, K. J., Smith, J. N., Stern, G., Schroeder, W. H., Wagemann, R., and Yunker, M. B.: Contaminants in the Canadian Arctic: 5 years of progress in understanding sources, occurrence and pathways, Sci. Total Environ., 254, 93–234, https://doi.org/10.1016/S0048-9697(00)00434-4, 2000.
Malm, W. C., Sisler, J. F., Huffman, D., Eldred, R. A., and Cahill, T. A.: Spatial and seasonal trends in particle concentration and optical extinction in the United States, J. Geophys. Res., 99, 1347, https://doi.org/10.1029/93JD02916, 1994.
Mason, R. H., Chou, C., McCluskey, C. S., Levin, E. J. T., Schiller, C. L., Hill, T. C. J., Huffman, J. A., DeMott, P. J., and Bertram, A. K.: The micro-orifice uniform deposit impactor–droplet freezing technique (MOUDI-DFT) for measuring concentrations of ice nucleating particles as a function of size: improvements and initial validation, Atmos. Meas. Tech., 8, 2449–2462, https://doi.org/10.5194/amt-8-2449-2015, 2015.
Mason, R. H., Si, M., Chou, C., Irish, V. E., Dickie, R., Elizondo, P., Wong, R., Brintnell, M., Elsasser, M., Lassar, W. M., Pierce, K. M., Leaitch, W. R., MacDonald, A. M., Platt, A., Toom-Sauntry, D., Sarda-Estève, R., Schiller, C. L., Suski, K. J., Hill, T. C. J., Abbatt, J. P. D., Huffman, J. A., DeMott, P. J., and Bertram, A. K.: Size-resolved measurements of ice-nucleating particles at six locations in North America and one in Europe, Atmos. Chem. Phys., 16, 1637–1651, https://doi.org/10.5194/acp-16-1637-2016, 2016.
McFarquhar, G. M., Ghan, S., Verlinde, J., Korolev, A., Strapp, J. W., Schmid, B., Tomlinson, J. M., Wolde, M., Brooks, S. D., Cziczo, D., Dubey, M. K., Fan, J., Flynn, C., Gultepe, I., Hubbe, J., Gilles, M. K., Laskin, A., Lawson, P., Leaitch, W. R., Liu, P., Liu, X., Lubin, D., Mazzoleni, C., Macdonald, A.-M., Moffet, R. C., Morrison, H., Ovchinnikov, M., Shupe, M. D., Turner, D. D., Xie, S., Zelenyuk, A., Bae, K., Freer, M., and Glen, A.: Indirect and Semi-direct Aerosol Campaign, B. Am. Meteorol. Soc., 92, 183–201, https://doi.org/10.1175/2010BAMS2935.1, 2011.
Millero, F. J.: The Physical Chemistry of Seawater, Annu. Rev. Earth Planet. Sci., 2, 101–150, https://doi.org/10.1146/annurev.ea.02.050174.000533, 1974.
Murray, B. J., O'Sullivan, D., Atkinson, J. D., and Webb, M. E.: Ice nucleation by particles immersed in supercooled cloud droplets, Chem. Soc. Rev., 41, 6519, https://doi.org/10.1039/c2cs35200a, 2012.
Neftel, A., Beer, J., Oeschger, H., Zürcher, F., and Finkel, R. C.: Sulphate and nitrate concentrations in snow from South Greenland 1895–1978, Nature, 314, 611–613, https://doi.org/10.1038/314611a0, 1985.
Norman, A. L., Barrie, L. A., Toom-Sauntry, D., Sirois, A., Krouse, H. R., Li, S. M., and Sharma, S.: Sources of aerosol sulphate at Alert: Apportionment using stable isotopes, J. Geophys. Res.-Atmos., 104, 11619–11631, https://doi.org/10.1029/1999JD900078, 1999.
Nriagu, J. O. and Pacyna, J. M.: Quantitative assessment of worldwide contamination of air, water and soils by trace metals, Nature, 333, 134–139, https://doi.org/10.1038/333134a0, 1988.
Pacyna, J. M.: The origin of Arctic air pollutants: lessons learned and future research, Sci. Total Environ., 160–161, 39–53, https://doi.org/10.1016/0048-9697(95)04343-Y, 1995.
Pacyna, J. M. and Ottar, B.: Origin of natural constituents in the Arctic aerosol, Atmos. Environ., 23, 809–815, https://doi.org/10.1016/0004-6981(89)90485-X, 1989.
Pratt, K. A., DeMott, P. J., French, J. R., Wang, Z., Westphal, D. L., Heymsfield, A. J., Twohy, C. H., Prenni, A. J., and Prather, K. A.: In situ detection of biological particles in cloud ice-crystals, Nat. Geosci., 2, 398–401, https://doi.org/10.1038/ngeo521, 2009.
Prenni, A. J., Harrington, J. Y., Tjernström, M., DeMott, P. J., Avramov, A., Long, C. N., Kreidenweis, S. M., Olsson, P. Q., and Verlinde, J.: Can Ice-Nucleating Aerosols Affect Arctic Seasonal Climate?, B. Am. Meteorol. Soc., 88, 541–550, https://doi.org/10.1175/BAMS-88-4-541, 2007.
Prenni, A. J., DeMott, P. J., Rogers, D. C., Kreidenweis, S. M., Mcfarquhar, G. M., Zhang, G., and Poellot, M. R.: Ice nuclei characteristics from M-PACE and their relation to ice formation in clouds, Tellus B, 61, 436–448, https://doi.org/10.1111/j.1600-0889.2009.00415.x, 2009.
Quinn, P. K., Miller, T. L., Bates, T. S., Ogren, J. A., Andrews, E., and Shaw, G. E.: A 3-year record of simultaneously measured aerosol chemical and optical properties at Barrow, Alaska, J. Geophys. Res.-Atmos., 107, AAC 8-1–AAC 8-15, https://doi.org/10.1029/2001JD001248, 2002.
Quinn, P. K., Coffman, D. J., Bates, T. S., Welton, E. J., Covert, D. S., Miller, T. L., Johnson, J. E., Maria, S., Russell, L., Arimoto, R., Carrico, C. M., Rood, M. J., and Anderson, J.: Aerosol optical properties measured on board the Ronald H. Brown during ACE-Asia as a function of aerosol chemical composition and source region, J. Geophys. Res., 109, D19S01, https://doi.org/10.1029/2003JD004010, 2004.
Quinn, P. K., Shaw, G., Andrews, E., Dutton, E. G., Ruoho-Airola, T., and Gong, S. L.: Arctic haze: Current trends and knowledge gaps, Tellus B, 59, 99–114, https://doi.org/10.1111/j.1600-0889.2006.00238.x, 2007.
Radke, L. F., Hobbs, P. V., and Pinnons, J. E.: Observations of Cloud Condensation Nuclei, Sodium-Containing Particles, Ice Nuclei and the Light-Scattering Coefficient Near Barrow, Alaska, J. Appl. Meteorol., 15, 982–995, https://doi.org/10.1175/1520-0450(1976)015<0982:OOCCNS>2.0.CO;2, 1976.
Reischel, M. T. and Vali, G.: Freezing nucleation in aqueous electrolytes, Tellus, 27, 414–427, https://doi.org/10.3402/tellusa.v27i4.9989, 1975.
Rogers, D. C., DeMott, P. J., and Kreidenweis, S. M.: Airborne measurements of tropospheric ice-nucleating aerosol particles in the Arctic spring, J. Geophys. Res.-Atmos., 106, 15053–15063, https://doi.org/10.1029/2000JD900790, 2001.
Rosinski, J., Haagenson, P. L., Nagamoto, C. T., and Parungo, F.: Ice-forming nuclei of maritime origin, J. Aerosol Sci., 17, 23–46, https://doi.org/10.1016/0021-8502(86)90004-2, 1986.
Rosinski, J., Haagenson, P. L., Nagamoto, C. T., Quintana, B., Parungo, F., and Hoyt, S. D.: Ice-forming nuclei in air masses over the Gulf of Mexico, J. Aerosol Sci., 19, 539–551, https://doi.org/10.1016/0021-8502(88)90206-6, 1988.
Schnell, R. C.: Airborne ice nucleus measurements around the Hawaiian Islands, J. Geophys. Res., 87, 8886–8890, https://doi.org/10.1029/JC087iC11p08886, 1982.
Schwikowski, M., Döscher, A., Gäggeler, H. W., and Schotterer, U.: Anthropogenic versus natural sources of atmospheric sulphate from an Alpine ice core, Tellus B, 51, 938–951, https://doi.org/10.3402/tellusb.v51i5.16506, 1999.
Seibert, P. and Frank, A.: Source-receptor matrix calculation with a Lagrangian particle dispersion model in backward mode, Atmos. Chem. Phys., 4, 51–63, https://doi.org/10.5194/acp-4-51-2004, 2004.
Seinfeld, J. H. and Pandis, S. N.: Atmospheric Chemistry and Physics: From Air Pollution to Climate Change, John Wiley & Sons, Inc., Hoboken, NJ, 2006.
Shaw, G. E.: The Arctic Haze Phenomenon, B. Am. Meteorol. Soc., 76, 2403–2413, https://doi.org/10.1175/1520-0477(1995)076<2403:TAHP>2.0.CO;2, 1995.
Si, M., Evoy, E., Yun, J., Xi, Y., Hanna, S., Chivulescu, A., Rawlings, K., Veber, D., Platt, A., Kunkel, D., Hoor, P., Sharma, S., Leaitch, W. R., and Bertram, A. K.: Concentrations, composition, and sources of ice-nucleating particles in the Canadian High Arctic during spring 2016 [Data set], Government of Canada Open Government Portal, available at: https://open.canada.ca, last access: 13 February 2019.
Sirois, A. and Barrie, L. A.: Arctic lower tropospheric aerosol trends and composition at Alert, Canada: 1980–1995, J. Geophys. Res.-Atmos., 104, 11599–11618, https://doi.org/10.1029/1999JD900077, 1999.
Stohl, A., Forster, C., Frank, A., Seibert, P., and Wotawa, G.: Technical note: The Lagrangian particle dispersion model FLEXPART version 6.2, Atmos. Chem. Phys., 5, 2461–2474, https://doi.org/10.5194/acp-5-2461-2005, 2005.
Sullivan, R. C., Petters, M. D., DeMott, P. J., Kreidenweis, S. M., Wex, H., Niedermeier, D., Hartmann, S., Clauss, T., Stratmann, F., Reitz, P., Schneider, J., and Sierau, B.: Irreversible loss of ice nucleation active sites in mineral dust particles caused by sulphuric acid condensation, Atmos. Chem. Phys., 10, 11471–11487, https://doi.org/10.5194/acp-10-11471-2010, 2010.
Toom-Sauntry, D. and Barrie, L. A.: Chemical composition of snowfall in the high Arctic: 1990–1994, Atmos. Environ., 36, 2683–2693, https://doi.org/10.1016/S1352-2310(02)00115-2, 2002.
Usher, C. R., Michel, A. E., and Grassian, V. H.: Reactions on Mineral Dust, Chem. Rev., 103, 4883–4940, https://doi.org/10.1021/cr020657y, 2003.
Vali, G.: Quantitative Evaluation of Experimental Results an the Heterogeneous Freezing Nucleation of Supercooled Liquids, J. Atmos. Sci., 28, 402–409, https://doi.org/10.1175/1520-0469(1971)028<0402:QEOERA>2.0.CO;2, 1971.
Vali, G., DeMott, P. J., Möhler, O., and Whale, T. F.: Technical Note: A proposal for ice nucleation terminology, Atmos. Chem. Phys., 15, 10263–10270, https://doi.org/10.5194/acp-15-10263-2015, 2015.
Vergara-Temprado, J., Murray, B. J., Wilson, T. W., O'Sullivan, D., Browse, J., Pringle, K. J., Ardon-Dryer, K., Bertram, A. K., Burrows, S. M., Ceburnis, D., DeMott, P. J., Mason, R. H., O'Dowd, C. D., Rinaldi, M., and Carslaw, K. S.: Contribution of feldspar and marine organic aerosols to global ice nucleating particle concentrations, Atmos. Chem. Phys., 17, 3637–3658, https://doi.org/10.5194/acp-17-3637-2017, 2017.
Ward, P. L.: Sulfur dioxide initiates global climate change in four ways, Thin Solid Films, 517, 3188–3203, https://doi.org/10.1016/j.tsf.2009.01.005, 2009.
Watts, S. F., Yaaqub, R., and Davies, T.: The use of Whatman 41 filter papers for high volume aerosol sampling, Atmos. Environ., 21, 2731–2732, https://doi.org/10.1016/0004-6981(87)90207-1, 1987.
Wedepohl, K. H.: The composition of the continental crust, Geochim. Cosmochim. Ac., 59, 1217–1232, https://doi.org/10.1016/0016-7037(95)00038-2, 1995.
Welch, H. E., Muir, D. C. G., Billeck, B. N., Lockhart, W. L., Brunskill, G. J., Kling, H. J., Olson, M. P., and Lemoine, R. M.: Brown snow: a long-range transport event in the Canadian Arctic, Environ. Sci. Technol., 25, 280–286, https://doi.org/10.1021/es00014a010, 1991.
Whale, T. F., Holden, M. A., Wilson, T. W., O'Sullivan, D., and Murray, B. J.: The enhancement and suppression of immersion mode heterogeneous ice-nucleation by solutes, Chem. Sci., 9, 4142–4151, https://doi.org/10.1039/C7SC05421A, 2018.
Wheeler, M. J., Mason, R. H., Steunenberg, K., Wagstaff, M., Chou, C., and Bertram, A. K.: Immersion Freezing of Supermicron Mineral Dust Particles: Freezing Results, Testing Different Schemes for Describing Ice Nucleation, and Ice Nucleation Active Site Densities, J. Phys. Chem. A, 119, 4358–4372, https://doi.org/10.1021/jp507875q, 2015.
Wilson, T. W., Ladino, L. A., Alpert, P. A., Breckels, M. N., Brooks, I. M., Browse, J., Burrows, S. M., Carslaw, K. S., Huffman, J. A., Judd, C., Kilthau, W. P., Mason, R. H., McFiggans, G., Miller, L. A., Nájera, J. J., Polishchuk, E., Rae, S., Schiller, C. L., Si, M., Temprado, J. V., Whale, T. F., Wong, J. P. S., Wurl, O., Yakobi-Hancock, J. D., Abbatt, J. P. D., Aller, J. Y., Bertram, A. K., Knopf, D. A., and Murray, B. J.: A marine biogenic source of atmospheric ice-nucleating particles, Nature, 525, 234–238, https://doi.org/10.1038/nature14986, 2015.
Xie, S., Liu, X., Zhao, C., and Zhang, Y.: Sensitivity of CAM5-Simulated Arctic Clouds and Radiation to Ice Nucleation Parameterization, J. Climate, 26, 5981–5999, https://doi.org/10.1175/JCLI-D-12-00517.1, 2013.


