the Creative Commons Attribution 4.0 License.
the Creative Commons Attribution 4.0 License.
Investigation of CATS aerosol products and application toward global diurnal variation of aerosols
Logan Lee
Jeffrey S. Reid
John E. Yorks
We present a comparison of 1064 nm aerosol optical depth (AOD) and aerosol extinction profiles from the Cloud-Aerosol Transport System (CATS) level 2 aerosol product with collocated Aerosol Robotic Network (AERONET) AOD, Moderate Imaging Spectroradiometer (MODIS) Aqua and Terra Dark Target AOD and Cloud-Aerosol Lidar with Orthogonal Polarization (CALIOP) AOD and extinction data for the period of March 2015–October 2017. Upon quality-assurance checks of CATS data, reasonable agreement is found between aerosol data from CATS and other sensors. Using quality-assured CATS aerosol data, for the first time, variations in AODs and aerosol extinction profiles are evaluated at 00:00, 06:00, 12:00 and 18:00 UTC (and/or 00:00, 06:00, 12:00 and 18:00 local time or LT) on both regional and global scales. This study suggests that marginal variations are found in AOD from a global mean perspective, with the minimum aerosol extinction values found at 18:00 LT near the surface layer for global oceans, for both the June–November and December–May seasons. Over land, below 500 m, the daily minimum and maximum aerosol extinction values are found at 12:00 and 00:00/06:00 LT, respectively. Strong diurnal variations are also found over north Africa, the Middle East and India for the December–May season, and over north Africa, south Africa, the Middle East and India for the June–November season.
- Article
(2813 KB) - Full-text XML
- BibTeX
- EndNote
Aerosol measurement through the Sun-synchronous orbits of Terra and Aqua by nature encourages a larger-scale daily average point of view. Yet, we know that pollution (e.g., Zhao et al., 2009; Tiwari et al., 2013; Kaku et al., 2018), fires and smoke properties (e.g., Reid et al., 1999; Giglio et al., 2003; Hyer et al., 2013) and dust (e.g., Mbourou et al., 1997; Fiedler et al., 2013; Heinold et al., 2013) can exhibit strong diurnal behavior. Sun-synchronous passive satellite aerosol observations from the solar spectrum only provide a small sampling of the full diurnal cycle. Geostationary sensors such as the Advanced Himawari Imager (AHI) on Himawari 8 (Yoshida et al., 2018) and Advanced Baseline Imager on GOES-16/17 (Aerosol Product Application Team of the AWG Aerosols/Air Quality/Atmospheric Chemistry Team, 2012) satellites, while an improvement over their predecessors, must overcome the broader range of scattering and zenith angles (Wang et al., 2003; Christopher and Zhang, 2002) with no nighttime retrievals. Aerosol Robotic Network (AERONET; Holben et al., 1998) based Sun photometer studies improve sampling but until very recently with the development of a prototype lunar photometry mode, are also limited to daylight hours. The critical early morning and evening are largely missed in solar-observation-based approaches.
Observations of the diurnal variations of aerosol properties are needed for improving chemical transport modeling, geochemical cycles and ultimately climate. The measurement of diurnal variations of aerosol properties resolved in the vertical is especially crucial for visibility and particulate matter forecasts. Indeed, the periods around sunrise and sunset show significant near-surface variability that is difficult to detect with passive sensors. While lidar data from Cloud-Aerosol Lidar with Orthogonal Polarization (CALIOP) provide early afternoon and morning observations, two temporal points and a 16 d repeat cycle are insufficient to evaluate the critical morning and evening hours where many key aerosol life-cycle processes take place.
Some of the limiting factors in previous studies can be addressed by the Cloud-Aerosol Transport System (CATS) lidar that flew aboard the International Space Station (ISS) from 2015 to 2017 (McGill et al., 2015). The ISS's precessing orbit with a 51.6∘ inclination allows for 24 h sampling of the tropics to midlatitudes, with the ability to observe aerosol and cloud vertical distributions at both day- and nighttime, with high temporal resolution. For a given location within ±51.6∘ (latitude), after aggregating roughly 60 d of data, a near-full diurnal cycle of aerosol and cloud properties can be obtained from CATS observations (Yorks et al., 2016). This provides a new opportunity for studying diurnal variations (day and night) in aerosol vertical distributions from space observations.
Use of CATS has its own challenges. Most importantly, CATS retrievals must cope with variable solar noise around the solar terminator where we expect some of the strongest diurnal variability to exist. Further, CATS lost its 532 nm channel early in its deployment, leaving only a 1064 nm channel functioning. The availability of only one wavelength limited the CATS cloud–aerosol discrimination algorithm, which can cause a loss of accuracy compared to CALIPSO, which has two wavelengths. This deficiency is in part overcome by using the feature type score (CATS algorithm theoretical basis document). Using 2 years of observations from CATS, in this paper, we focus on understanding of the following questions: how well do CATS-derived aerosol optical depth (AOD) and aerosol vertical distributions compare with aerosol properties derived from other ground-based and satellite observations such as AERONET, MODIS and CALIOP? Do differences exhibit a diurnal cycle? What are the diurnal variations of aerosol optical depth on a global domain? What are the diurnal variations of aerosol vertical distribution on both regional and global scales?
Four datasets, including ground-based AERONET data, as well as satellite-retrieved aerosol properties from MODIS and CALIOP, are used for intercomparison with AOD and aerosol vertical distributions from CATS. Upon thorough evaluation and quality-assurance procedures, CATS data are further used for studying diurnal variations of AOD and aerosol vertical distributions for the period of March 2015–October 2017.
2.1 CATS
CATS level 2 (L2) version 3-00 5 km aerosol profile products (L2O_D-M7.2-V3-00_05kmPro, L2O_N-M7.2-V3-00_05kmPro) were used in this study for nearly the entire period of CATS operation on the ISS (∼ March 2015–October 2017). CATS L2 profile data are provided at 5 km along-track horizontal resolution and 533 vertical levels at 60 m vertical resolution and a wavelength of 1064 nm. CATS also provides data at 532 nm, but due to a laser-stabilization issue, 532 nm data are not recommended for use (Yorks et al., 2016). Thus, only 1064 nm products were used in this study. Although the uncertainties in CATS aerosol retrievals have not yet been documented for the CATS V3-00 extinction and AOD products, much like CALIOP, uncertainties in the calibration and assumed lidar ratios are the primary contributors to the extinction and AOD uncertainties. The uncertainties in the CATS 1064 nm attenuated total backscatter (ATB) are on the order of 7 %–10 % for nighttime and are around 20 % for daytime (Pauly et al., 2019), while the uncertainties in the assumed 1064 nm lidar ratios for CATS are 30 %. Thus, the CATS 1064 nm extinction (40 %–70 %) and AOD (30 %–50 %) uncertainties are very similar to the corresponding CALIOP 1064 nm uncertainties.
CATS data are quality assured following a manner similar to Campbell et al. (2012), which was applied to CALIOP. Quality assurance (QA) thresholds (including extinction quality control (QC) flag, feature type score and uncertainty in extinction coefficient) are listed below:
- a.
Extinction_QC_Flag_1064_Fore_FOV = 0 (non-opaque layer; lidar ratio unchanged).
- b.
Feature_Type_Fore_FOV = 3 (contains aerosols only).
- c.
Feature_Type_Score_Fore_FOV (feature type score <0 is aerosol, with −10 being complete confidence and 0 being as likely to be clouds as aerosol).
- d.
Extinction_Coefficient_Uncertainty_1064_ Fore_FOV km−1.
Extinction was also constrained using a threshold as provided in the CATS data catalog (Extinction_Coefficient_1064_Fore_FOV km−1), similar to several previous studies (Redemann et al., 2012; Toth et al., 2016). Only profiles with extinction coefficient values less than 1.25 km−1 are included in this study. Small negative extinction coefficient values, however, are included in aerosol-profile-related analysis, to reduce potential high biases in computed mean profiles. Note that a similar approach has also been conducted in deriving passive-based AOD climatology (e.g., Remer et al., 2005). For this study, both the Aerosol_Optical_Depth_1064_Fore_FOV and Extinction_Coefficient_1064_Fore_FOV datasets were used to provide AOD and 1064 nm extinction profiles (hereafter the term “extinction” refers to 1064 nm unless explicitly stated otherwise), respectively.
2.2 CALIOP
NASA's CALIOP is an elastic backscatter lidar that operates at both 532 and 1064 nm wavelengths (Winker et al., 2009). Being a part of the A-Train constellation (Stephens et al., 2002), CALIOP provides both day- and nighttime observations of Earth's atmospheric system, at a Sun-synchronous orbit, with a laser spot size of around 70 m and a temporal resolution of ∼16 d (Winker et al., 2009). For this study, CALIOP level 2.0 version 4.1 5 km aerosol profile products (L2_05kmAProf) are used for intercomparison with CATS-retrieved AODs and aerosol vertical distributions.
L2_05kmAProf data are available at 5 km along-track horizontal resolution and include aerosol retrievals at both 532 and 1064 nm wavelengths. The vertical resolution is 60 m near the surface, degrading to 180 m above 20.2 km in mean sea level (MSL) altitude. As only 1064 nm CATS data are used in this study as mentioned above, likewise only those CALIOP parameters relating to 1064 nm are used in this study (Vaughan et al., 2019; Omar et al., 2013). Note that as suggested by Rajapakshe et al. (2017), lower signal-to-noise ratio (SNR) and higher minimum detectable backscatter are found for the CALIOP 1064 nm data in comparison with the CALIOP 532 nm data. Also, the CALIOP aerosol layers are detected at 532 nm and the 1064 nm extinction is only computed for the bins within these layers. This may introduce a bias for aerosol above-cloud studies. The uncertainties in retrieved aerosol extinction, as suggested by Young et al. (2013), are around 0.05–0.5 km−1 for the 532 nm channel. Validated against AERONET data, Omar et al. (2013) suggested that 74 % and 81 % of the CALIOP AOD retrievals fall within the expected uncertainties () as suggested by Winker et al. (2009) for the 1064 nm channel, for all-sky and clear-sky conditions, respectively.
In this study, Extinction_Coefficient_1064 and Column_Optical_Depth_Tropospheric_Aerosols_1064 are used for CALIOP extinction and AOD retrievals, respectively (Vaughan et al., 2019; Omar et al., 2013). As with the CATS data, CALIOP data are quality assured following the quality-assurance steps as mentioned in a few previous studies (e.g., Campbell et al., 2012; Toth et al., 2016, 2018). These QA thresholds are listed below:
- a.
Extinction_QC_Flag_1064 = 0 (unconstrained retrieval; initial lidar ratio unchanged).
- b.
Atmospheric_Volume_Description = 3 or 4 (contains aerosols only).
- c.
CAD_Score (CAD < 0 is aerosol, with −100 being complete confidence and 0 being as likely to be clouds as aerosol).
- d.
Extinction_Coefficient_Uncertainty_1064 km−1.
Furthermore, as in Campbell et al. (2012), only those profiles with AOD > 0 were retained in order to avoid profiles composed of only retrieval fill values. Extinction was also constrained to the nominal range provided in the CALIOP data catalog (Extinction_1064 km−1), similar to our QA procedure for CATS as described above.
2.3 MODIS Collection 6.1 Dark Target product
Moderate Resolution Imaging Spectroradiometer (MODIS) Collection 6.1 Aqua and Terra Dark Target over-ocean AOD data (Levy et al., 2013) were used for comparison to CATS AOD. The data field of Effective_Optical_Depth_Best_Ocean was used, and only those data flagged as “good” or “very good” by the Quality_Assurance_Ocean runtime QA flags were selected for this study, similar to Toth et al. (2018). Because MODIS does not provide AOD in the 1064 nm wavelength, AOD retrievals from 860 and 1240 nm spectral channels are used to logarithmically interpolate AODs at 1064 nm. Here, we assume the Ångström exponent value, computed using instantaneous AOD retrievals at the 860 and 1240 nm, remains the same for the 860 to 1064 nm wavelength range, similar to what has been suggested by Shi et al. (2011, 2013). Mean and standard deviation of Ångström exponents using this method were 0.69 and 0.55, respectively. Only totally cloud-free (or cloud fraction equal to zero) retrievals, as indicated by the Aerosol_Cloud_Fraction_Ocean parameter, are used. While the uncertainties in MODIS infrared (e.g., 1240 nm) retrievals are less explored, the reported over-ocean MODIS DT AOD retrievals are () for the green channel (Levy et al., 2013).
2.4 AERONET
By measuring direct and diffuse solar energy, AERONET observations are used for retrieving AOD and other ancillary aerosol properties such as size distributions (Holben et al., 1998). AERONET data are considered as the ground truth for evaluating CATS retrievals in this study. Only cloud-screened and quality-assured version 3 level 2 AERONET data at the 1020 nm spectrum are selected and are used for intercomparison with CATS AOD retrievals at the 1064 nm wavelength. AERONET does not have specific guidance on error in the 1020 nm channel, as it is known to have some thermal sensitivities. However, they do report significantly more confidence in version 3 of the data, which has temperature correction (Giles et al., 2019). Error models are ongoing, and for this study we assume double the root mean square error (RMSE) or ±0.03. Note that version 3 AERONET data are designed to reduce thin cirrus cloud contamination as well as rescue heavy aerosol scenes that were misclassified as clouds in previous versions (e.g., Giles et al., 2019).
3.1 Intercomparison of CATS data with AERONET, MODIS and CALIOP data
Note that most evaluation efforts for passive and active sensor AOD retrievals are focused on the visible spectrum and the performance of AOD retrievals at the 1064 nm channel is less explored. Thus, in this subsection, the performance of over-land and over-ocean CATS AOD retrievals is compared against AERONET and C6.1 over-ocean MODIS Dark Target (DT) aerosol products. In AOD-related studies, CATS- and CALIOP-reported AOD values are used. However, only AOD values with corresponding aerosol vertical extinction that meet the QA criteria as mentioned in Sect. 2.1 and 2.2 were used. CATS-derived aerosol extinction vertical distributions are also cross-compared against collocated CALIOP aerosol extinction vertical distributions.
3.1.1 CATS-AERONET
As the initial check, CATS data from nearly the entire mission (March 2015–October 2017) were spatially (within 0.4∘ latitude and longitude) and temporally (±30 min) collocated against ground-based AERONET data. Note that one AERONET measurement may be associated with several CATS retrievals in both space and time, and vice versa. Thus, both CATS and AERONET data were further averaged spatially and temporally, which results in only one pair of collocated and averaged CATS and AERONET data for a given collocated incident. Also, only data pairs with AOD larger than 0 from both instruments are used for the analysis. This step is necessary to exclude CATS profiles with all retrieval fill values as discussed in Sect. 2 (Toth et al., 2018). Such profiles containing all retrieval fill values were found to make up approximately 5.3 % of all CATS profiles in the dataset. Note that the CATS-AERONET comparisons are for daytime only, and higher uncertainties are expected for CATS daytime than nighttime AODs.
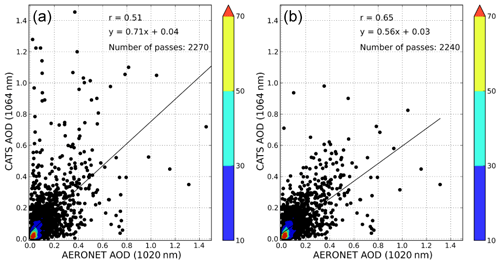
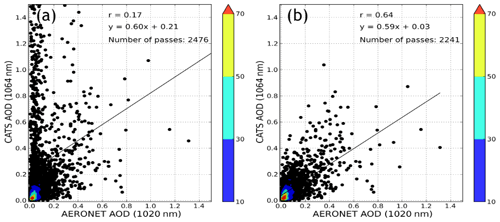
Figure 1Collocated AERONET 1020 nm AOD vs. CATS 1064 nm AOD (a) without CATS QA applied and (b) with CATS QA applied.
As shown in Fig. 1a, without quality-assurance procedures, high spikes in CATS AOD of above 1 (1064 nm) can be found for collocated AERONET data with AOD less than 0.4 (1020 nm). Still, those high spikes in CATS AOD are much reduced compared to the V2-01 CATS aerosol products (e.g., a similar plot to Fig. 1 is included in Appendix A with the use of V2-01 CATS aerosol data). Upon completion of the QA steps as outlined in Sect. 2.1, a reasonable agreement is found between quality-assured CATS (1064 nm) vs. AERONET (1020 nm) AODs with a correlation of 0.65 (Fig. 1b). Comparing Fig. 1a with b, with the loss of only ∼1 %–2 % of collocated pairs due to the QA procedures, we have observed an overall improvement in correlation between CATS and AERONET AOD from 0.51 to 0.65; thus, only quality-assured CATS data are used hereafter. We also found that requiring the extinction QC flag to be equal to 0 and the extinction uncertainty to be less than 10 km−1 had the largest impacts on reducing the difference in mean and medians of the AERONET and CATS AOD. Still, this exercise highlights the need for careful quality checks of the CATS data before applying the CATS data for advanced applications to overcome cloud–aerosol discrimination uncertainties.
3.1.2 CATS-MODIS
To examine over-ocean performance, column-integrated CATS AODs are intercompared with collocated MODIS C6.1 Terra and Aqua DT over-ocean AODs, interpolated to 1064 nm. Over-ocean MODIS C6.1 DT data are selected due to the fact that higher accuracies are reported for over-ocean vs. over-land MODIS DT AOD retrievals (Levy et al., 2013). In addition, compared to over-land MODIS DT data, which provide AOD retrievals at three discrete wavelengths (0.47, 0.55 and 0.65 µm), over-water AOD retrievals are available from seven wavelengths including the 0.86 and 1.24 µm spectral channels, allowing a comparison with CATS AOD at the same wavelength upon logarithmic interpolation, again, assuming the aerosol Ångström exponent value remains unchanged from 0.86 to 1.064 µm as well as from the 1.064 to 1.24 µm spectral channels.
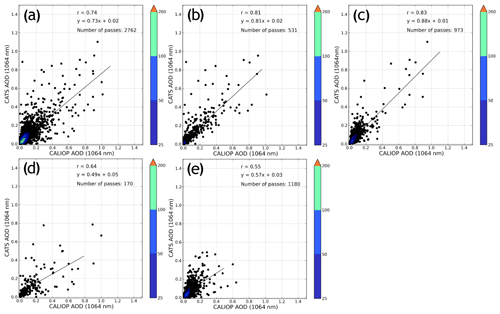
Figure 2Collocated MODIS C6.1 (a) Terra and (b) Aqua interpolated 1064 nm AOD vs. CATS 1064 nm AOD with CATS QA applied.
MODIS and CATS AOD retrievals are collocated for the study period of March 2015–October 2017 (Fig. 2). Pairs of CATS and MODIS data were first selected for both retrievals that fall within ±30 min and 0.4∘ latitude and longitude of each other. Then, similar to the AERONET and CATS collocation procedures, collocated pairs were further averaged to construct one pair of collocated MODIS and CATS data for a given collocation incident. Shown in Fig. 2a, a correlation of 0.72 is found between collocated over-water MODIS C6.1 Terra DT and CATS AODs with a slope of 0.74. Similar results are found for the comparisons between over-water MODIS Aqua and CATS AODs with a correlation of 0.74 and a slope of 0.70.
3.1.3 CATS-CALIOP AOD
In the previous two sections, AODs from CATS were intercompared with retrievals from passive-based sensors such as MODIS and AERONET. In this section, AOD data from CALIOP, which is an active sensor, are evaluated against AOD retrievals from CATS. Note that despite difference in instrumental designs, CALIOP and CATS are both elastic backscatter lidars. Again, for each collocation incident, pairs of CALIOP and CATS data are selected in which both retrievals fall within ±30 min temporally and 0.4∘ latitude and longitude spatially. There could be multiple CATS retrievals corresponding to one CALIOP data point, and vice versa. Thus, the collocated pairs are further averaged in such a way that only one pair of collocated CATS and CALIOP data is derived for each collocation incident.
Figure 3a shows the comparison of CATS and CALIOP AODs for all collocated pairs including both day- and nighttime. A reasonable correlation of 0.74, with a slope of 0.73, is found for a total of 2762 collocated data pairs. Further breaking down the comparison into day and night cases, a much better agreement is found between the two datasets during nighttime with correlations of 0.83 and 0.81 for over-ocean and over-land cases, respectively. In comparison, a lower correlation of 0.64, with a slope of 0.49, is found between the two datasets, using over-land daytime data only, for a total of 170 collocated pairs. Correspondingly, a lower correlation of 0.55, with a slope of 0.57, is found between the two datasets, using over-ocean daytime data only, for a total of 1180 collocated pairs. This result is not surprising, as daytime data from both CALIOP and CATS are nosier due to solar contamination (e.g., Omar et al., 2013; Toth et al., 2016).
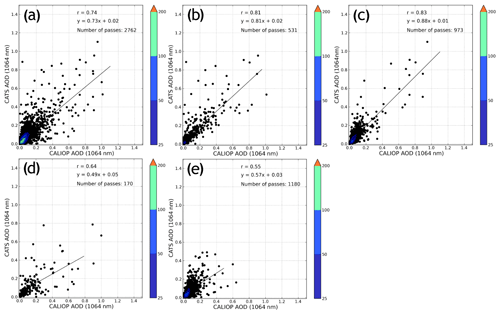
Figure 3Collocated CALIOP 1064 nm AOD vs. CATS 1064 nm AOD with CATS QA applied for (a) both day and night, (b) nighttime over land, (c) nighttime over water, (d) daytime over land and (e) daytime over water.
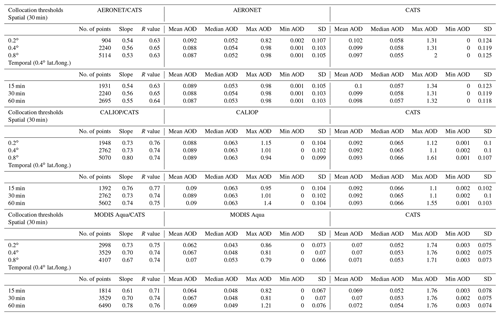
Note that based on the slopes of the regression lines shown in Figs. 1–3, AODs retrieved by CATS are less than AERONET, CALIOP and MODIS Aqua DT AOD retrievals. As shown in Table 1, however, for the 1-to-1 collocated datasets, mean CATS AODs (1064 nm) are ∼10 % higher than AERONET AODs (1020 nm). The CATS AODs are ∼3 % higher than CALIOP AOD (1064 nm) and are ∼5 %–10 % higher than DT MODIS AODs. One possible explanation for this discrepancy is because mean AODs are dominated by low AOD cases and the slopes of the regression relationships are strongly affected by a few high AOD cases. Thus, it is likely that CATS AODs are overestimated at the low AOD ranges and are underestimated at the high AOD ranges.
Table 1Descriptive statistical properties between collocated CATS and AERONET, CALIOP and MODIS AOD retrievals. Here, SD indicates standard deviation of AOD and R value represents the correlation coefficient.

Also note that as suggested by Omar et al. (2013), the choices of spatial and temporal collocation windows have an effect on collocation results. Thus, we repeated the exercises in Figs. 1–3 by doubling the spatial and temporal collocation windows as well as reducing the collocation windows by half. The descriptive statistics of this sensitivity study are included in Table 2. While the number of collocated data pairs is drastically affected by the spatial and temporal collocation window sizes, less significant changes are found in descriptive statistics such as mean, median and standard deviations of AODs, as well as slopes and correlation values. The slope of MODIS Aqua DT and CATS AODs, however, seems sensitive to changes in collocation methods. Changes in slope of 0.61 to 0.78 are found for the change of temporal collocation window from 15 to 60 min with a fixed spatial collocation window of 0.4∘ latitude/longitude.
Table 2Sensitivity study of descriptive statistical properties between collocated CATS and AERONET, CALIOP and MODIS Aqua AOD retrievals by varying spatial and temporal collocation windows. Here, SD indicates standard deviation of AOD and R value represents the correlation coefficient.
Still, larger discrepancies between CATS and CALIOP AODs during daytime indicate that both sensors are susceptible to solar contamination. To overcome solar contamination and more accurately detect aerosol layers, CALIOP and CATS data products are averaged up to 80 and 60 km, respectively. Noel et al. (2018) found that the feature type score can be used for cloud screening throughout the diurnal envelope of solar angles. To further evaluate impact of the solar-contamination-introduced bias in the diurnal analysis in aerosol detection or products, CATS AODs are evaluated as a function of local time. For each CATS observation of a given location and UTC time, the associated local time is computed by adding the UTC time by 1 h per 15∘ longitude away from the prime meridian in the east direction. Figure 4a shows the CATS AOD vs. local time for both global land and oceans, constructed using 6 h mean CATS AOD binned on a 5∘ by 5∘ grid globally. While the data have additional noise, no major deviations in AODs are found during either sunrise or sunset times, although we speculate that larger uncertainties in CATS AODs and extinctions may be present around day and night terminators. Figure 4b shows a similar plot to Fig. 4a but with the region restricted to 25–52∘ S. Here, we want to investigate the variations in CATS AODs as a function of local time, over relatively aerosol-free oceans. We picked 25∘ S as the cutoff line as CATS data are only available to 51.6∘ S (limited to the ISS inclination angle), and thus this threshold is used to ensure enough data samples in the analysis, although some land regions are also included. As indicated in Fig. 4b, again, no significant deviations in pattern are found for both sunrise and sunset times, plausibly indicating that solar contamination, as speculated, may not be as significant. Comparing the mean AOD at local midnight to the mean AOD at local noon by performing a Student's t test, the difference is not significant at the 95 % confidence level, with a p value of 0.16.
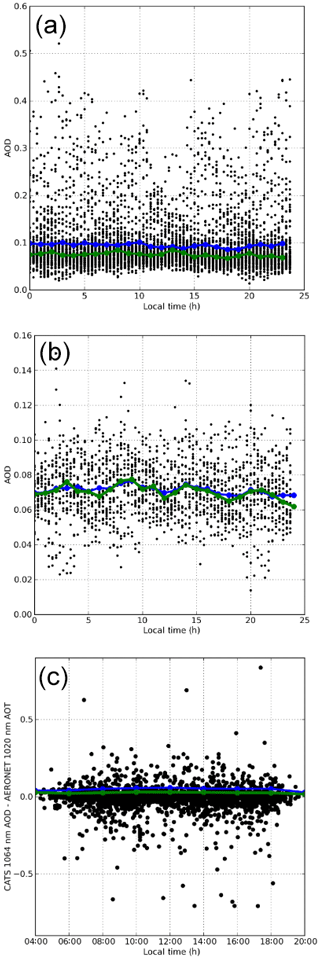
Figure 4CATS 1064 nm AOD (a) as a function of local time for the globe and (b) as a function of local time for areas south of −25∘. The difference between CATS 1064 nm AOD and AERONET 1020 nm AOD as a function of local time is shown in panel (c). The mean is represented by the blue line, while the median is the green line.
Figure 4c shows the difference between AERONET (1020 nm) and CATS (1064 nm) AOD (ΔAOD) as a function of local time. Again, although data are rather noisy, no major pattern is found near sunrise or sunset times, further indicating that solar contamination during dawn or dusk times may have a less severe impact on CATS AOD retrievals from a long-term mean perspective. In summary, Sect. 3.1.1–3.1.3 suggest that with careful QA procedures, AOD retrievals from CATS are comparable to those from other existing sensors such as AERONET, MODIS and CALIOP at the same local times.
3.1.4 CATS-CALIOP vertical extinction profiles
One advantage of CATS is its ability to retrieve both column-integrated AOD and vertical distributions of aerosol extinction. Therefore, in this section, extinction profiles from CATS are compared with that from CALIOP. Again, similar to Sect. 3.1.3, collocated profiles for CATS and CALIOP are first found for both retrievals that are close in space and time (within ±30 min and 0.4∘ latitude and longitude). However, different from Sect. 3.1.3, only one pair of collocated CATS and CALIOP profiles, which has the closest Euclidian distance on the Earth's surface, is retained for each collocated incident.
The CATS cloud–aerosol discrimination (CAD) algorithm is a multi-dimensional probability density function (PDF) technique that is based on the CALIPSO algorithm (Liu et al., 2009). The PDFs were developed based on cloud physics lidar (CPL) measurements obtained during over 11 field campaigns and 10 years. As shown in Fig. 5e, a reasonable agreement is found between CATS V3-00 aerosol extinction with CALIOP for over land. However, CATS overestimates aerosol extinction around 1 km compared to CALIOP over ocean (Fig. 5d). This can also be seen on a plot of the difference between CATS and CALIOP 1064 nm extinction for all collocated profiles, included in Fig. 5f, where there is an overall positive difference around 1 km.
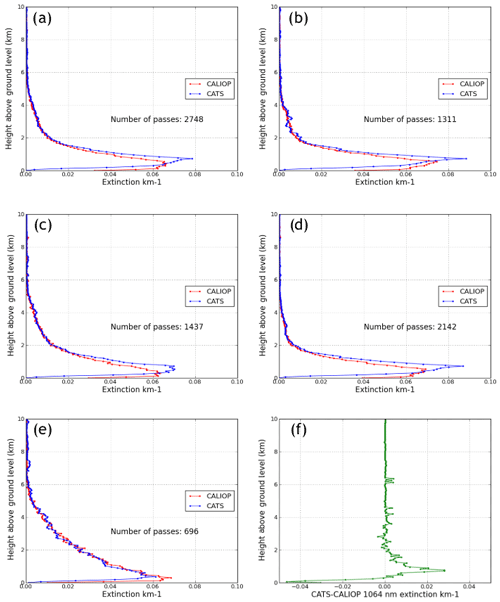
Figure 5CATS and CALIOP vertical profiles of 1064 nm extinction for (a) all profiles, (b) daytime only, (c) nighttime only, (d) over water and (e) over land (including coastal profiles). Panel (f) shows the difference between CATS and CALIOP mean 1064 nm extinction for all collocated profiles (5a) as a function of height. Mean AOD values are as follows: for CATS: (a) 0.094, (b) 0.091, (c) 0.098, (d) 0.088 and (e) 0.119; and for CALIOP: (a) 0.093, (b) 0.092, (c) 0.093, (d) 0.084 and (e) 0.127.
Due to the precessing orbit of the ISS, the CATS sampling is irregular and very different compared to the Sun-synchronous orbits of the A-Train sensors. These orbital differences between CATS and CALIOP make comparing the data from these two sensors challenging since they are fundamentally observing different locations of the Earth at different times. Thus, we should not expect the extinction profiles and AOD from these two sensors to completely agree. Additionally, there are other algorithm and instrument differences that can lead to differences in extinction coefficients and AOD. Over land where dust is the dominant aerosol type, differences in lidar ratios between the two retrieval algorithms (CATS uses 40 sr while CALIOP uses 44 sr) can cause CATS extinction coefficients that are up to 10 % lower than CALIOP, potentially explaining the higher CALIOP extinction values in Fig. 5e. Over ocean, especially during daytime, differences in CATS and CALIOP lidar ratios for marine and smoke aerosols can introduce a difference between CATS and CALIOP extinction coefficients (Fig. 5d). These differences in over-ocean data (Fig. 5d) could also be attributed to differences in CATS and CALIOP 1064 nm backscatter calibration. For example, Pauly et al. (2019) reports that CATS attenuated total backscatter is about 19.7 % lower than PollyXT measurements in the free troposphere and 18.2 % lower than CALIOP opaque cirrus clouds due to calibration uncertainties for both sensors.
Also, differences in the lowest 250 m between CATS and CALIOP extinction profiles are observable, which are due to how the instrument algorithms detect the surface and near-surface aerosols. Both the CATS and CALIOP feature detection algorithms create a gap between the surface and near-surface aerosol base altitude, despite the possible presence of aerosols in this altitude region. CALIOP has an aerosol base extension algorithm that is designed to (1) detect scenarios when aerosols are present in the bins just above the surface and (2) extend the near-surface aerosol layer base down to the surface (Tackett et al., 2018). However, CATS does not use such an algorithm, so false regions of “clear air” exist between the surface and near-surface aerosol layers.
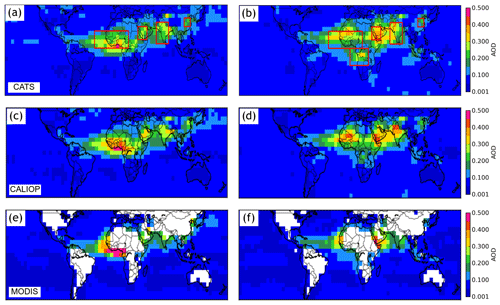
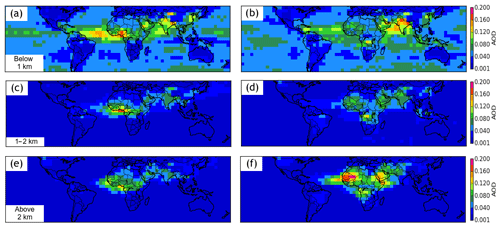
Figure 6Mean AOD (1064 nm) by season for (a) DJFMAM CATS, (b) JJASON CATS, (c) DJFMAM CALIOP, (d) JJASON CALIOP, (e) DJFMAM MODIS Aqua and (f) JJASON MODIS Aqua. Red boxes indicate locations of regional vertical distributions in Figs. 12 and 13.
Vertical profiles of collocated CATS and CALIOP extinction for daytime-only profiles and nighttime-only profiles are shown in Fig. 5b and c, respectively. Compared to a total collocated pair count of 2748 in the overall profile data, day and night profiles have 1311 and 1437 collocated pairs, respectively. Again, the shapes of the CATS and the CALIOP extinction vertical profiles are similar for all three cases, despite the abovementioned offsets in altitude. Figure 5d and e show the mean of those extinction profiles which occurred over water and over land, as defined by the CATS surface type flag. Again, in both cases, CATS and CALIOP have similar shapes in their vertical extinction profiles. The vertical structure of over-water extinction is also very similar to that of all profiles, day and night, which is perhaps not surprising as water profiles made up 2142 of 2748 (∼78 %) collocated pairs. The vertical structure of over land is more different than the other groups, as the extinction is higher throughout a larger depth of the atmosphere, tapering off much more slowly from the surface. Furthermore, the peak extinction from CATS is actually lower than CALIOP for over-land profiles, unlike all other categories.
3.2 Diurnal cycle of AODs and aerosol vertical distributions
Using the quality-assured CATS data, seasonal variations as well as diurnal variations in CATS AODs are derived in this section. Diurnal variations in the vertical distributions of CATS aerosol extinction are also examined at both global and regional scales.
3.2.1 Seasonal and diurnal variations of AOD
Figure 6a–b show the spatial distributions of CATS AODs at the 1064 nm spectral channel for boreal winter–spring (December–May, DJFMAM) and boreal summer–fall (June–November, JJASON) seasons, for the period of March 2015–October 2017. To construct Fig. 6a and b, quality-assured CATS AODs are first binned on a 5∘ by 5∘ grid over the globe for the abovementioned two bi-seasons. For each 5∘ × 5∘ (latitude/longitude) bin, for a given season, CATS AODs are averaged on a pass basis first and then further averaged seasonally to represent AOD value of the given bin. Both daytime and nighttime retrievals are included in this figure, as well as in Figs. 7–9.
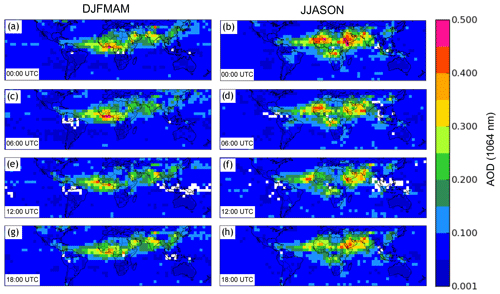
Figure 8Seasonal mean AOD (1064 nm) binned by every 6 h for (a) DJFMAM 00:00 UTC, (b) JJASON 00:00 UTC, (c) DJFMAM 06:00 UTC, (d) JJASON 06:00 UTC, (e) DJFMAM 12:00 UTC, (f) JJASON 12:00 UTC, (g) DJFMAM 18:00 UTC and (h) JJASON 18:00 UTC.
In the DJFMAM season, significant aerosol features are found over north Africa, the Middle East, India and eastern China. For the JJASON season, besides the abovementioned regions, aerosol plumes are also observable over south Africa, related to summer biomass burning of the region (e.g., Eck et al., 2013). The seasonal-based spatial distributions of AODs from CATS, although reported at the 1064 nm channel which is different from the 550 nm channel that is conventionally used, are similar to some published results (e.g., Lynch et al., 2016).
For comparison purposes, Fig. 6c–d show similar plots to Fig. 6a–b but with the use of CALIOP AOD at the 1064 nm spectral channel. Note that those are climatological means rather than pairwise comparisons. While patterns are similar in general, at regions with peak AODs of 0.4 or above for CALIOP, such as north Africa for the DJFMAM season and north Africa, the Middle East and India for the JJASON season, much lower AODs are found for CATS. However, in some other regions, such as over south Africa for the JJASON season, higher CATS AOD values are observed. A table of mean AOD across each of these regions as well as over the globe (within the latitude range where CATS has data) has been included for reference (Tables 3). Figure 6e and f show similar spatial plots to Fig. 6a and b but with the use of MODIS Aqua AODs from the DT products (using all available MODIS DT retrievals that passed QA steps as described in Sect. 2.3). For the MODIS Aqua DT products, aerosol retrievals at the shortwave infrared channels are only available over oceans, and thus Fig. 6e–f show only over-ocean retrievals. Again, while general AOD patterns look similar, discrepancies are also visible, such as over the coast of southwest Africa for the JJASON season and over the west coast of Africa for the DJFMAM season. Those discrepancies may result from biases in each product, but it is also possibly due to the differences in satellite overpass times, as CALIOP provides early morning and afternoon overpasses, and MODIS Aqua has an overpass time after local noon, while CATS is able to report atmospheric aerosol distributions at multiple times during a day.
Table 3CALIOP and CATS mean AODs/AOD standard deviations for regions as highlighted in Fig. 6 and globally within ±52∘ latitude.

Similar to Fig. 6a and b, Fig. 7a and b show the spatial distribution of CATS AODs but for CATS extinction values that are below 1 km above ground level (a.g.l.) only, for the DJFMAM and JJASON seasons, respectively. Figure 7c and d show the CATS mean AOD plots for extinction values from 1 to 2 km a.g.l., while Fig. 7e and f show CATS mean AOD for extinction values above 2 km a.g.l.. For the DJFMAM season, elevated aerosol plumes with altitude above 2 km a.g.l. are found over north Africa. For the JJASON season, elevated dust plumes (> 2 km a.g.l.) are found over the north African and the Middle Eastern regions, while elevated smoke plumes are found over the west coast of south Africa where above-cloud smoke plumes are often observed during the northern hemispheric summer season (e.g., Alfaro-Contreras et al., 2016).
CATS has a non-Sun-synchronized orbit, which enables measurements at nearly all solar angles. Thus, we also constructed 5∘ × 5∘ (latitude/longitude) gridded seasonal averages (for DJFMAM and JJASON seasons) of CATS AODs at 00:00, 06:00, 12:00 and 18:00 UTC that represent four distinct times in a full diurnal cycle, as shown in Fig. 8. To construct the seasonal averages, observations within ±3 h of a given UTC time as mentioned above are averaged to represent AODs for the given UTC time. On a global average, the mean AODs are 0.090, 0.089, 0.088 and 0.089 for 00:00, 06:00, 12:00 and 18:00 UTC, respectively, for the JJASON season and are 0.099, 0.096, 0.093 and 0.093 for the DJFMAM season. Thus, no significant diurnal variations are found on a global scale.
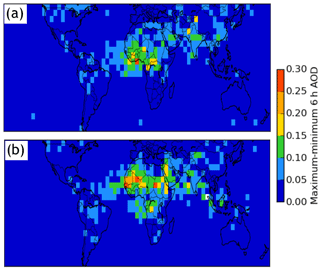
Still, strong diurnal variations with the maximum averaged diurnal AOD changes of above 0.10 can be observed for regions with significant aerosol events such as north Africa, the Middle East and India for the DJFMAM season and north Africa, south Africa, the Middle East and India for the JJASON season, as illustrated in Fig. 9. Note that Fig. 9a shows the maximum minus minimum seasonal mean AODs for the four different times, as shown in Fig. 8a, c, e, g. Similarly, Fig. 9b shows the maximum minus minimum seasonal mean AODs for the four different times as shown in Fig. 8b, d, f, h. Interestingly but not unexpectedly, regions with maximum diurnal variations match well with locations of heavy aerosol plumes as shown in Figs. 6 and 8.
Table 4Geographic ranges, height above ground level of maximum extinction, diurnal extinction range at height of maximum extinction and time (local) of peak extinction for the boxed red regions in Fig. 6 and vertical profiles shown in Figs. 12 and 13. Note that only the JJASON season is analyzed for the South Africa region.

3.2.2 Diurnal variations of aerosol extinction on a global scale (both at UTC and local time)
Using quality-assured CATS-derived aerosol vertical distributions, mean global CATS extinction vertical profiles are also generated as shown in Fig. 10. Similar to steps as described in Sect. 3.2.1, CATS extinction profiles are binned into 00:00, 06:00, 12:00 and 18:00 UTC times based on the closest match in time for the JJASON and DJFMAM seasons. Figure 10a shows the daily averaged CATS extinction profiles on a black line, and 00:00, 06:00, 12:00 and 18:00 UTC averaged on blue, green, yellow and red lines, respectively, for the DJFMAM season. A similar plot is shown in Fig. 10d for the JJASON season. CATS extinction profiles for the daily average as well averages for the four selected times are similar, suggesting that minor temporal variations in CATS extinctions can be expected for global averages.
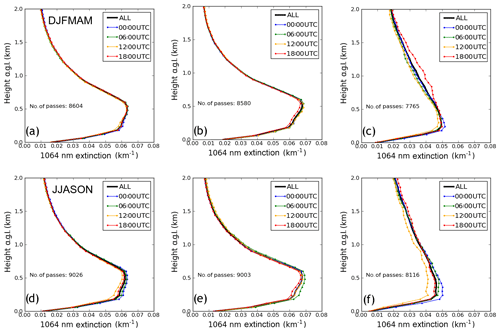
Figure 10Global mean 6 h vertical profiles of CATS 1064 nm extinction for (a) all DJFMAM profiles, (b) DJFMAM water profiles, (c) DJFMAM non-water profiles, (d) all JJASON profiles, (e) JJASON water profiles and (f) JJASON non-water profiles. Mean AODs are as follows: (a) 0.084, (b) 0.078, (c) 0.098, (d) 0.089, (e) 0.082 and (f) 0.102.
Those global averages are dominated by CATS profiles from global oceans (Fig. 10b and e), which also have small diurnal variations, as ∼70 % of the globe is covered by water. In comparison, noticeable diurnal changes in aerosol vertical distributions are found over land as shown in Fig. 10c and f. For the DJFMAM season, at the 1 km altitude, the minimum and maximum aerosol extinctions are at 12:00 and 18:00 UTC, respectively. Similarly, the minimum and maximum aerosol extinctions are at 12:00 and 00:00 UTC below 400 m. For the JJASON season, the minimum aerosol extinction values are found at 12:00 UTC for the whole 0–2 km column, while the maximum aerosol extinction values are at 18:00 UTC for 1.5 km and 00:00 UTC for the 300–400 m altitude. Still, it should be noted that aerosol concentrations may be a function of local time, yet for a given UTC time, local times will vary by region. Also, due to solar contamination, nighttime retrievals from CATS are significantly and demonstrably less noisy than daytime retrievals, and this difference in sensor sensitivity between day and night may further affect the derived diurnal variations in CATS AOD and aerosol vertical profiles as shown in Fig. 3 for individual retrievals. Still, no apparent solar pattern is detectable from Fig. 8, and only minor diurnal variations are found for Fig. 10a and d, which indicate that such a solar contamination may introduce noise but not bias to daytime aerosol retrievals from a global mean perspective.
However, if we examine the mean global CATS extinction vertical profiles with respect to local time, as shown in Fig. 11, some distinct features appear. For example, Fig. 11a and d suggest that, on global average, the minimum aerosol extinction below 1 km is found for 18:00 local time (LT), for both JJASON and DJFMAM seasons. Similar patterns are also observed for over global oceans. However, for over-land cases, for both seasons, the minimum and maximum aerosol extinction below 500 m is found for 12:00 and 00:00/06:00 LT.
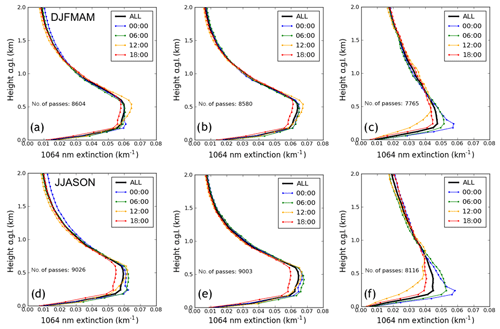
Figure 11Global mean 6 h (00:00, 06:00, 12:00 and 18:00 LT) vertical profiles of CATS 1064 nm extinction for (a) all DJFMAM profiles, (b) DJFMAM water profiles, (c) DJFMAM non-water profiles, (d) all JJASON profiles, (e) JJASON water profiles and (f) JJASON non-water profiles. Mean AODs are as follows: (a) 0.080, (b) 0.079, (c) 0.095, (d) 0.082, (e) 0.081 and (f) 0.105.
3.2.3 Diurnal variations of aerosol extinction on a regional scale (at local time)
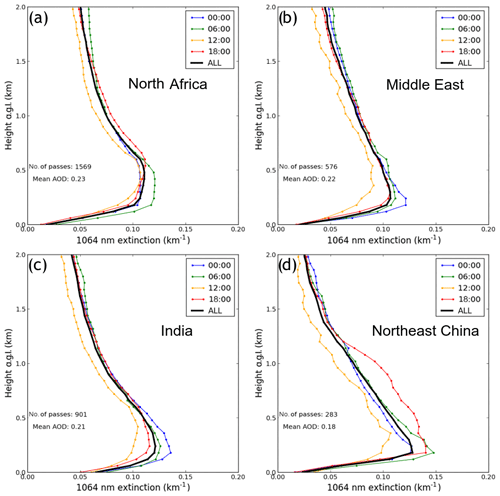
In this section, the diurnal variations of aerosol vertical distributions are studied as a function of local solar time for selected regions with high mean AODs as highlighted in Fig. 6. Note a near-1-to-1 transformation can be achieved between UTC and local solar time. Also, as learned from the previous section, aerosol features are likely to have a local time dependency. A total of four regions, including north Africa, the Middle East, India and northeast China, which show significant seasonal mean AODs in Fig. 6, are selected for the DJFMAM season (Fig. 12). For the JJASON season (Fig. 13), in addition to the abovementioned four regions, the south African region is also included due to biomass burning in the region during Northern Hemisphere summertime. The latitude/longitude boundary of each selected region is described in Table 4. Regional-based analyses are also conducted for four selected regions for the DJFMAM season and five selected regions for the JJASON season at four local times: 00:00 (midnight), 06:00, 12:00 and 18:00 LT, using quality-assured CATS profiles. Generally, the maximum diurnal change in aerosol extinction is found at the altitude of below 1 km for all regions as well for both seasons. Also, larger diurnal variations in vertical distributions of aerosol extinction are found for the JJASON season, in comparison to the DJFMAM season, while regional-based differences are apparent.
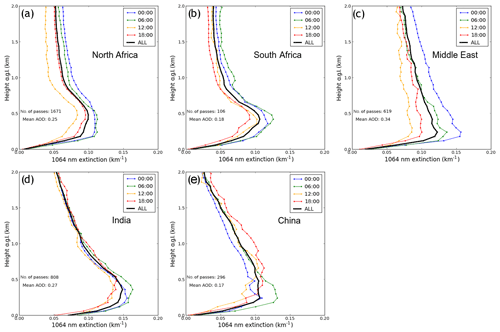
Figure 13JJASON 6 h average (00:00, 06:00, 12:00 and 18:00 LT) vertical profiles of CATS 1064 nm for locations shown in Fig. 6b; (a) north Africa, (b) south Africa, (c) the Middle East, (d) India and (e) northeast China.
For the north African region, the dominant aerosol types are dust and smoke aerosol for the DJFMAM season and dust for the JJASON season (e.g., Remer et al., 2008). Interestingly, the maximum aerosol extinction below 500 m is found at 06:00 LT for the DJFMAM season. While for the JJASON season, the maximum aerosol extinctions are found at 0:00/06:00 LT for the 100–500 m layer, with a significant ∼10 %–20 % higher aerosol extinction from the daily mean. Note that 06:00 LT in the north African region corresponds to early morning, which has been identified in several studies (Fiedler et al., 2013; Ryder et al., 2015) as the time of day when the nocturnal low-level jet breakdown causes large amounts of dust emission in this region. Thus, we suspect that this 06:00 LT peak in maximum aerosol extinctions may be the signal resulting from the low-level jet ejection mechanism captured on a regional scale. As the day progresses into the afternoon and early evening, we find the aerosol heights shifting upwards, likely related to the boundary layer's mixed layer development.
For the Middle Eastern region, for the JJASON season, a daily maximum in aerosol extinction of ∼0.15 km−1 is found at midnight (00:00 LT), with a daily minimum of ∼0.08 km−1 found at local noon (12:00 LT), for the peak aerosol extinction layer that has a daily mean aerosol extinction of ∼0.12 km−1. This translates to a %–30 % daily variation for aerosol extinction for the peak aerosol extinction layer. Smaller daily variation in aerosol extinction, however, is found for the same region for the DJFMAM season.
For the India region, for the JJASON season, a large peak in aerosol extinction of up to 10 % higher than daily mean is found at 06:00 LT below 500 m. The minimum aerosol extinction is found at 12:00/18:00 LT for the layer below 500 m and is overall ∼10 % lower than the peak daily mean aerosol extinction value. For the DJFMAM season, minimum aerosol extinctions are found at 12:00 LT for near the whole 0–2 km column, while for the layer below 500 m, the maximum aerosol extinction values are found at midnight (00:00 LT).
For the northeast China region, a significant peak is found at the 500 m–1 km layer for local afternoon (18:00 LT) for the DJFMAM season. A similar feature is also found for the JJASON season, while the peak extinction for the JJASON season happens at 06:00 LT for the aerosol layer below 500 m. Lastly, for the south African region, biomass burning aerosols are prevalent during the summertime, and thus only the JJASON season is analyzed. As shown in Fig. 13b, below 500 m in altitude, lower extinction values are found for local afternoon (18:00 LT) and higher extinction values are found for local morning or early morning (00:00 and 06:00 LT).
Using CALIOP, MODIS and AERONET data, we evaluated CATS-derived AODs as well as vertical distributions of aerosol extinctions for the study period of March 2015–October 2017. CATS data (at 1064 nm) were further used to study variations in AODs and aerosol vertical distributions diurnally. We found the following:
-
Quality-assurance steps are critical for applying CATS data in aerosol-related applications. With a less than 2 % data loss due to QA steps, an improvement in correlation from 0.51 to 0.65 is found for the collocated CATS and AERONET AOD comparisons. Using quality-assured CATS data, reasonable agreement is found between CATS-derived AODs and AODs from CALIOP, MODIS Aqua DT and MODIS Terra DT at the same local times, with correlations of 0.74, 0.74 and 0.72, respectively.
-
While the averaged vertical distributions from CATS compare reasonably well with that from CALIOP, differences in peak extinction altitudes are present. This may due to sampling difference as well as algorithm and instrument differences such as different lidar ratios used.
-
From the global mean perspective, minor changes are found for AODs at four selected times, namely 00:00, 06:00, 12:00 and 18:00 UTC. Yet, noticeable diurnal variations in AODs of above 0.10 (at 1064 nm) are found for regions with extensive aerosol events, such as over north Africa, the Middle East and India for the DJFMAM season, and over north and south Africa, India and the Middle East for the JJASON season.
-
From the global mean perspective, changes are less noticeable for the averaged aerosol extinction profiles at 00:00, 06:00, 12:00 and 18:00 UTC. Yet, if the study is repeated with respect to local time, a peak in aerosol extinction is found for local noon (12:00 LT) for the DJFMAM season and the minimum value in aerosol extinction is found at 18:00 LT for both the JJASON and DJFMAM seasons. While the over-water aerosol vertical distributions are similar to the global means, for over-land cases, the minimum and maximum extinctions are found at local noon (12:00 LT) and local morning or early morning (06:00 and 00:00 LT) for the layer below 500 m for both seasons.
-
Larger diurnal variations are found in regions with heavy aerosol plumes such as north and south (summer season only) Africa, the Middle East, India and eastern China. In particular, aerosol extinctions from 06:00 LT over north Africa are ∼10 % higher than daily means for the 0–500 m column for both seasons. We suspect this may be related to an increase in dust concentrations due to the breakdown of low-level jets in the early morning for the region.
-
Still, readers should be aware that AOD retrievals at the 1064 nm are less sensitive to fine-mode aerosols such as smoke and pollutant aerosols compared to coarse-mode aerosols such as dust aerosols (e.g., Dubovik et al., 2000). Thus, an investigation of diurnal variations of aerosol properties at the visible channel may be also needed for a future study.
This paper suggests that strong regional diurnal variations exist for both AOD and aerosol extinction profiles. Still, at present, these conclusions are tentative and will remain so until a comprehensive analysis of the CATS calibration accuracy and stability is completed. These results demonstrate the need for global aerosol measurements throughout the entire diurnal cycle to improve visibility and particulate matter forecasts as well as studies focused on aerosol climate applications.
All data used in this study are publicly available. The CATS (https://doi.org/10.5067/iss/cats/l2o_d-m7.2-v3-00_05kmpro and https://doi.org/10.5067/iss/cats/l2o_n-m7.2-v3-00_05kmpro; Mcgill, 2016) and CALIOP (https://doi.org/10.5067/caliop/calipso/lid_l2_05kmapro-standard-v4-10; Winker, 2016) aerosol products were obtained from the NASA Langley Research Center Atmospheric Science Data Center. Terra and Aqua MODIS level-2 aerosol products were obtained from the NASA Goddard Space Flight Center's MODIS Adaptive Processing System (MODAPS) site (https://doi.org/10.5067/MODIS/MYD04_L2.061 and https://doi.org/10.5067/MODIS/MOD04_L2.061; Levy et al., 2017). The AERONET data were downloaded from the NASA AERONET website (https://aeronet.gsfc.nasa.gov/new_web/data_usage.html, last access: 29 September 2019).
JZ, JSR and LL designed the study. LL worked on data processing for the project. JEY guided LL on data processing. The manuscript was written with inputs from all coauthors.
The authors declare that they have no conflict of interest.
This article is part of the special issue “Holistic Analysis of Aerosol in Littoral Environments – A Multidisciplinary University Research Initiative (ACP/AMT inter-journal SI)”. It is not associated with a conference.
We thank the NASA AERONET team for the AERONET data used in this study. CATS and CALIOP data were obtained from the NASA Langley Research Center Atmospheric Science Data Center. MODIS aerosol products were obtained from the NASA Goddard Space Flight Center’s MODAPS site. We thank Mark Vaughan and two other anonymous reviewers for their constructive suggestions and comments.
This research has been supported by the ONR (grant no. N00014-16-1-2040), NASA (grant no. NNX17AG52G), NASA NESSF (grant no. NNX16A066H) and the Office of Naval Research (codes 322 and 33).
This paper was edited by S. D. Miller and reviewed by Mark Vaughan and two anonymous referees.
Aerosol Product Application Team of the AWG Aerosols/Air Quality/Atmospheric Chemistry Team: GOES-R Advanced Baseline Imager (ABI) algorithm theoretical basis document for suspended matter/aerosol optical depth and aerosol size parameter, NOAA/NESDIS/STAR July 2012, available at: https://www.star.nesdis.noaa.gov/goesr/docs/ATBD/AOD.pdf, last access: 17 November, 2018.
Alfaro-Contreras, R., Zhang, J., Campbell, J. R., and Reid, J. S.: Investigating the frequency and interannual variability in global above-cloud aerosol characteristics with CALIOP and OMI, Atmos. Chem. Phys., 16, 47–69, https://doi.org/10.5194/acp-16-47-2016, 2016.
Campbell, J. R., Tackett, J. L., Reid, J. S., Zhang, J., Curtis, C. A., Hyer, E. J., Sessions, W. R., Westphal, D. L., Prospero, J. M., Welton, E. J., Omar, A. H., Vaughan, M. A., and Winker, D. M.: Evaluating nighttime CALIOP 0.532 μm aerosol optical depth and extinction coefficient retrievals, Atmos. Meas. Tech., 5, 2143–2160, https://doi.org/10.5194/amt-5-2143-2012, 2012.
CATS Algorithm Theoretical Basis Document, available at: https://cats.gsfc.nasa.gov/media/docs/CATS_ATBD_V1-02.pdf (last access: 28 March 2019), 2016.
Christopher, S. A. and Zhang, J.: Daytime variation of shortwave direct radiative forcing of biomass burning aerosols from GOES 8 imager, J. Atmos. Sci., 59, 681–691, 2002.
Dubovik, O., Smirnov, A., Holben, B. N., King, M. D., Kaufman, Y. J., Eck, T. F., and Slutsker, I.: Accuracy Assessments of Aerosol Optical Properties Retrieved from Aerosol Robotic Network (AERONET) Sun and Sky Radiance Measurements, J. Geophys. Res.-Atmos., 105, 9791–9806, https://doi.org/10.1029/2000JD900040, 2000.
Eck, T. F., Holben, B. N., Reid, J. S., Mukelabai, M. M., Piketh, S. J., Torres, O., Jethva, H. T., Hyer, E. J., Ward, D. E., Dubovik, O., and Sinyuk, A.: A seasonal trend of single scattering albedo in southern African biomass-burning particles: Implications for satellite products and estimates of emissions for the world's largest biomass-burning source, J. Geophys. Res.-Atmos., 118, 6414–6432, 2013.
Fiedler, S., Schepanski, K., Heinold, B., Knippertz, P., and Tegen, I.: Climatology of nocturnal low-level jets over North Africa and implications for modeling mineral dust emission, J. Geophys. Res.-Atmos., 118, 6100–6121, https://doi.org/10.1002/jgrd.50394, 2013.
Giglio, L., Kendall, J. D., and Mack, R.: A multi-year active fire dataset for the tropics derived from the TRMM VIRS, Int. J. Remote Sens., 24, 4505–4525, 2003.
Giles, D. M., Sinyuk, A., Sorokin, M. G., Schafer, J. S., Smirnov, A., Slutsker, I., Eck, T. F., Holben, B. N., Lewis, J. R., Campbell, J. R., Welton, E. J., Korkin, S. V., and Lyapustin, A. I.: Advancements in the Aerosol Robotic Network (AERONET) Version 3 database – automated near-real-time quality control algorithm with improved cloud screening for Sun photometer aerosol optical depth (AOD) measurements, Atmos. Meas. Tech., 12, 169–209, https://doi.org/10.5194/amt-12-169-2019, 2019.
Heinold, B., Knippertz, P., Marsham, J. H., Fiedler, S., Dixon, N. S., Schepanski, K., Laurent, B., and Tegen, I.: The role of deep convection and nocturnal low-level jets for dust emission in summertime West Africa: Estimates from convection-permitting simulations, J. Geophys. Res.-Atmos., 118, 4385–4400, https://doi.org/10.1002/jgrd.50402, 2013.
Holben, B. N., Eck, T. F., Slutsker, I., Tanré, D. , Buis, J. P., Setzer, A., Vermote, E., Reagan, J. A., Kaufman, Y. J., Nakajima, T., Lavenu, F., Jankowiak, I., and Smirnov, A.: AERONET – A Federated Instrument Network and Data Archive for Aerosol Characterization, Remote Sens. Environ., 66, 1–16, https://doi.org/10.1016/S0034-4257(98)00031-5, 1998.
Hyer, E. J., Reid, J. S., Prins, E. M., Hoffman, J. P., Schmidt, C. C., Miettinen, J. I., and Giglio, L.: Different views of fire activity over Indonesia and Malaysia from polar and geostationary satellite observations, Atmos. Res., 122, 504–519, 2013.
Kaku, K. C., Reid, J. S., Hand, J. L., Edgerton, E. S., Holben, B. N., Zhang, J., and Holz, R. E.: Assessing the challenges of surface-level aerosol mass estimates from remote sensing during the SEAC4RS campaign: Baseline surface observations and remote sensing in the Southeastern United States, J. Geophys. Res., 123, 7530–7562, https://doi.org/10.1029/2017JD028074, 2018.
Levy, R. C., Mattoo, S., Munchak, L. A., Remer, L. A., Sayer, A. M., Patadia, F., and Hsu, N. C.: The Collection 6 MODIS aerosol products over land and ocean, Atmos. Meas. Tech., 6, 2989–3034, https://doi.org/10.5194/amt-6-2989-2013, 2013.
Levy, R., Hsu, C., et al.: MODIS Atmosphere L2 Aerosol Product, NASA MODIS Adaptive Processing System, Goddard Space Flight Center, USA: https://doi.org/10.5067/MODIS/MOD04_L2.061, 2017.
Liu, Z., Vaughan, M., Winker, D., Kittaka, C., Getzewich, B., Kuehn, R., Omar, A., Powell, K., Trepte, C., and Hostetler, C.: The CALIPSO Lidar Cloud and Aerosol Discrimination: Version 2 Algorithm and Initial Assessment of Performance, J. Atmos. Ocean. Tech., 26, 1198–1213, 2009.
Lynch, P., Reid, J. S., Westphal, D. L., Zhang, J., Hogan, T. F., Hyer, E. J., Curtis, C. A., Hegg, D. A., Shi, Y., Campbell, J. R., Rubin, J. I., Sessions, W. R., Turk, F. J., and Walker, A. L.: An 11-year global gridded aerosol optical thickness reanalysis (v1.0) for atmospheric and climate sciences, Geosci. Model Dev., 9, 1489–1522, https://doi.org/10.5194/gmd-9-1489-2016, 2016.
Mbourou, G. N., Berand, J. J., and Nicholson, S. E.: The diurnal and seasonal cycle of wind-borne dust over Africa north of the equator, J. Appl. Meteor., 36, 868–882, 1997.
McGill, M. J., Yorks, J. E., Scott, V. S., Kupchock, A. W., and Selmer, P. A.: The Cloud-Aerosol Transport System (CATS): A technology demonstration on the International Space Station, Proc. SPIE, 9612, 96120A, https://doi.org/10.1117/12.2190841, 2015.
McGill, M.: CATS/ISS L2O D-M7.2 Version 3-00 05kmPro and CATS-ISS Level 2O N-M7.2 Version 3-00 05kmPro files, NASA Langley Research Center Atmospheric Science Data Center DAAC, https://doi.org/10.5067/iss/cats/l2o_d-m7.2-v3-00_05kmpro; https://doi.org/10.5067/iss/cats/l2o_n-m7.2-v3-00_05kmpro, 2016.
Noel, V., Chepfer, H., Chiriaco, M., and Yorks, J.: The diurnal cycle of cloud profiles over land and ocean between 51∘ S and 51∘ N, seen by the CATS spaceborne lidar from the International Space Station, Atmos. Chem. Phys., 18, 9457–9473, https://doi.org/10.5194/acp-18-9457-2018, 2018.
Omar, A. H., Winker, D. M., Tackett, J. L., Giles, D. M., Kar, J., Liu, Z., Vaughan, M. A., Powell, K. A., and Trepte C. R.: CALIOP and AERONET aerosol optical depth comparisons: One size fits none, J. Geophys. Res.-Atmos., 118, 4748–4766, https://doi.org/10.1002/jgrd.50330, 2013.
Pauly, R. M., Yorks, J. E., Hlavka, D. L., McGill, M. J., Amiridis, V., Palm, S. P., Rodier, S. D., Vaughan, M. A., Selmer, P. A., Kupchock, A. W., Baars, H., and Gialitaki, A.: Cloud Aerosol Transport System (CATS) 1064 nm Calibration and Validation, Atmos. Meas. Tech. Discuss., https://doi.org/10.5194/amt-2019-172, in review, 2019.
Rajapakshe, C., Zhang, Z., Yorks, J. E., Yu, H., Tan, Q., Meyer, K., and Platnick, S.: Seasonally Transported Aerosol Layers over Southeast Atlantic are Closer to Underlying Clouds than Previously Reported, Geophys. Res. Lett., 44, 5818–5825, https://doi.org/10.1002/2017GL073559, 2017.
Redemann, J., Vaughan, M. A., Zhang, Q., Shinozuka, Y., Russell, P. B., Livingston, J. M., Kacenelenbogen, M., and Remer, L. A.: The comparison of MODIS-Aqua (C5) and CALIOP (V2 & V3) aerosol optical depth, Atmos. Chem. Phys., 12, 3025–3043, https://doi.org/10.5194/acp-12-3025-2012, 2012.
Reid, J. S., Eck, T. F., Christopher, S. A., Hobbs, P. V., and Holben B. R.: Use of the Angstrom exponent to estimate the variability of optical and physical properties of aging smoke particles in Brazil, J. Geophys. Res., 104, 27489–27489, 1999.
Remer, L. A., Kaufman, Y. J., Tanré, D., Mattoo, S., Chu, D. A., Martins, J. V., Li, R., Ichoku, C., Levy, R. C., Kleidman, R. G., Eck, T. F., Vermote, E., and Holben, B. N.: The MODIS Aerosol Algorithm, Products, and Validation, J. Atmos. Sci., 62, 947–973, https://doi.org/10.1175/JAS3385.1, 2005.
Remer, L. A., Kleidman, R. G., Levy, R. C., Kaufman, Y. J., Tanre, D., Mattoo, S., Martins, J. V., Ichoku, C., Koren, I., Yu, H., and Holben, B. N.: Global aerosol climatology from the MODIS satellite sensors, J. Geophys. Res., 113, D14S07, https://doi.org/10.1029/2007JD009661, 2008.
Ryder, C. L., McQuaid, J. B., Flamant, C., Rosenberg, P. D., Washington, R., Brindley, H. E., Highwood, E. J., Marsham, J. H., Parker, D. J., Todd, M. C., Banks, J. R., Brooke, J. K., Engelstaedter, S., Estelles, V., Formenti, P., Garcia-Carreras, L., Kocha, C., Marenco, F., Sodemann, H., Allen, C. J. T., Bourdon, A., Bart, M., Cavazos-Guerra, C., Chevaillier, S., Crosier, J., Darbyshire, E., Dean, A. R., Dorsey, J. R., Kent, J., O'Sullivan, D., Schepanski, K., Szpek, K., Trembath, J., and Woolley, A.: Advances in understanding mineral dust and boundary layer processes over the Sahara from Fennec aircraft observations, Atmos. Chem. Phys., 15, 8479–8520, https://doi.org/10.5194/acp-15-8479-2015, 2015.
Shi, Y., Zhang, J., Reid, J. S., Hyer, E. J., Eck, T. F., Holben, B. N., and Kahn, R. A.: A critical examination of spatial biases between MODIS and MISR aerosol products – application for potential AERONET deployment, Atmos. Meas. Tech., 4, 2823–2836, https://doi.org/10.5194/amt-4-2823-2011, 2011.
Shi, Y., Zhang, J., Reid, J. S., Hyer, E. J., and Hsu, N. C.: Critical evaluation of the MODIS Deep Blue aerosol optical depth product for data assimilation over North Africa, Atmos. Meas. Tech., 6, 949–969, https://doi.org/10.5194/amt-6-949-2013, 2013.
Stephens, G. L., Vane, D. G., Boain, R. J., Mace, G. G., Sassen, K., Wang, Z., Illingworth, A. J., O'connor, E. J., Rossow, W. B., Durden, S. L., Miller, S. D., Austin, R. T., Benedetti, A., Mitrescu, C. and the CloudSat Science Team: The CLOUDSAT mission and the A-TRAIN, B. Am. Meteorol. Soc., 83, 1771–1790, https://doi.org/10.1175/BAMS-83-12-1771, 2002.
Tackett, J. L., Winker, D. M., Getzewich, B. J., Vaughan, M. A., Young, S. A., and Kar, J.: CALIPSO lidar level 3 aerosol profile product: version 3 algorithm design, Atmos. Meas. Tech., 11, 4129–4152, https://doi.org/10.5194/amt-11-4129-2018, 2018.
Tiwari, S., Srivastava, A. K., Bisht, D. S., Parmita, P., Srivastava, M. K., and Atri, S. D.: Diurnal and seasonal variations of black carbon and PM2.5 over New Delhi, India: Influence of meteorology, Atmos. Res., 125, 50–62, https://doi.org/10.1016/j.atmosres.2013.01.011, 2013.
Toth, T. D., Zhang, J., Campbell, J. R., Reid, J. S., and Vaughan, M. A.: Temporal variability of aerosol optical thickness vertical distribution observed from CALIOP, J. Geophys. Res.-Atmos., 121, 9117–9139, https://doi.org/10.1002/2015JD024668, 2016.
Toth, T. D., Campbell, J. R., Reid, J. S., Tackett, J. L., Vaughan, M. A., Zhang, J., and Marquis, J. W.: Minimum aerosol layer detection sensitivities and their subsequent impacts on aerosol optical thickness retrievals in CALIPSO level 2 data products, Atmos. Meas. Tech., 11, 499–514, https://doi.org/10.5194/amt-11-499-2018, 2018.
Vaughan, M., Garnier, A., Josset, D., Avery, M., Lee, K.-P., Liu, Z., Hunt, W., Pelon, J., Hu, Y., Burton, S., Hair, J., Tackett, J. L., Getzewich, B., Kar, J., and Rodier, S.: CALIPSO lidar calibration at 1064 nm: version 4 algorithm, Atmos. Meas. Tech., 12, 51–82, https://doi.org/10.5194/amt-12-51-2019, 2019.
Wang, J., Liu, X., Christopher, S. A., Reid, J. S., Reid, E. A., and Maring, H.: The effects of non-sphericity on geostationary satellite retrievals of dust aerosols, Geophys. Res. Lett., 30, 2293, https://doi.org/10.1029/2003GL018697, 2003.
Winker, D. M., Vaughan, M. A., Omar, A., Hu, Y., Powell, K. A., Liu, Z., Hunt, W. H., and Young, S. A.: Overview of the CALIPSO Mission and CALIOP Data Processing Algorithms, J. Atmos. Ocean. Tech., 26, 2310–2323, https://doi.org/10.1175/2009JTECHA1281.1, 2009.
Winker, D.: CALIPSO LID L2 Standard HDF File – Version 4.10 [LID_L2_05kmAPro-Standard], NASA Langley Research Center Atmospheric Science Data Center DAAC, https://doi.org/10.5067/caliop/calipso/lid_l2_05kmapro-standard-v4-10, 2016.
Yorks, J. E., McGill, M. J., Palm, S. P., Hlavka, D. L., Selmer, P. A., Nowottnick, E., Vaughan, M. A., Rodier, S., and Hart W. D.: An Overview of the CATS Level 1 Data Products and Processing Algorithms, Geophys. Res. Lett., 43, 4632–4639, https://doi.org/10.1002/2016GL068006, 2016.
Yoshida, M., Kikuchi, M., Nagao, T. M., Murakami, H., Nomaki, T., and Higurashi, A.: Common Retrieval of Aerosol Properties for Imaging Satellite Sensors, J. Meteorol. Soc. Jpn. II, 96, 193–209, https://doi.org/10.2151/jmsj.2018-039, 2018.
Young, S. A., Vaughan, M. A., Kuehn, R. E., and Winker, D. M.: The Retrieval of Profiles of Particulate Extinction from Cloud-Aerosol Lidar Infrared Pathfinder Satellite Observations (CALIPSO) Data: Uncertainty and Error Sensitivity Analyses, J. Atmos. Ocean. Tech., 30, 395–428, https://doi.org/10.1175/JTECH-D-12-00046.1, 2013.
Zhao, X. J., Zhang, X. L., Xu, X. F., Xu, J., Meng, W., and Pu, W. W.: Seasonal and diurnal variation of ambient PM2.5 concentrations in urban and rural environments in Beijing, Atmos. Environ., 43, 2893–2900, https://doi.org/10.1016/j.atmosenv.2009.03.009, 2009.


