the Creative Commons Attribution 4.0 License.
the Creative Commons Attribution 4.0 License.
Observing ice particle growth along fall streaks in mixed-phase clouds using spectral polarimetric radar data
Lukas Pfitzenmaier
Christine M. H. Unal
Yann Dufournet
Herman W. J. Russchenberg
The growth of ice crystals in presence of supercooled liquid droplets represents the most important process for precipitation formation in the mid-latitudes. However, such mixed-phase interaction processes remain relatively unknown, as capturing the complexity in cloud dynamics and microphysical variabilities turns to be a real observational challenge. Ground-based radar systems equipped with fully polarimetric and Doppler capabilities in high temporal and spatial resolutions such as the S-band transportable atmospheric radar (TARA) are best suited to observe mixed-phase growth processes. In this paper, measurements are taken with the TARA radar during the ACCEPT campaign (analysis of the composition of clouds with extended polarization techniques). Besides the common radar observables, the 3-D wind field is also retrieved due to TARA unique three beam configuration. The novelty of this paper is to combine all these observations with a particle evolution detection algorithm based on a new fall streak retrieval technique in order to study ice particle growth within complex precipitating mixed-phased cloud systems. In the presented cases, three different growth processes of ice crystals, plate-like crystals, and needles are detected and related to the presence of supercooled liquid water. Moreover, TARA observed signatures are assessed with co-located measurements obtained from a cloud radar and radiosondes. This paper shows that it is possible to observe ice particle growth processes within complex systems taking advantage of adequate technology and state of the art retrieval algorithms. A significant improvement is made towards a conclusive interpretation of ice particle growth processes and their contribution to rain production using fall streak rearranged radar data.
- Article
(6979 KB) - Full-text XML
- BibTeX
- EndNote
The interaction of liquid water droplets and ice crystals leads to an enhanced growth of the ice crystals while falling through layers of supercooled liquid water. In the mid-latitudes, this is an important process for precipitation formation (Pruppacher and Klett, 1996; Lamb and Verlinde, 2011). Nevertheless, the implications of the microphysical processes on precipitation formation are currently not well understood. Such microphysical processes involve a variety of hydrometeor sizes, shapes, phases, all affected by cloud dynamics, making the observation particularly challenging (Kollias et al., 2007; Shupe et al., 2008). Nowadays, ground-based radar measurement techniques have the advanced capabilities to observe and study microphysical processes within mixed-phase cloud systems (Kollias et al., 2007). Analyses of ice particle growth processes within mixed-phase cloud systems are primarily based on cloud radar data. Among them, Oue et al. (2016) uses polarimetric radar (Ka-, and X-band) and lidar measurements to study ice particle growth processes in the cloud. Kalesse et al. (2016) analyzes Doppler spectra (Ka-band) during a riming event and compare their findings of particle growth rates from the observations to simulations of such a riming event. Data from the same measurement campaign are used by Kneifel et al. (2015), where they apply a radar triple frequency method (W-, Ka-, and X-band) to distinguish between different ice hydrometeor types (aggregates, rimed particles) and their particle size distribution characteristics during snowfall events. Myagkov et al. (2016) uses polarimetric radar measurements (Ka-band) to derive the shape and orientation of mainly pristine ice particles generated at liquid topped mixed phase clouds.
In the studies mentioned above, the focus is on stratiform and layered clouds (dynamically stable and homogeneous) in the Arctic region or on snowfall events that do not involve any phase transition (ice particles constantly remain in the ice phase). Studies of precipitating mixed-phase cloud systems where melting of the ice particles is involved are rare. However, to understand the whole precipitation formation process the growth of the ice particles and the associated microphysical processes above the melting layer have to be studied to be related to the precipitation intensity below the melting layer. Nevertheless, the frequency bands listed in the studies above (W-, Ka-, and X-band) suffer from attenuation when it comes to observations of precipitation cloud systems, Kollias et al. (2007). To avoid attenuation in precipitation, radars that operate in lower radar frequencies (C- and S-band) can be used. In the past, low-frequency radars were mainly used to estimate precipitation (Bringi and Chandrasekar, 2001) and to classify hydrometeor types (Straka et al., 2000; Chandrasekar et al., 2013). However, in the last few years, the polarimetric capabilities of those radars were also used to study ice particle microphysics and growth processes in cloud systems during snowfall events or in the ice part of the cloud above the melting (Kennedy and Rutledge, 2011; Bechini et al., 2013; Moisseev et al., 2015). Microphysical studies of ice crystal habits using a S-band radar were first done by Bader et al. (1987). They compared differential reflectivity, ZDR, signatures from the radar with aircraft measurements of ice crystal habits of precipitating stratiform clouds. It was found that the enhanced bands of ZDR values occur where the aircraft measurements detected defined pristine ice particle shapes. Later it was found that a combination of ZDR and specific differential propagation phase, KDP, can be used to identify regions of plate-like particle growth processes and onset of aggregation (Kennedy and Rutledge, 2011; Moisseev et al., 2015). Andrić et al. (2013) modeled polarimetric signatures for a winter storm case. The related simulations showed agreements with the observations; nevertheless, the model was not able to match all the features of the observations in a single run.
Low-frequency radar observation of the ice particle growth process due to the interaction of the ice crystals with supercooled liquid droplets is also found in the literature. Field et al. (2004) compared the observed ZDR signatures (S-band) to the obtained ice to liquid particle fraction measured with an aircraft and found a good agreement between liquid water presence and ZDR signatures that were caused by defined ice crystal shapes. Similar findings have also been made by Hogan et al. (2002). Hogan et al. (2002) showed that small convective cells embedded in warm frontal mixed-phase cloud systems triggered ice particle formation, growth, and multiplication related to supercooled liquid water. Chandrasekar et al. (2013) discussed spectrograms measured with a C-band radar that exhibit signatures of aggregation and riming of ice particles. This shows that precipitation radar can capture particle growth in spectral domain and their related microphysics. Keat and Westbrook (2017) used ZDR signatures and co-polar correlation coefficient measurements within mixed phase clouds to separate the signals of pristine ice crystals and aggregates. Their results are validated against aircraft and Ka-band radar observations.
In this work, radar data measured during the ACCEPT campaign are presented. They are obtained with TARA, which is a fully polarimetric S-band Doppler radar profiler providing measurements in high temporal and spatial resolutions. Because of TARA's unique three beam configuration, the full 3-D wind vector per sampling volume is also retrieved for each measurement. Therefore, using this radar and its configuration, it is possible to identify and study microphysical processes of ice particles within complex mixed-phase clouds. On top of that, TARA measurements are rearranged along fall streaks according to the recently developed fall streak retrieval algorithm (Pfitzenmaier et al., 2017). Fall streaks are considered to be the precipitating path of a population of particles from top to bottom of the cloud system. Therefore, the analyses of microphysical changes along the fall streaks contain information of microphysical evolution of the same particle population (Pfitzenmaier et al., 2017; Kalesse et al., 2016). The retrieval technique reconstructs the precipitation path based on the obtained TARA wind information. In a next step, Doppler spectra and polarimetric radar variables rearranged along those fall streaks are used to study the microphysical evolution of a particle population. This paper demonstrates the advantage of analyzing data along fall streak instead of vertical profiles of radar data. Rearranged spectrograms of polarimetric variables allow to understand how the ice particle size and shape distribution changes versus height. This is used to improve the understanding of the impact of supercooled liquid water on ice particle growth within a cloud system. Furthermore, the spectral signatures are compared to additional measurements performed during the ACCEPT campaign (Ka-band cloud radar spectral information and radiosonde temperature profiles) to assess the results from TARA data. After introducing the observation strategy of the ACCEPT campaign, in Sect. 2, some examples of microphysical observations of ice particle growth processes and their spectral signatures are given in Sects. 3 and 4. An overview of the fall streak technique is given in Sect. 5. Section 6 finally combines the retrieved microphysical information with fall streak correction to interpret growth processes of three different cases. Discussions and conclusions are provided in Sect. 7.

Figure 1Measurement setup of the ACCEPT campaign at CESAR. The arrows point on the TARA radar (radar on the left), the disdrometer that is mounted on the LACROS container, and the vertical pointing Mira cloud radar (35 GHz). Complementary instruments of ACCEPT are listed but not visible on this photo.
2.1 Instrumental setup of the ACCEPT campaign
The aim of the ACCEPT campaign (analysis of the composition of clouds with extended polarization techniques) is achieving a better understanding of microphysical processes involved in mixed-phase clouds using high-resolution polarimetric observations. The measurements were performed from October to mid-November 2014 at the Cabauw Experimental Site for Atmospheric Research (CESAR), the Netherlands. An instrumental synergy was used during ACCEPT to detect the different phases, the variety of sizes and shapes of the involved hydrometeors. For this purpose the TARA radar (Heijnen et al., 2000) at the site was extended by several other sensors: the Leipzig Aerosol and Cloud Remote Observation System (LACROS) (Bühl et al., 2013), a second vertically pointing Ka-band cloud radar Mira (Görsdorf et al., 2015), and the Raman Lidars PollyXT (Engelmann et al., 2016; Baars et al., 2016) and CAELI (CESAR Water Vapor, Aerosol and Cloud Lidar) (Apituley et al., 2009). A picture of the setup is provided in Fig. 1. During special observation periods, radiosondes were launched at the site.
Some results of the ACCEPT campaign are already published. Myagkov et al. (2016) developed a retrieval to obtain the shapes of new generated ice crystals at liquid topped single layer mixed-phase clouds and compared their results to laboratory studies. Good agreement was obtained. Pfitzenmaier et al. (2017) developed a retrieval algorithm to reconstruct fall streaks within the TARA measurements to improve the study of ice particle growth due to supercooled liquid water presence within the cloud system.
(Unal and Moisseev, 2004)2.2 The transportable atmospheric radar – TARA
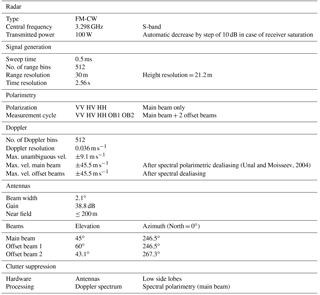
TARA is a frequency modulated continuous wave (FM-CW) S-band radar profiler (3.3 GHz) that has full polarimetric and Doppler capabilities. TARA is able to provide high-resolution column measurements in the Doppler domain (0.03 m s−1), in range (30.0 m, max. height of 10.05 km) as well as high temporal resolution (2.56 s). Measurements are performed under a fixed antenna elevation (45∘) and a fixed azimuth (246.5∘ related to the North). Measurements at 45∘ elevation are considered as an optimum to get polarimetric and Doppler spectra information related to microphysical properties of the probed medium (Moisseev et al., 2004; Unal et al., 2012). Therefore, TARA does not only allow the analysis of polarimetric bulk parameters as differential reflectivity, ZDR, and co-polar correlation coefficient, ρHV, but it is also possible to study changes in the signatures of Doppler spectra, sZ (sZhh), and spectral differential reflectivity, sZDR (sZDR being the ratio of horizontal polarized to vertical polarized spectral reflectivity, sZhh∕sZvv). These changes in the spectra and spectrogram (height profiles of spectra) can be related to cloud microphysical variations. Therefore, it is possible to identify separate particle modes (having different velocity ranges) in the sZ and sZDR spectra. Furthermore, the unique three beam configuration of TARA allows for the retrieval of the full 3-D wind vector per measurement. Using the Doppler spectra information of the three beams, main beam and two offset beams, the horizontal wind velocity vdh, the vertical Doppler velocity vdV, and the wind direction ϕW are retrieved with a minimal temporal resolution of 2.56 s (Unal et al., 2012). The combination of all these measurements makes it possible to study ice particle growth within such complex precipitating mixed-phase cloud systems. Table 1 gives an overview of the specifications of TARA during ACCEPT.
2.3 Instrumental synergy
In addition to the TARA radar, other co-located sensors measured in parallel, allowing full comparison of the observed data signatures for similar volumes of study. In this paper, measurements of the Mira and TARA radars are compared, and data from two radiosonde launches are used. Unlike TARA, the data of high-frequency Mira type radar systems, suffer from attenuation and non-Rayleight effects during precipitation events. Low-frequency radar systems with high spatial and temporal resolution like the TARA radar have advantages measuring precipitation cloud systems. Nevertheless, the Ka-band radar is more sensitive to the smaller pristine ice particles near cloud top. Therefore, it can detect particles in far ranges where TARA, operating at a low-frequency, is not able to measure these small particles. Despite of the attenuation and other effects the detected cloud top with Mira for the discussed case is at least 0.5 km higher than the one identified with TARA. TARA and the vertical pointing Mira obtain linear depolarization ratio in the spectral domain (sLDR) at high temporal resolution (1 s for Mira). This parameter, which is the ratio of sZvh, cross-polar received spectral reflectivity, to sZhh, is not affected by attenuation issues at vertical incidence. Therefore, comparisons between the observed spectral polarimetric signatures from TARA and Mira can be done. These spectral polarimetric measurements are used in combination with thermodynamical conditions (temperature and humidity) within the cloud system, measured from radiosonde launches. On the one hand, radiosondes can retrieve regions of supercooled liquid water within precipitating cloud systems when other methods or sensors are limited. On the other hand, the temperature profiles in supercooled liquid layer and the polarimetric radar signatures can help identifying the dominant ice particle shape affecting the growth process in the mixed-phase area (Bader et al., 1987; Pruppacher and Klett, 1996; Fukuta and Takahashi, 1999; Myagkov et al., 2016).
Ice particles within clouds can grow through three main processes (Pruppacher and Klett, 1996; Lamb and Verlinde, 2011):
-
Riming of ice particles. This occurs when supercooled water droplets collide and freeze onto bigger ice crystals, see Fig. 2a. Ice particles grow into large, dense and almost spherical shaped particles. In terms of conical graupel the resulting particles get slightly prolate (Oue et al., 2015a). Because of the sensitivity of the reflectivity to the hydrometeor size, where N(D) is the hydrometeor size distribution and D is the equivolumetric diameter, the growth of particles is strongly connected to an increase of reflectivity. The differential reflectivity ZDR gives information on the shape of the measured particle population (positive = oblate, ≈0 dB spherical, and negative = prolate particle shape). The conceptual change in particle shapes is indicated by the dotted lines in Fig. 2. Thus, riming processes affect ZDR values by turning oblate ice particle (ZDR>0) into near spherical (ZDR around 0) or in case of conical graupel in slightly prolate particles (ZDR<0).
-
Water vapor diffusional growth of ice particles. This occurs when water vapor diffuses towards the crystals from the gas-phase, see Fig. 2b. During that process particles grow, therefore the reflectivity increases. During the diffusional growth particles keep their characteristic shape as long as they stay in the same growth regime, (Fukuta and Takahashi, 1999; Lamb and Verlinde, 2011). Their ZDR values slightly increase during the growth process. If particles grow large enough the crystals start to aggregate which leads to a decrease of polarimetric signature (Pruppacher and Klett, 1996). In our analysis we assume that the polarimetric signal is dominated by particle growth at constant atmospheric conditions and related to the shape of the dominant type of particles.
-
Aggregation of ice particles. This occurs when ice crystals collide and form bigger ice crystals, see Fig. 2c. Aggregation leads to an increase of ice particle size and a change in particle shape from pristine particles to spherical shaped ice particles. The decrease of the differential reflectivity signatures depends strongly on the aggregated pristine particle type. Moisseev et al. (2015) suggested that early aggregates of dendrites align horizontally and therefore can also contribute to a high ZDR-signature. This leads to a less strong decrease of polarimetric signatures of ZDR with increasing size of the grown aggregates. Hobbs et al. (1974) indicated that needles have the tendency to clump very fast into spherical particles if their number concentration is high enough. Therefore, needles that aggregate turn faster into spherical shaped particles than dendrites.
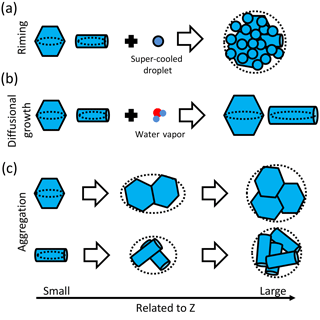
Figure 2Sketch of ice particle growth processes within mixed-phase clouds. In panel (a) riming of ice crystals is depicted. Panel (b) shows the diffusional growth of ice crystals and (c) the aggregation of ice crystals. The hexagonal plates and cylindrical columns represent either plate and dendrite shape or needles and columns, respectively. Size growth is indicated with bigger particles in the sketch. In the measurements an increase in particle size is related to an increase in Z values, indicated by the arrow at the bottom. The particle shapes are indicated by the dotted ellipses (the particles are modeled as spheroids).
The main three ice particle growth processes, riming, diffusional growth and aggregation result in different signatures in the spectral radar observations, see Fig. 3. Identifying the growth process signatures in the Doppler spectrum, sZ, and differential reflectivity spectrum, sZDR, is challenging due to concurrent growth process mechanisms occurring within the same resolution volume on different group of particles. Therefore, the signatures of different processes can be overlaid and difficult to separate. It is pointed out that these sketches are meant to explain spectral signatures of a S-band slantwise profiling radar. Other radar setups may have different spectral signatures.
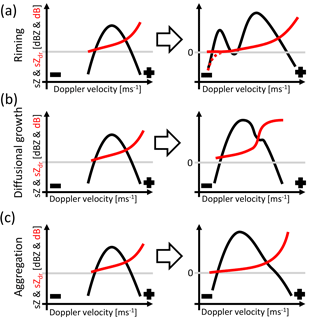
Figure 3Sketch of signature of (a) riming, (b) diffusional growth and aggregation, and (c) aggregation of ice particles and their corresponding changes in the Doppler spectra sZ (black lines) and spectral differential reflectivity sZDR (red lines). All sketches represent theoretical dependencies, the gray line indicates 0 dB for the sZDR values. The Doppler velocity values are relative values (left: minus sign: large negative Doppler velocities; right: plus sign; very small or positive Doppler velocities; negative Doppler velocities indicate movements towards the radar). Conceptional sketches are based on spectral simulations of Spek et al. (2008), Dufournet and Russchenberg (2011), and Oue et al. (2015a).
Figure 3a sketches riming signatures in the Doppler spectrum, sZ (black line), and differential reflectivity spectrum, sZDR (red line). A Doppler spectrum represents the Doppler velocity distribution weighted by particle backscattering. Therefore, sZ is related to the particle size distribution (negative velocities indicate particle movements towards the radar, therefore, larger particles are associated with larger negative velocities), while sZDR is related to the particle shape distribution. In a Doppler spectrum, a separated particle mode of larger and denser ice particles is often a clear indication of a riming process (Kollias et al., 2007; Chandrasekar et al., 2013; Oue et al., 2015a). As described in Fig. 3a they form a separated particle mode in the Doppler spectrum (left side) that indicates larger particles fall velocities in comparison to already existing particle mode. The particles in the mode on the right side are growing. Ice crystals must have a certain size to be effective to rime (Wang and Ji, 2000; Ávila et al., 2009). Due to the fast growth of already large ice crystals the reflectivity values are also quite large in the right riming mode. Because not all ice crystals fulfill this criteria and might grow due to diffusional growth and/or aggregation, in the left mode the reflectivity also increases. Well defined shapes of pristine crystals are mainly responsible of the sZDR-signatures in cloud. Riming of particles leads to a decrease of polarimetric signatures and a decrease of the sZDR values towards zero. In case that riming leads to conical graupel sZDR values become negative (see dotted red line at the left particle mode). In the right mode, a clear shape–size dependence is still expected and the higher sZDR values correspond to the smaller ice crystals that have kept their pristine ice crystal shape. However, riming can also increase the sZDR values. Oue et al. (2015a) showed that initial riming of the branches of dendrites increases the particle bulk density which leads to increased sZDR values.
Figure 3b depicts a signature of diffusional growth and aggregation in sZ and sZDR. The small particle mode on the right side in the Doppler spectrum indicates the diffusional growth of the ice particles. Particles that grow via water vapor diffusion keep their pristine crystal shape and, therefore, the sZDR-values of that mode stay large. A significant feature of the diffusional growth is the separated mode in the sZDR spectrum. Such a mode of defined particle shapes is not present during the aggregation process of particles. However, at a certain stage particles start to aggregate and the Doppler spectrum width increases. The onset of aggregation is seen in the significant decrease of values in the sZDR spectrum, because aggregation leads to more spherical shaped particles.
Figure 3c illustrates an aggregation signature of ice crystals in sZ and sZDR. Due to the domination of the large particles in the signal the spectral reflectivity can be skewed towards bigger particles. Depending on the particle size distribution a separation of the different particle modes is not always possible in the Doppler spectrum. Therefore, the signatures in sZDR are needed to separate the different particle modes in the spectral domain if they are present. Nevertheless, it has to be mentioned that the differential reflectivity is also influenced by the density of the measured particles. Therefore, the strong decrease of sZDR signature due to aggregation onset can be caused also by the lower density of the aggregates, compared to the pristine crystals.
The shown signatures in the spectral domain are used to identify qualitatively particle growth within mixed phase clouds. Using bulk and spectral polarimetric measurements, several cases during a complex precipitation system will be investigated next.
The aim of this study is to analyze the microphysical process of a particle population on its way from cloud top to the bottom of the cloud system. Therefore, radar data are rearranged along so-called fall streaks before their signatures are examined. This offers a new insight on ice growth processes occurring in complex, local, and inhomogeneous cloud conditions in precipitating cloud systems.
Marshall (1953) and Browne (1952) were the first that analyzed fall streak signatures within radar measurements. They investigated the structure and shape of outstanding reflectivity patterns within radar measurements. They described a fall streak like Yuter and Houze (2003), as a manifestation of an inhomogeneity in the microphysical structure of a cloud system. To be observed, the relative size and number of precipitation particles within the fall streak need to be large such that their radar reflectivity stands out as a local maximum from the immediate background reflectivity. Nevertheless, it was already pointed out that the main shape and structure of the fall streaks is influenced by the present cloud dynamics (Marshall, 1953; Browne, 1952). Because of this dynamical influence on the fall streak shape and structure, Pfitzenmaier et al. (2017) defines a fall streak as the path of a particle population obtained from the observation of its own motion. Taking into account the dynamical conditions within the cloud system the fall streak retrieval is based on the mean 3-D wind field retrieved by TARA. Therefore, a mean fall streak is retrieved which is based on radar Doppler measurements only.
Using directly measured 3-D wind information (vertical Doppler velocity vdV, horizontal wind speed vdh, and wind direction ϕW) the fall streak retrieval estimates the time displacement per height to reconstruct the path of a particle population. This is done using a bottom-up approach starting at the lowest (closest to the ground) valid data point at starting time t0. The time displacement at the height z is in principle estimated following Eq. (1). It consists of two terms:
The first term is the displacement time related to the antenna elevation, Δtα. The second term is the displacement time due to the cloud system dynamics, Δtdyn. The calculation of the displacement contributions Δtα and Δtdyn is done following the steps of Pfitzenmaier et al. (2017). The initial condition for the retrieval algorithm (cloud base height and averaging time for the wind profiles) are set individually per case, applying the suggested method in Pfitzenmaier et al. (2017). So, a mean fall streak per particle population is retrieved. Individual fall speeds of different particles within the population are not represented and taken into account and effects like size sorting cannot be analyzed using this method. However, it is possible to analyze particle growth processes along the particle fall streak under the assumption of continuous generation of new particles and microphysical homogeneity in the cloud system. Therefore, the rearranged data are supposed to represent all microphysical processes of the tracked particle population.
The microphysical analyses of the cases are based on fall streak corrected bulk parameter profiles of reflectivity, Z, differential reflectivity, ZDR, and the co-polar correlation coefficient ρHV as well as on the fall streak corrected Doppler spectra, sZ, and spectral differential reflectivity, sZDR. The growth of the measured particle population is indicated by an increase of reflectivity. Changes in the ZDR-signature give information on the shape and density changes of the measured particle population. The co-polar correlation coefficient ρHV gives information about particle homogeneity within the measured volume. The closer ρHV is to 1 the more homogeneous are the particle shapes of the measured particle population. Therefore, changes of those parameters are used to examine the microphysical evolution of the particle population tracked from cloud top to bottom (Pfitzenmaier et al., 2017; Kalesse et al., 2016; Oue et al., 2015a). The analysis of the fall streak corrected spectrograms are used to investigate the changes in the spectra due to microphysical changes of the tracked ice particle distribution. Spectrograms provide Doppler spectra per height bin at each time step (spectral reflectivity versus Doppler velocity and height). Therefore, it is possible to identify the different signatures of riming, aggregation, and diffusional growth of different pristine crystals by analyzing their changes in signature (Fig. 3) from cloud top to bottom.
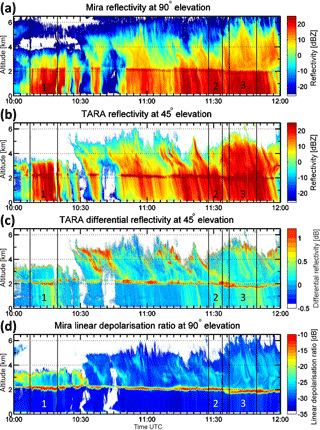
Figure 4Overview of the radar measurements used in this paper. Panels (b, c) show reflectivity and differential reflectivity measurements, obtained with TARA radar (S-band). Panels (a, d) show the reflectivity and linear depolarization ratio measurements from the Mira radar (Ka-band). The boxes 1, 2, and 3 highlight the time frames where fall streaks at 10:12:50, 11:33:31 and 11:47:30 UTC are retrieved and their rearranged data are discussed and analyzed
Due to the variation of small time scale dynamics (horizontal and vertical wind at 45∘ elevation) on the spectra, the signatures are only analyzed qualitatively. Nevertheless, the changes in the Doppler spectra shape (broadening, modality, and amplitude) with height are detailed enough to provide information about the present particle microphysics. To ensure a good data quality the spectra are averaged over 3 time bins (∼8 s) per height (one time bin before and one time bin after the rearranged spectrum are used for the averaging) as well as a 10 dB threshold above the noise level is applied to Doppler bins in the spectra. This removes artifacts at the edges of the spectra due to low SNR. However sZDR values are still noisy. Therefore, the presented and analyzed visible signatures in the spectrograms are also checked manually for consistency over time and height.
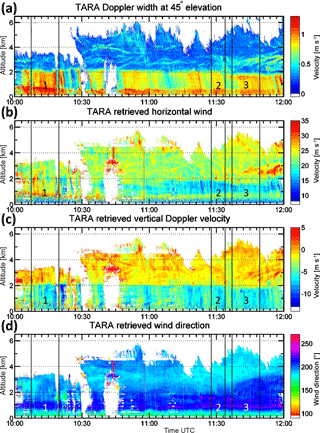
Figure 5Overview of the dynamic variables measured and retrieved by TARA radar (S-band). In panel (a) the Doppler width is displayed, panel (b) shows the retrieved horizontal wind velocity, panel (c) the retrieved vertical Doppler velocity, and panel (d) the retrieved wind direction. The boxes 1, 2, and 3 highlight the time frames where fall streaks at 10:12:50, 11:33:31, and 11:47:30 UTC are retrieved, and their rearranged data are discussed and analyzed.
Figures 4 and 5 show measurements obtained with TARA radar, on 7 November 2014, from 10:00 to 12:00 UTC. In addition, the fields of reflectivity and linear depolarization ratio from the co-located vertical profiling cloud radar Mira are presented in Fig. 4a and d, respectively. The reflectivity (Z) fields in Fig. 4a and b display a precipitating cloud system. The band of enhanced Z values around 2.2 km indicates the melting layer of this frontal system. The attenuation and the non-Rayleigh scattering effect in the precipitation is clearly visible for the 35 GHz radar Mira, comparing the Z fields of both radars and, e.g., in Case 1 and Case 3 differences in Z-field above the melting layer up to 20 dBZ are visible. The Z fields in the cloud part show a high variation. Variability in the structure of the fields of differential reflectivity (ZDR) and linear depolarization ratio (LDR) are also visible in Fig. 4c and d. They have a high correlation with the visible fall streak signatures in the Z-field (e.g., 10:30–11:30 UTC above 4 km). Unfortunately, the TARA obtained wind fields between 10:30 and 11:20 UTC are corrupted (due to clutter in the non polarimetric offset beam measurements that influenced the retrieved wind fields especially the vertical Doppler velocity component, see Fig. 5c). Therefore, the data analysis is restricted to cases where the wind retrieval quality is good enough to apply the fall streak retrieval technique (Pfitzenmaier et al., 2017). Figure 5 displays the Doppler spectrum width and wind fields. Besides some small fluctuations in the horizontal wind field, Fig. 5b, the measurements show horizontally homogeneous wind conditions within the cloud in general. However, in the wind direction field, Fig. 5d, a vertical shear in wind direction is visible (about 30∘ from 10:00 UTC onwards). Later the wind direction shear reaches the cloud part (starting at 11:35 UTC). Therefore, enhanced values of vertical Doppler velocity and horizontal wind speed are visible as well as an increase of the Doppler spectral width can be identified. The turbulence is caused by the mixing of an approaching air-mass that is related to a cold frontal cloud system, into the present air-mass. Case 1 analyses an example during the enhanced ZDR and LDR signatures on top of the lower cloud layer between 10:09 and 10:18 UTC. While Case 2 focuses on the band of enhanced ZDR between 11:28 and 11:33 UTC at around 3 km. For the last case, Case 3, the fall streak structures of Z and polarimetric variables that generated within the enhanced band of ZDR at around 5 km between 11:35 and 11:47 UTC, are discussed.
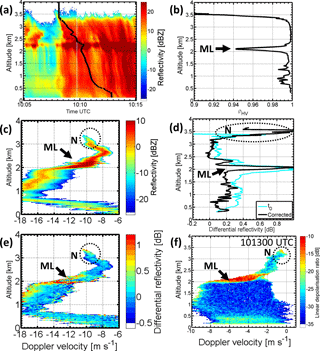
Figure 6Panel (a) shows the retrieved fall streak at 10:12:50 UTC obtained with TARA. Panels (c, e) are the fall streak corrected spectrograms (sZ and sZDR, 45∘ elevation – note that the Doppler velocity contains the radial wind). Panels (b, d) show the fall streak corrected profiles of ρHV and ZDR in black while light blue represents the vertical ZDR profile at 10:12:50 UTC. Panel (f) shows the sLDR spectrogram of the vertical pointing Mira at 10:13:00 UTC (all data displayed in the spectrograms have SNR>10 dB). ML points out the signature of the melting layer and N the signature related to the needle particles.
6.1 Case 1: aggregation of needles, 10:09–10:18 UTC
With Case 1 the analysis of along a fall streak rearranged S-band radar data is discussed to understand the present particle growth process. Figure 6a shows the result of a retrieved fall streak at 10:12:51 UTC. The results are obtained using a fixed cloud base height of 2250 m and an averaging window of 30 s for the wind profile as initial conditions for the algorithm (Pfitzenmaier et al., 2017). The main features of interest are the enhanced ZDR and LDR signatures near the cloud top of the lower cloud layer (3.75 to 3.5 km) between 10:09:00 and 10:18:00 UTC in Fig. 4 (in the following the time convention HHMMSS is used because some of the retrieved fall streak time reference includes seconds). The reflectivity during Case 1 increases with decreasing height as quickly as the polarimetric variables change towards a spherical shape dependent signature. Therefore, a strong growth of particle size from pristine shaped particles into almost spherical particles is assumed to be present. To classify the particle population and the growth process more precisely, the fall streak corrected radar data are analyzed.
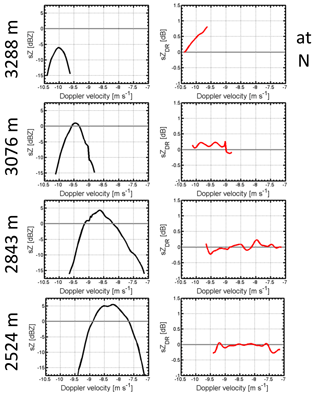
Figure 7Along the fall streak at 10:12:50 UTC rearranged sZ and sZDR at four different altitudes. The left panel shows Doppler spectra at 3288, 3076, 2843, and 2524 m. The right column displays the corresponding spectral differential reflectivity at the same heights. All spectra are at 45∘ elevation and averaged over three consecutive time bins (∼8 s).
The particle growth is visible in the fall streak corrected TARA sZ spectrogram in Fig. 6c. The sZ spectrogram shows a mono-modal particle population where sZ maximum increases from dBZ at the top (3.3 km) to sZ=10 dBZ above the melting layer (indicated by ML). The four Doppler spectra examples in Fig. 7 (left column, black spectra) show the evolution from cloud top towards the melting layer. In these examples of Doppler spectra the particle growth is seen by an increase of spectrum peak values and the broadening of the spectrum width with decreasing height. The fall streak corrected Z profile in Fig. 8a (black line) shows a 25 dBZ increase of Z, from cloud top towards the melting layer. In the profile a slight change in the slope at 3 km is visible. While above 3 km the generation and growth of particles are very fast (ΔZ≈20 dBZ in 0.6 km) below the increase is lower. Below, the slope shows a slight increasing linear trend towards the melting layer. Such linearity in the reflectivity profile indicates aggregation of particles (Westbrook et al., 2007). Due to the homogeneous cloud conditions the contrast of the along fall streak rearranged and vertical Z profiles (light blue profile) is not huge in the cloud. A larger difference in the data is only visible in the reflectivity of the rain pattern. Therefore, using fall streak rearranged data in Case 1 is mainly important for connecting the cloud microphysics to the rain intensity below.
The decrease of the polarimetric radar signatures in Fig. 6e and f at N (dotted circles), points out that the ice particles lose their pristine crystal shapes and become spherical particles. Values of sZDR decrease in the spectrogram from sZDR≈1 dB near 3.25 km to sZDR≈0.2 dB around 3 km. In the spectrograms it is also visible that particles at all sizes become spherical below 3 km at the maximum value of sZDR≈0.2 dB. In comparison to the schematic sketch of the ZDR-spectrogram in Fig. 3c sZDR values decrease throughout the whole size range (Doppler velocity range). In Fig. 7 this is visible in the column of the spectral differential reflectivity (right column, red spectra). At 3.076 km the sZDR signature versus the whole Doppler velocity range in the spectra is close to zero dB. This observation indicates strong aggregation of particles into spherical ice particles. The fall streak corrected ZDR-profile in Fig. 6d (black line) shows the strong decrease of polarimetric signature from ZDR≈1 dB to ZDR≈0.1 dB at 3 km. The high values in the ρHV profile in Fig. 6b exhibit homogeneity of the particle shapes within the measured population. ρHV values are constantly above 0.9975 below 3 km and therefore match the low ZDR-values and sZDR-signatures that confirm a homogeneous spherical particle population throughout the whole Doppler velocity range.
With TARA operating wavelength it is not possible to have a direct signature related to supercooled liquid water in the Doppler spectra or bulk parameters, additional information has to be used to detect its presence. The knowledge of the presence of supercooled liquid water helps in the characterization of the pristine crystal type, followed by an even better description of the involved ice crystal growth process. Comparing the observations with the temperature and dew-point temperature profiles measured by a radiosonde at 10:18 UTC (Fig. 9) a supercooled liquid water layer at cloud top is identified when both profiles match and the relative humidity reaches 100 % (light blue shaded area). The detected temperature range of −8 to −6 ∘C corresponds to the growth regime of needles at that height (Pruppacher and Klett, 1996). As a second indirect validation the observed sLDR values and signatures in Fig. 6f are used. They are consistent with other observations and simulated sLDR values of needle particles (Aydin and Walsh, 1999; Matrosov et al., 2001; Oue et al., 2015b). The simulated LDR values span a range from −16 to −12.5 dB that is in good agreement with the observed sLDR values in the spectrogram that reach values up to −17 dB in Fig. 6f. Therefore, the observed signatures of sLDR and the temperature values indicate the presence of needles at cloud top.
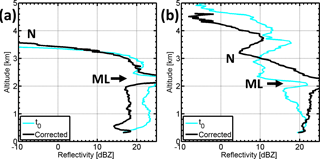
Figure 8Panels (a, b) show the fall streak corrected profiles of Z. Panel (a) shows the profiles at 10:12:51 UTC and (b) at 11:33:31 UTC. The black line is the fall streak corrected profile and the light blue line represents the vertical profile at the given time. ML points out the signature of the melting layer and N the signature related to needle growth and new generated particle population, respectively.
Summing up needles that generated at the cloud top grow fast into a homogeneous population of spherical particles. The fall streak corrected Z-profile, Fig. 8a, and the sZ-spectrogram in Fig. 6c show an increase of reflectivity values. The slopes of the Z-profile are consistent with the linear increase of reflectivity in case of aggregation of ice crystals into snowflakes. In addition the observed Doppler velocities within Mira radar sLDR-spectrogram of −2 m s−1, right above the melting layer also match the expected velocities for aggregates or slightly rimed particles (Mitchell, 1996; Fukuta and Takahashi, 1999). A strong aggregation or clumping of needle particles is mentioned by Hobbs et al. (1974), Rangno and Hobbs (2001) and Hogan et al. (2002). The example of sZDR-spectra in Fig. 7 shows that such spherical particles can be observed within a short distance below particle generation. These compact and dense particles are more efficient to produce precipitation compared to the ice crystals and snowflakes produced in the time frame before Case 1.
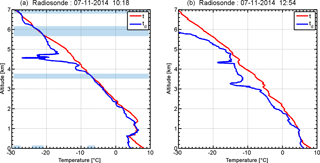
Figure 9Radiosonde launches from the CESAR site at 10:18 UTC (a) and after precipitation system has passed at 12:54 UTC (b). Displayed are profiles of the temperature t (red) and dew-point temperature td (blue). The light blue bars indicate areas where supercooled liquid water was detected with the radiosondes; their corresponding temperature range on the x-axis is highlighted.
6.2 Case 2: generation of a second particle population, 11:28–11:33 UTC
The focus of Case 2 is the enhanced ZDR band between 3.2 and 2.6 km in Fig. 4c and the related microphysical processes that can be identified and connected to its presence. Figure 4b shows that in parallel the reflectivity values increase below 3.2 km, compared to above, which indicates particle growth. Because the band of enhanced ZDR decreases (particles become more spherical) towards the melting layer a particle growth process can be assumed in Case 2.
In order to go further in the process description, re-arranged fall streaks are additionally retrieved and analyzed. The retrieval is done setting the initial conditions to 2.25 km for the cloud base height and 90 s for the wind averaging. The ZDR profile, Fig. 10d (black), shows at N, a strong increase from ZDR≈0.2 dB at 3.2 km to a maximum of 0.65 dB at 2.9 km which indicates the generation of new particles at that height. From N on towards the melting layer, the Z profile, Fig. 8b (black), shows a linear increase of reflectivity of 15 dBZ that indicates an ongoing aggregation process (Westbrook et al., 2007). The rearranged ZDR profile in Fig. 10d shows also signatures that are in agreement with an aggregation process. Below N, the ZDR-values decrease due to the aggregation of the new generated particles into more spherical shaped particles. It is worth noting that such signatures cannot be identified in the vertical, not re-arranged, Z and ZDR profiles (light blue profiles in the Figs. 8b and 10d). This analysis therefore demonstrates the advantage of using along fall streak rearranged radar data, as obtained from Pfitzenmaier et al. (2017). Compared to Case 1, the slope of the Z-profile in Case 2 increases much slower at a rate of 15 dBZ per 1 km (in Case 1 25 dBZ per 1 km). The different slopes of the Z-profiles might indicate different aggregation processes for the two cases.
In Fig. 10b the ρHV-minimum of 0.956 right above the increase of ZDR at 3.2 km indicates the generation of new particles. Due to a high variation of particle shapes (new generated particles, and seeded particles) within the sampling volume the values of ρHV lead to that minimum. Below 3.1 km, the ρHV value increases and reaches values of >0.99 below 2.8 km. This increase of ρHV shows that the particle population becomes more and more homogeneous, which indicates an aggregation process.
Next, rearranged fall streak data are analyzed in the spectral domain in order to discriminate between the generated particles at N and the particles seeding from above. The rearranged sZ and sZDR spectrograms are presented in Fig. 10c and e. At 3.1 km, a broadening is observed in the sZ spectrogram. This broadening of the spectra corresponds to the generation of a second particle mode that is visible at N. The maximum sZ values increase from dBZ above N to sZ≈7 dBZ right above the melting layer. These observations are indicating aggregation of the newly generated crystals towards the melting layer. In Fig. 10e a bimodality is visible in the sZDR-spectrogram at N. In comparison to the sZ spectrogram the sZDR spectrogram contains a bimodal shape from N till about 350 m lower. In the sZ-spectrogram such separated modes cannot be identified. Because of the stable second mode in the sZDR spectrogram, the assumption of an aggregation process below N is adjusted and a separated diffusional growth of the new generated particles can be assumed, before they aggregate with the ice particles seeded from above.
The analysis of the single sZ and sZDR spectra in Fig. 11 confirms the hypothesis of diffusional growth. Figure 11 displays four fall streak rearranged Doppler spectra (sZ, left column, black spectra) and differential reflectivity spectra (sZDR, right column, red line) at four different heights, 3394, 3055, 2864, and 2630 m. At N, a clear broadening in the sZ spectra is visible that is caused by the development of a second particle mode. With decreasing height, the shape of sZ is again monomodal and its values rise, see sZ at 2864, and 2630 m. At 3055 m, it is seen that the newly developed particles at N have high sZDR-values and the sZDR spectrum shape turns bimodal. However, in comparison to the sZ that loses its bimodal shape rather quickly the sZDR maintains it further below. At 2864 m two particle populations can still be identified in the sZDR spectrum. Between −8.5 and −7.25 m s−1, high sZDR-values indicate a large amount of pristine shaped ice crystals, while at Doppler velocities < −8.5 m s−1 low sZDR-values refer to almost spherical crystals in that part of the spectrum. This clearly shows that from N to 2864 m the generated particles keep their shape dependence and, therefore, can be separated using the sZDR spectrum. In parallel the sZ values increases for Doppler velocities indicating large particles. Due to this growth sZ loses a clearly visible bimodality that was present at N.
These observed signatures fit to the schematic sketches of the diffusional growth of particles, Fig. 3b. The signatures of the sZ and the sZDR clearly show that particles generated at N grow separately from the particles seeding from above. Due to the clear size-dependent growth of the smaller particles we assume a diffusional growth of the newly generated particles. Nevertheless, at lower heights the clear separation in the sZDR spectra disappears. This can be explained by the merging of the two particle populations and, therefore, an aggregation process between the particles, see spectra at 2630 m. At N and at 2864 m, the sZDR-spectrogram shows negative signatures for large ice particles. The values show that the growth at N leads to prolate particles. Super cooled liquid water droplets can lead to a partial riming of large particles or turbulence could lead to this prolate orientation. However, with decreasing height the shape of these particle populations becomes spherical or even slightly oblate again. Nevertheless, the analysis of the along-fall-streak rearranged spectral data has demonstrated that such processes cannot be identified using integrated volume data. Because using integrated moment data such size dependent spectral signatures are not longer present.
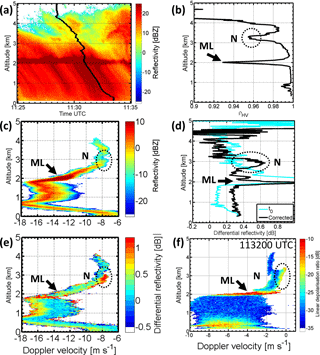
Figure 10Panel (a) shows the retrieved fall streak at 11:33:31 UTC on top of the Z field. Panels (c, e) are the fall streak corrected spectrograms (sZ and sZDR, 45∘ elevation – note that the Doppler velocity contains the radial wind). Panels (b, d) show the fall streak corrected profiles of ρHV and ZDR in black, while light blue represents the vertical ZDR profile at 11:33:31 UTC. Panel (f) shows the sLDR spectrogram of the vertical pointing Mira at 11:32:00 UTC (all data displayed in the spectrograms have SNR>10 dB). ML points out the signature of the melting layer and N the signature related to the new particle population.
The particle type of the new generated particles can be identified by combining the polarimetric measurements from TARA with additional data from the radiosonde measurements and the sLDR-signatures from the Mira radar. Bands of enhanced ZDR are an indicator for the generation and growth of pristine ice particles, mainly dendrites or hexagonal plates (Bader et al., 1987; Kennedy and Rutledge, 2011; Moisseev et al., 2015). However, the visible polarimetric signatures in the radar measurements in Case 2 are caused most likely by newly generated ice needles or columns. The temperature ranges of the radiosonde launches in Fig. 9 show values between −8 and −5 ∘C at 3 km for both launches. This temperature corresponds to a needle or column generation regime, as in Case 1. In addition, the sLDR-spectrogram observed with Mira shows similar signatures with sLDR-values of −17 dB that agree to the simulation signatures for needles or columns (Aydin and Walsh, 1999; Matrosov et al., 2001; Oue et al., 2015b). Because the cloud conditions are not homogeneous, the hypothesis of the presence of needles is mainly built upon the radiosonde data. The radar Mira sLDR is used to confirm this hypothesis, although both radars measure different sampling volumes. Therefore, it is expected that the enhanced ZDR signature is caused by needles or columns. An indication for needle particles can be the presence of a supercooled liquid water layer at that height. Hogan et al. (2002) showed that small-scale dynamics within frontal system clouds lead to supercooled liquid droplet formation in the cloud system. Such upward motions are visible in the vertical Doppler velocity field during Case 2 in Fig. 5, and the hypothesis of needle generation is considered. Nevertheless, in comparison to Case 1, the aggregation efficiency may be lower. In Hobbs et al. (1974), a strong correlation between the particle number concentration and the aggregation efficiency for needles is mentioned. Lower number concentration would lead to less dense aggregates – this may explain the difference between Case 1 and Case 2.
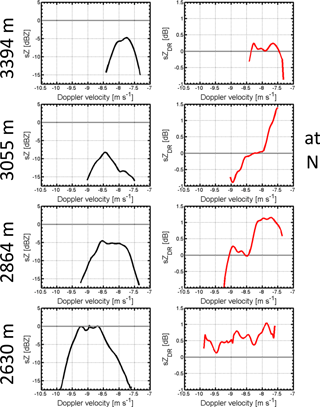
Figure 11Along the fall streak at 11:33:31 UTC rearranged sZ and sZDR at four different altitudes. The left panel shows Doppler spectra at 3394, 3055, 2864, and 2630 m. The right column displays the corresponding spectral differential reflectivity at the same heights. All spectra are at 45∘ elevation and averaged over 3 consecutive time bins (∼8 s).
Finally, it is observed, that the new generated particles at 3.1 km and the related growth of ice crystals lead to an increase of Z in the rain pattern below the melting layer, see Fig. 10a. When the ZDR-band at 3 km is not present anymore, before and just after Case 2, Fig. 4c, the reflectivity values in rain are less, Fig. 4b. The radiosonde temperature profiles and updraft patterns in the vertical Doppler velocity field show the potentiality for supercooled liquid water layer presence around 3 km. The measured sLDR-signatures show signatures of needle or columnar shaped ice particles. Therefore, the existence of a supercooled liquid water layer is possible. Furthermore, the sZDR-spectrogram clearly exhibits two different particle populations below this height. The decrease of polarimetric signature in parallel to the increase of Z-values suggests the aggregation of the two present particle populations during Case 2. Deeper analysis of the sZDR spectra indicate that the mode of smaller particles first grows due to the diffusional growth before merging with the other mode. When these two modes merge, the clear separation disappears and the aggregation of the particles becomes dominant.
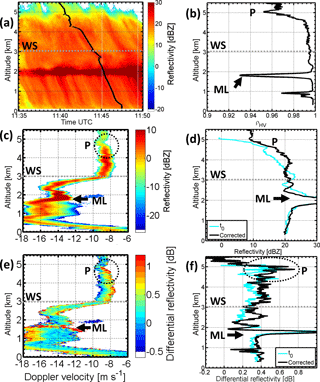
Figure 12Panel (a) shows the retrieved fall streak at 11:47:30 UTC obtained with TARA. Panels (c, e) are the fall streak corrected spectrograms (sZ and sZDR, 45∘ elevation, all data displayed in the spectrograms have SNR>10 dB – Note that the Doppler velocity contains the radial wind). Panels (b, d, f) show the fall streak corrected profiles of ρHV, Z, and ZDR in black while the lines in light blue represent the vertical Z and ZDR profiles at 11:47:30 UTC. ML points out the signature of the melting layer and P (black dotted circles) the signature related to the growth process of the particle population under investigation. The dotted line WS indicates approximately the wind direction shear height.
6.3 Case 3: particle growth of hexagonal particles, 11:35–11:47 UTC
Figure 12 shows the analysis of the retrieved fall streak from 11:47:30 UTC. The focus of Case 3 is related to the increased ZDR signature at 5 km between 11:35:00 and 11:47:00 UTC. At that height the Z-values increase and indicate a particle growth. The fall streak rearranged data are retrieved using a cloud base height of 2.25 km and a 90 s averaged wind profile. The vertical profiles and fall streak corrected data are only analyzed from cloud top till 3.0 km. This is done because at 3.0 km a strong shear in wind direction is visible in Fig. 5d). Therefore, a homogeneous cloud cannot longer be assumed and the along the fall streak rearranged data would describe a different particle population below 3.0 km. So the analysis focuses at regions above 3.0 km and no link to the increased precipitation pattern is done for that case. The case is anyhow challenging. Because the data above 3.0 km show signatures of aggregation and some indications for riming are found. Therefore, the focus of Case 3 is the identification of the most probable particle growth process.
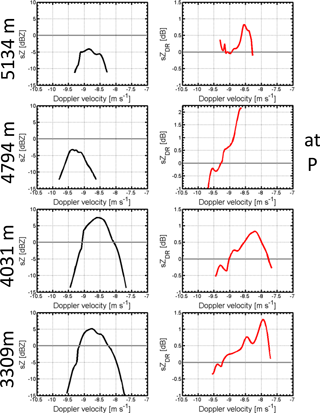
Figure 13Along the fall streak at 11:47:30 UTC rearranged sZ and sZDR at four different altitudes. The left panel shows Doppler spectra at 5134, 4794, 4031, and 3309 m. The right column displays the corresponding spectral differential reflectivity at the same heights. All spectra are at 45∘ elevation and averaged over 3 consecutive time bins (∼8 s).
Figure 4b depicts a horizontal homogeneous Z-field during Case 3, where the main increase of reflectivity is visible between 5 and 4.5 km. In the fall streak corrected sZ spectrogram, Figs. 12c and 13, the increase of sZ can be localized at the same height range. There the maximum values of sZ increase from −5 dBZ above 5 km to sZ≈6 dBZ at around 4.5 km (sZ≈7.5 dBZ at 4 km). The Z-profile in Fig. 12d (black line) shows constant values above 5 km (Z≈10 dBZ) and below 4 km (Z≈20 dBZ). The main growth process of the tracked particle population is visible between 5 km and 4 km, where the reflectivity increases linearly of 10 dBZ, which indicates an ongoing aggregation (Westbrook et al., 2007). This signature is consistent with other observations and, therefore, the studies of the microphysics are based on fall streak rearranged TARA data.
The sZDR spectrogram exhibits a clear shape–size dependency even below the particle growth. The sZDR signature consists of high values at the right edge where the small particles are present. This signature is constantly present between 4.5 and 3 km. The maximum values of sZDR are just below 5 km, sZDR≈2.25 dB, sZDR-spectra at P in Fig. 13, and decrease with the height. Nevertheless, the shape–size dependency stays. The fall streak corrected ZDR profile in Fig. 12f exhibits a maximum of 0.75 dB between 5.0 and 4.5 km. Below ZDR values are rather constant around 0.4 dB till 3.0 km. Such a bulk volume is challenging to interpret without the spectral polarimetric measurement.
The profile of ρHV in Fig. 12b increases with the observed particle growth below 5 km (Z profile) and stays constant from 4.5 to 3 km. It also exhibits a minimum before the increase around 5 km (slightly above the maximum of ZDR). This is caused by a large variety of particle shapes before the growth, like in Case 2. Below the growth process ρHV shows a constant value that is 0.05 lower than in Case 2. This is caused by the shape–size relation that is present in the sZDR spectrogram. Because this signature stays constant till 3 km further growth processes of the tracked particle population like aggregation do not occur.
The constant shape–size dependency within the sZDR spectrogram between 4.5 and 3.0 km is the most dominant feature. Comparing these signatures to the schematic sketches in Fig. 3 we can opt for riming or aggregation of particles. In Fig. 13 the Doppler spectra do not show a separated mode. Simulations of sZDR signature indicate that the observed signature at P in Fig. 13, 4.794 km, can be produced by a mixture of pristine hexagonal shaped ice particles and aggregated or rimed particles (Spek et al., 2008). Like in Case 1 and 2, the trend of the sZDR versus Doppler velocity can be examined, when it is stable for several heights and times. However, caution is required for the values of sZDR because of their large variance. The absolute values of the Doppler velocities of the Mira spectra (not shown) are below 2 m s−1. They correspond to pristine and slightly rimed particles (Mitchell, 1996). Due to the homogeneity of the particle population below 4.5 km in terms of sZ and sZDR we assume that the particles mainly grow at P and then seed further through the cloud system. Below 4 km the sZDR spectrogram and spectra in Figs. 12e and 13 (right column) show that the larger particles could be prolate. Negative differential reflectivity signatures can be expected for conical graupel presence (Oue et al., 2015a). However, the observations of Oue et al. (2015a) indicated that the reflectivity of graupel particles is much higher than in our observations. Riming of particles that lead to prolate particles is also possible but the presence of conical graupel cannot be confirmed. Nevertheless, the observed vertical Doppler velocities of the Mira radar are within the expected range for slightly rimed particles. In comparison to the schematic sketches in Fig. 3a no separated particle mode is visible. However, the Doppler spectra at 4031, and 3309 m in Fig. 13 exhibit a small bump where sZDR signatures are negative. Therefore, a small amount of rimed prolate oriented particles could be present.
The identification of the dominant particle shape at 5 km can indicate the dominant growth process. As dendrites and plates have different efficiencies of aggregation and riming (Pruppacher and Klett, 1996; Lamb and Verlinde, 2011), the temperature of radiosonde launches is used to identify the possible pristine particle growth regime. In Fig. 9 both profiles indicate a temperature range between −15 and −13 ∘C, but a direct identification of a supercooled liquid water layer around 5.0 km can not be done (dew-point-temperature and temperature profiles do not match at that height). Nevertheless, the temperature range at 5.0 km agrees with the growth regime of hexagonal plates or dendrites (Pruppacher and Klett, 1996; Fukuta and Takahashi, 1999). As in Case 2, the vertical Doppler velocity measurements indicate updraft patterns in that region that increases the probability of the presence of supercooled liquid water droplets (Hogan et al., 2002). However, from the observations it is not clear which pristine particle shape is dominating the growth process at that height: hexagonal plates or dendrites. Summing up all the facts, the polarimetric measurements, the temperature range, and the updraft patterns we conclude that the presence of supercooled liquid water around P is possible. Because no separated riming mode could be identified in the spectra we do not expect riming to be the dominant particle growth process. It is more likely that the constant reflectivity values and the constant shape–size relationship along the fall streak rearranged data below P are caused by an aggregation process. However, more measurements of the particle microphysics would be necessary to get a more detailed picture on which growth process might dominate in that case.
The high temporal and spatial resolution of profiling S-band radar TARA made it possible to detect and identify structures of particle generation and growth within complicated and dynamically complex mixed-phase cloud systems. Using a S-band radar system has the advantage that the attenuation of the radar signal during precipitation can be neglected compared to higher frequencies operating systems (Kollias et al., 2007). The unique three beam configuration of TARA makes it possible to retrieve the full 3-D wind field for each measurement (Unal et al., 2012). Furthermore, this dynamical information is used to retrieve particle fall-streaks within the bulk parameter fields, Pfitzenmaier et al. (2017). Therefore, the bulk parameter profiles, Z, ZDR, and ρHV, as well as spectrograms, sZ and sZDR, are rearranged along such retrieved fall streak before they are analyzed. Consequently, these corrected spectrograms and profiles show the consistency of the particle growth within the cloud part and relate better to the increase of the rain pattern below the melting layer. Such increased rain patterns are identified during Case 1 and 2.
The analysis of the along fall streak rearranged measurements allows to localize the particle growth process. This can be done by examination of the increase and the slope of Z along the fall streak. Westbrook et al. (2007) showed that the aggregation of ice crystals leads to a constant increase of Z with decreasing height. The observations were based on averaged data of homogeneous ice clouds over a long time period. Using rearranged data along fall streak such studies can be done in less homogeneous cloud conditions. The presence of supercooled liquid water leads to a much faster growth of ice particles within a shorter amount of time (fast increase of Z within short height ranges) compared to the growth of particles by aggregation in the ice phase only (Pruppacher and Klett, 1996). That may explain the increase in the Z profile within 1 km of 25 dBZ in Case 1, 15 dBZ in Case 2, and 10 dBZ in Case 3.
The fall streak corrected sZDR measurements of TARA are able to deliver shape information and their distribution within the tracked particle population. The changes of the observed signature is in good agreement with the discussed particle growth (increase of Z). However, stable trends of sZDR should be examined, rather than absolute values because of the large variance of this spectral polarimetric parameter.
In Case 3 the observed polarimetric signature in the sZDR spectrogram agrees with the simulated sZDR signature for a mixture of hexagonal plates and rimed particles or aggregates in Spek et al. (2008). Therefore, we can opt for riming and/or aggregation of particles in that case. Aggregation is assumed to be the dominant particle growth process. Nevertheless, negative sZDR-values are observed in the spectrogram, which may indicate rimed prolate oriented particles. However, a typical separated riming mode within the Doppler spectra sZ is not visible. The Mira vertical Doppler velocities fit to the velocity range of slightly rimed particles. Observed updraft patterns indicate the possible presence of supercooled liquid water at the region of the main particle growth, like observed by Hogan et al. (2002). Therefore, riming cannot be neglected in Case 3, however, explicit riming signatures cannot be observed in the measured spectra.
The observed signatures of sLDR and sZDR as well as the measured temperature in Case 1 are in agreement with modeled signatures of needles and their strong tendency to clump and aggregate as reported by Rangno and Hobbs (2001). In Case 2 the observed signatures are more complex. While the temperature range can be considered the same as Case 1 the polarimetric signature differs. One reason could be the difference in aggregation efficiency of the new produced particles in these two cases. In Case 2 the needles show a lower aggregation efficiency with the ice particles seeded from above, than in Case 1 where only needles were present. The decrease of the polarimetric signature is less strong than in Case 1. Another reason might be a difference in the particle concentration of the generated particles that is less in Case 2 (sZ of the increased sZDR mode is less that the sZ values in Case 1). Then the aggregation efficiency is less and the decrease of the sZDR signature takes longer. Nevertheless, from the observations it is not visible which mechanism is dominant or if they depend on each other. It is only seen that a second population of particles with a high shape size dependency is present in the data. These polarimetric signatures as well as the corresponding temperature profiles indicate the presence of supercooled liquid water.
Parallel radiosonde launches and the sLDR of the vertical pointing Ka radar Mira are used to compare and verify the results based on the TARA measurements. The cases presented in Sect. 6 are examples of the spectral and bulk parameter characteristics observed during the whole event. These analyzed ice particle growth processes above the melting layer show a strong correlation with increased pattern of precipitation in the reflectivity fields. Therefore, the presented data with applied fall streak correction demonstrate the advantage of using also high resolution S-band radar data to increase the understanding of ice particle growth within precipitating mixed-phase cloud systems.
Data related to this article are available under https://doi.org/10.4121/uuid:ee7bcf69-b13e-4445-8e65-0004055f4c03. The data were prepared by Lukas Pfitzenmaier and are owned by TU-Delft (contact persons: Christine Unal and Herman Russchenberg).
CU designed the data processing of TARA, contributed to the quality control of the data and the result discussion. YD helped organizing and performing the ACCEPT campaign and discussing the results. HR designed the scientific structure of the project, helped in the realization of ACCEPT, and contributed to the discussion of the results. LP performed the measurements taken during the ACCEPT campaign in autumn 2014, Cabauw, the Netherlands, supported by the colleagues from TROPOS. LP performed the fall streak analysis, contributed to the result discussion, and prepared the manuscript with contributions of all coauthors.
The authors declare that they have no conflict of interest.
The research leading to these results has received funding from the European
Union Seventh Framework Program (FP7/2007–2013) and the ITN Marie Curie
Actions Program (2012–2016) in the frame of ITaRS under grant agreement no.
289923. The ACCEPT campaign was partly funded by ACTRIS Research
Infrastructure Project by the European Union's Horizon 2020 research and
innovation program under grant agreement no. 654169, and previously under
grant agreement no. 262254 in the Seventh Framework Program
(FP7/2007–2013). The authors wish to also acknowledge the cooperations of
institutes (TROPOS, KNMI, LMU) and companies (METEK GmbH) during ACCEPT. We
highly appreciate the discussions at EGU 2015 at the Poster session that
inspired the presented work.
Edited by:
Jui-Yuan Christine Chiu
Reviewed by: two anonymous referees
Andrić, J., Kumjian, M. R., Zrnić, D. S., Straka, J. M., and Melnikov, V. M.: Polarimetric Signatures above the Melting Layer in Winter Storms: An Observational and Modeling Study, J. Appl. Meteorol. Clim., 52, 682–700, https://doi.org/10.1175/JAMC-D-12-028.1, 2013. a
Apituley, A., Wilson, K., Potma, C., Volten, H., and de Graaf, M.: Performance assessment and application of CAELI, a high-performance Raman lidar for diurnal profiling of water vapour, aerosols and clouds, Proceeding of the 8th International Symposium on Tropospheric Profiling, Delft, the Netherlands, 2009. a
Ávila, E. E., Castellano, N. E., Saunders, C. P. R., Bürgesser, R. E., and Aguirre Varela, G. G.: Initial stages of the riming process on ice crystals, Geophys. Res. Lett., 36, L09808, https://doi.org/10.1029/2009GL037723, 2009. a
Aydin, K. and Walsh, T. M.: Millimeter wave scattering from spatial and planar bullet rosettes, IEEE T. Geosci. Remote Sens., 37, 1138–1150, https://doi.org/10.1109/36.752232, 1999. a, b
Baars, H., Kanitz, T., Engelmann, R., Althausen, D., Heese, B., Komppula, M., Preißler, J., Tesche, M., Ansmann, A., Wandinger, U., Lim, J.-H., Ahn, J. Y., Stachlewska, I. S., Amiridis, V., Marinou, E., Seifert, P., Hofer, J., Skupin, A., Schneider, F., Bohlmann, S., Foth, A., Bley, S., Pfüller, A., Giannakaki, E., Lihavainen, H., Viisanen, Y., Hooda, R. K., Pereira, S. N., Bortoli, D., Wagner, F., Mattis, I., Janicka, L., Markowicz, K. M., Achtert, P., Artaxo, P., Pauliquevis, T., Souza, R. A. F., Sharma, V. P., van Zyl, P. G., Beukes, J. P., Sun, J., Rohwer, E. G., Deng, R., Mamouri, R.-E., and Zamorano, F.: An overview of the first decade of PollyNET: an emerging network of automated Raman-polarization lidars for continuous aerosol profiling, Atmos. Chem. Phys., 16, 5111–5137, https://doi.org/10.5194/acp-16-5111-2016, 2016. a
Bader, M. J., Clough, S. A., and Cox, G. P.: Aircraft and dual polarization radar observations of hydrometeors in light stratiform precipitation, Q. J. Roy. Meteor. Soc., 113, 491–515, https://doi.org/10.1002/qj.49711347605, 1987. a, b, c
Bechini, R., Baldini, L., and Chandrasekar, V.: Polarimetric Radar Observations in the Ice Region of Precipitating Clouds at C-Band and X-Band Radar Frequencies, J. Appl. Meteorol. Clim., 52, 1147–1169, https://doi.org/10.1175/JAMC-D-12-055.1, 2013. a
Bringi, V. N. and Chandrasekar, V.: Polarimetric Doppler Weather Radar, Cambridge University Press, 636 pp., 2001. a
Browne, I. C.: Precipitation streaks as a cause of radar upper bands, Q. J. Roy. Meteor. Soc., 78, 590–595, https://doi.org/10.1002/qj.49707833809, 1952. a, b
Bühl, J., Seifert, P., Wandinger, U., Baars, H., Kanitz, T., Schmidt, J., Myagkov, A., Engelmann, R., Skupin, A., Heese, B., Klepel, A., Althausen, D., and Ansmann, A.: LACROS: the Leipzig Aerosol and Cloud Remote Observations System, in: Society of Photo-Optical Instrumentation Engineers (SPIE) Conference Series, Vol. 8890 of Society of Photo-Optical Instrumentation Engineers (SPIE) Conference Series, p. 2, https://doi.org/10.1117/12.2030911, 2013. a
Chandrasekar, V., Keränen, R., Lim, S., and Moisseev, D.: Recent advances in classification of observations from dual polarization weather radars, Atmos. Res., 119, 97–111, https://doi.org/10.1016/j.atmosres.2011.08.014, 2013. a, b, c
Dufournet, Y. and Russchenberg, H. W. J.: Towards the improvement of cloud microphysical retrievals using simultaneous Doppler and polarimetric radar measurements, Atmos. Meas. Tech., 4, 2163–2178, https://doi.org/10.5194/amt-4-2163-2011, 2011. a
Engelmann, R., Kanitz, T., Baars, H., Heese, B., Althausen, D., Skupin, A., Wandinger, U., Komppula, M., Stachlewska, I. S., Amiridis, V., Marinou, E., Mattis, I., Linné, H., and Ansmann, A.: The automated multiwavelength Raman polarization and water-vapor lidar PollyXT: the neXT generation, Atmos. Meas. Tech., 9, 1767–1784, https://doi.org/10.5194/amt-9-1767-2016, 2016. a
Field, P. R., Hogan, R. J., Brown, P. R. A., Illingworth, A. J., Choularton, T. W., Kaye, P. H., Hirst, E., and Greenaway, R.: Simultaneous radar and aircraft observations of mixed-phase cloud at the 100 m scale, Q. J. Roy. Meteor. Soc., 130, 1877–1904, https://doi.org/10.1256/qj.03.102, 2004. a
Fukuta, N. and Takahashi, T.: The Growth of Atmospheric Ice Crystals: A Summary of Findings in Vertical Supercooled Cloud Tunnel Studies, J. Atmos. Sci., 56, 1963–1979, https://doi.org/10.1175/1520-0469(1999)056<1963:TGOAIC>2.0.CO;2, 1999. a, b, c, d
Görsdorf, U., Lehmann, V., Bauer-Pfundstein, M., Peters, G., Vavriv, D., Vinogradov, V., and Volkov, V.: A 35-GHz Polarimetric Doppler Radar for Long-Term Observations of Cloud Parameters – Description of System and Data Processing, J. Atmos. Ocean. Tech., 32, 675–690, https://doi.org/10.1175/JTECH-D-14-00066.1, 2015. a
Heijnen, S. H., Ligthart, L. P., and Russchenberg, H. W. J.: First Measurements with TARA; An S-Band Transportable Atmospheric Radar, Phys. Chem. Earth B, 25, 995–998, https://doi.org/10.1016/S1464-1909(00)00140-4, 2000. a
Hobbs, P. V., Chang, S., and Locatelli, J. D.: The dimensions and aggregation of ice crystals in natural clouds, J. Geophys. Res., 79, 2199–2206, https://doi.org/10.1029/JC079i015p02199, 1974. a, b, c
Hogan, R. J., Field, P. R., Illingworth, A. J., Cotton, R. J., and Choularton, T. W.: Properties of embedded convection in warm-frontal mixed-phase cloud from aircraft and polarimetric radar, Q. J. Roy. Meteor. Soc., 128, 451–476, https://doi.org/10.1256/003590002321042054, 2002. a, b, c, d, e, f
Kalesse, H., Szyrmer, W., Kneifel, S., Kollias, P., and Luke, E.: Fingerprints of a riming event on cloud radar Doppler spectra: observations and modeling, Atmos. Chem. Phys., 16, 2997–3012, https://doi.org/10.5194/acp-16-2997-2016, 2016. a, b, c
Keat, W. J. and Westbrook, C. D.: Revealing Layers of Pristine Oriented Crystals Embedded Within Deep Ice Clouds Using Differential Reflectivity and the Copolar Correlation Coefficient, J. Geophys. Res.-Atmos., 122, 11737–11759, https://doi.org/10.1002/2017JD026754, 2017. a
Kennedy, P. C. and Rutledge, S. A.: S-Band Dual-Polarization Radar Observations of Winter Storms, J. Appl. Meteorol. Clim., 50, 844–858, https://doi.org/10.1175/2010JAMC2558.1, 2011. a, b, c
Kneifel, S., Lerber, A., Tiira, J., Moisseev, D., Kollias, P., and Leinonen, J.: Observed relations between snowfall microphysics and triple-frequency radar measurements, J. Geophys. Res.-Atmos., 120, 6034–6055, https://doi.org/10.1002/2015JD023156, 2015. a
Kollias, P., Clothiaux, E. E., Miller, M. A., Albrecht, B. A., Stephens, G. L., and Ackerman, T. P.: Millimeter-Wavelength Radars: New Frontier in Atmospheric Cloud and Precipitation Research, B. Am. Meteorol. Soc., 88, 1608, https://doi.org/10.1175/BAMS-88-10-1608, 2007. a, b, c, d, e
Lamb, D. and Verlinde, J.: Physics and Chemistry of Clouds, 1, Cambridge University Press, UK, 584 pp., available at: http://www.cambridge.org/gb/knowledge/isbn/item5980388/?site_locale=en_GB (last access: 18 May 2018), 2011. a, b, c, d
Marshall, J. S.: Precipitation Trajectories and Patterns, J. Atmos. Sci., 10, 25–29, https://doi.org/10.1175/1520-0469(1953)010<0025:PTAP>2.0.CO;2, 1953. a, b
Matrosov, S. Y., Reinking, R. F., Kropfli, R. A., Martner, B. E., and Bartram, B. W.: On the Use of Radar Depolarization Ratios for Estimating Shapes of Ice Hydrometeors in Winter Clouds, J. Appl. Meteorol., 40, 479–490, https://doi.org/10.1175/1520-0450(2001)040<0479:OTUORD>2.0.CO;2, 2001. a, b
Mitchell, D. L.: Use of Mass- and Area-Dimensional Power Laws for Determining Precipitation Particle Terminal Velocities, J. Atmos. Sci., 53, 1710–1723, https://doi.org/10.1175/1520-0469(1996)053<1710:UOMAAD>2.0.CO;2, 1996. a, b
Moisseev, D., Unal, C., Russchenberg, H., and Chandrasekar, V.: Radar observations of snow above the melting layer, in: Third European Conference on Radar Meteorology (ERAD), 407–411, 2004. a
Moisseev, D. N., Lautaportti, S., Tyynela, J., and Lim, S.: Dual-polarization radar signatures in snowstorms: Role of snowflake aggregation, J. Geophys. Res.-Atmos., 120, 12644–12655, https://doi.org/10.1002/2015JD023884, 2015. a, b, c, d
Myagkov, A., Seifert, P., Wandinger, U., Bühl, J., and Engelmann, R.: Relationship between temperature and apparent shape of pristine ice crystals derived from polarimetric cloud radar observations during the ACCEPT campaign, Atmos. Meas. Tech., 9, 3739–3754, https://doi.org/10.5194/amt-9-3739-2016, 2016. a, b, c
Oue, M., Kumjian, M. R., Lu, Y., Jiang, Z., Clothiaux, E. E., Verlinde, J., and Aydin, K.: X-Band Polarimetric and Ka-Band Doppler Spectral Radar Observations of a Graupel-Producing Arctic Mixed-Phase Cloud, J. Appl. Meteorol. Clim., 54, 1335–1351, https://doi.org/10.1175/JAMC-D-14-0315.1, 2015a. a, b, c, d, e, f, g
Oue, M., Kumjian, M. R., Lu, Y., Verlinde, J., Aydin, K., and Clothiaux, E. E.: Linear Depolarization Ratios of Columnar Ice Crystals in a Deep Precipitating System over the Arctic Observed by Zenith-Pointing Ka-Band Doppler Radar, J. Appl. Meteorol. Clim., 54, 1060–1068, https://doi.org/10.1175/JAMC-D-15-0012.1, 2015b. a, b
Oue, M., Galletti, M., Verlinde, J., Ryzhkov, A., and Lu, Y.: Use of X-Band Differential Reflectivity Measurements to Study Shallow Arctic Mixed-Phase Clouds, J. Appl. Meteorol. Clim., 55, 403–424, https://doi.org/10.1175/JAMC-D-15-0168.1, 2016. a
Pfitzenmaier, L., Dufournet, Y., Unal, C. M. H., and Russchenberg, H. W. J.: Retrieving fall streaks within cloud systems using Doppler Radar, J. Atmos. Ocean. Tech., 34, 905–920, https://doi.org/10.1175/JTECH-D-16-0117.1, 2017. a, b, c, d, e, f, g, h, i, j, k
Pruppacher, H. R. and Klett, D. J.: Microphysics of Clouds and Precipitation, Springer, Dordrecht, Heidelber, London, NewYork 1996. a, b, c, d, e, f, g, h
Rangno, A. L. and Hobbs, P. V.: Ice particles in stratiform clouds in the Arctic and possible mechanisms for the production of high ice concentrations, J. Geophys. Res., 106, 15065–15075, https://doi.org/10.1029/2000JD900286, 2001. a, b
Shupe, M. D., Daniel, J. S., de Boer, G., Eloranta, E. W., Kollias, P., Long, C. N., Luke, E. P., Turner, D. D., and Verlinde, J.: A Focus On Mixed-Phase Clouds, B. Am. Meteorol. Soc., 89, 1549, https://doi.org/10.1175/2008BAMS2378.1, 2008. a
Spek, A. L. J., Unal, C. M. H., Moisseev, D. N., Russchenberg, H. W. J., Chandrasekar, V., and Dufournet, Y.: A New Technique to Categorize and Retrieve the Microphysical Properties of Ice Particles above the Melting Layer Using Radar Dual-Polarization Spectral Analysis, J. Atmos. Ocean. Tech., 25, 482–497, https://doi.org/10.1175/2007JTECHA944.1, 2008. a, b, c
Straka, J. M., Zrnic, D. S., and Ryzhkov, A. V.: Bulk Hydrometeor Classification and Quantification Using Polarimetric Radar Data: Synthesis of Relations, J. Appl. Meteorol., 39, 1341–1372, https://doi.org/10.1175/1520-0450(2000)039<1341:BHCAQU>2.0.CO;2, 2000. a
Unal, C., Dufournet, Y., Otto, T., and Russchenberg, H.: The new real-time measurement capabilities of the profiling TARA radar, in: Article in monograph or in proceedings, ERAD 2012 – 7th European conference on radar in meteorology and hydrology, 24–29 June 2012, Toulouse, France, 2012. a, b, c
Unal, C. M. H. and Moisseev, D. N.: Combined Doppler and Polarimetric Radar Measurements: Correction for Spectrum Aliasing and Nonsimultaneous Polarimetric Measurements, J. Atmos. Ocean. Tech., 21, 443–456, https://doi.org/10.1175/1520-0426(2004)021<0443:CDAPRM>2.0.CO;2, 2004. a
Wang, P. K. and Ji, W.: Collision Efficiencies of Ice Crystals at Low-Intermediate Reynolds Numbers Colliding with Supercooled Cloud Droplets: A Numerical Study, J. Atmos. Sci., 57, 1001–1009, https://doi.org/10.1175/1520-0469(2000)057<1001:CEOICA>2.0.CO;2, 2000. a
Westbrook, C. D., Hogan, R. J., Illingworth, A. J., and O'Connor, E. J.: Theory and observations of ice particle evolution in cirrus using Doppler radar: Evidence for aggregation, Geophys. Res. Lett., 34, L02824, https://doi.org/10.1029/2006GL027863, 2007. a, b, c, d
Yuter, S. E. and Houze, R. A.: Microphysical modes of precipitation growth determined by S-band vertically pointing radar in orographic precipitation during MAP, Q. J. Roy. Meteor. Soc., 129, 455–476, https://doi.org/10.1256/qj.01.216, 2003. a


