the Creative Commons Attribution 4.0 License.
the Creative Commons Attribution 4.0 License.
Effects of black carbon and boundary layer interaction on surface ozone in Nanjing, China
Jinhui Gao
Bin Zhu
Hui Xiao
Hanqing Kang
Chen Pan
Dongdong Wang
Honglei Wang
As an important solar radiation absorbing aerosol, the effect of black carbon (BC) on surface ozone, via reducing photolysis rate, has been widely discussed by “offline” model studies. However, BC–boundary layer (BL) interactions also influence surface ozone. Using the “online” model simulations and process analysis, we demonstrate the significant impact of BC–BL interaction on surface ozone in Nanjing. The absorbing effect of BC heats the air above the BL and suppresses and delays the development of the BL, which eventually leads to a change in surface ozone via a change in the contributions from chemical and physical processes (photochemistry, vertical mixing and advection). For chemical processes, the suppression of the BL leads to large amounts of ozone precursors being confined below the BL which has an increased effect on ozone chemical production and offsets the decrease caused by the reduction of the photolysis rate, thus enhancing ozone chemical formation from 10:00 to 12:00 LT. Furthermore, changes in physical processes, especially the vertical mixing process, show a more significant influence on surface ozone. The weakened turbulence, caused by the suppressed BL, entrains much less ozone aloft down to the surface. Finally, summing-up the changes in the processes, surface ozone reduces before noon and the maximum reduction reaches 16.4 ppb at 12:00 LT. In the afternoon, the changes in chemical process are small which inconspicuously influence surface ozone. However, change in the vertical mixing process still influences surface ozone significantly. Due to the delayed development of the BL, there are obvious ozone gradients around the top of BL. Therefore, high concentrations of ozone aloft can still be entrained down to the surface which offsets the reduction of surface ozone. Comparing the changes in the processes, the change in vertical mixing plays the most important role in impacting surface ozone. Our results highlight the great impacts BC–BL interactions have on surface ozone by influencing the ozone contribution from physical process. This suggests that more attention should be paid to the mechanism of aerosol–BL interactions when controlling ozone pollution.
- Article
(3720 KB) - Full-text XML
-
Supplement
(414 KB) - BibTeX
- EndNote
Black carbon (BC) aerosol, also known as soot, is primarily formed by incomplete combustion of carbonaceous fuels, diesel fuels, and biomass (Bond et al., 2004). BC accounts for a small fraction, less than 15 %, of the total mass concentration of aerosol particles in atmosphere over urban areas (Yang et al., 2011). However, it is of great interest because of its significant influence on global radiation balance (Chameides and Bergin, 2002), both directly, by absorbing solar radiation (Liao and Seinfeld, 2005; Ramanathan and Carmichael, 2008), and indirectly, by affecting cloud formation (Lohmann and Feichter, 1997; Fan et al., 2015). Owing to impacts, such as the abovementioned, on radiation, BC plays an important role in global and regional climate change (Jacobson, 2001; Bond et al., 2013), weather (Qian et al, 2003; Saide et al., 2015), and the atmospheric environment (Li et al., 2005; Ding et al., 2016; Peng et al., 2016). In addition, the BC aging mechanism (Qiu et al., 2012), the performance of BC in heterogeneous reactions (Lei et al., 2004; Li et al., 2012), and its impact on human health (Atkinson et al., 2012) have been the focus of significant research in recent years.
Tropospheric ozone is a typical secondary air pollutant (Crutzen, 1973). It also has important environmental effects on the atmosphere (Monks et al., 2015), especially in the boundary layer (BL). The impact of aerosols, especially BC, on surface ozone has been attracting much attention from researchers. Dickerson et al. (1997) reported that BC decreases surface ozone concentration by reducing photolysis rates. Jacobson (1998) suggested that aerosols containing BC cores reduced photolysis rates and resulted in a decrease of ozone concentration by 5–8 % at ground level in Los Angeles. Castro et al. (2001) found a strong reduction in photolysis rate (10–30 %) due to BC-containing aerosols. They also reported that this photolysis rate reduction led to a decrease of surface ozone in Mexico City. Similar results have been found in other studies simulating the effects of BC on surface ozone in other places around the world (Li et al., 2005, 2011; Tie et al., 2005).
In addition to reducing photolysis rates, the global warming effect of BC is significant, preceded only by CO2 (Jacobson, 2002). Incident solar radiation is absorbed by BC in the atmosphere, leading to the air aloft being heated and the temperature being raised. Conversely, air at low levels is cooled and the temperature is decreased. Under this condition, atmospheric stability is increased and the development of the BL is suppressed during the daytime. Using an atmospheric model, Ding et al. (2016) demonstrated this effect and suggested that such BC–BL interactions would enhance the occurrences of haze pollution episodes. Tie et al. (2017) also discussed the relationships between aerosol (including BC) and BL. Moreover, they highlighted the serious impacts of this mechanism on air quality in winter. Owing to the close relationship between ozone and BL development during the daytime (Zhang and Rao, 1999; Zhu et al., 2015), BC–BL interactions may also influence surface ozone; however, relevant studies on this phenomenon are still lacking.
As one of the most developed regions in China, the Yangtze River Delta (YRD) has reported severe haze (Ding et al., 2013a) and ozone pollution (Tie et al., 2013) in recent decades. Nanjing is the capital of Jiangsu Province, which is an important industrial and economic center in the YRD region. Previous studies have reported that BC (Zhuang et al., 2014) and ozone (Ding et al., 2013b) concentrations are relatively high in Nanjing in October. In this study, measured data of BC and ozone, which were obtained in Nanjing in October 2015, were used to show variations in surface ozone under high BC concentration and low BC concentration conditions during daytime. Furthermore, the fully coupled “online” model system Weather Research and Forecasting with Chemistry (WRF-Chem) was applied to simulate the air pollutants (ozone, PM2.5, and BC) in the YRD in October 2015. With the consideration of the aerosol–BL feedback mechanism in the model system, we demonstrate the BC–BL interaction mechanism affecting surface ozone in Nanjing.
WRF-Chem, which is widely used to evaluate the impacts of aerosols on radiation (Zhang et al., 2010; Forkel et al, 2012), is a fully coupled online 3-D Eulerian chemical transport model considering both chemical and physical processes. We used version 3.4 in this study, and detailed descriptions of the meteorological and chemical aspects of WRF-Chem can be found in Skamarock et al. (2008) and Grell et al. (2005). Regarding simulation settings, two nested domains (Fig. 1) were set up with horizontal resolutions of 36 and 12 km, and grids of 99 × 99 and 99 × 99 for the parent domain (D1) and nested domain (D2), respectively. The parent domain (D1), centered at (119.0∘ E, 31.5∘ N), covered most of China and the surrounding countries and ocean. The corresponding simulations provided meteorological and chemical boundary conditions for the nested domain (D2), which covered most of eastern China.
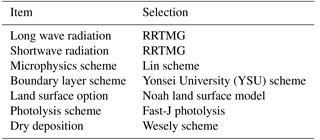
There were 38 vertical layers from the surface up to a pressure limit of 50 hPa, 12 levels of which were located below the lowest 2 km to fully describe the vertical structure of the BL. Carbon Bond Mechanism Z (CBM-Z), which includes 133 chemical reactions for 53 species and extends the framework to function for a longer time and at larger spatial scales than its predecessor; Carbon Bond IV, was used as the gas-phase chemical mechanism (Zaveri and Peters, 1999). The corresponding aerosol chemical mechanism was the Model for Simulating Aerosol Interactions and Chemistry (MOSAIC) with eight bins (Zaveri et al., 2008), which is extremely efficient and does not compromise accuracy in aerosol model calculations. Other major model configuration options are listed in Table 1.
The National Centers for Environmental Prediction (NCEP) final (FNL) Operational Global Analysis data files were used to provide the initial and boundary meteorological conditions for our simulations. The initial and boundary chemistry conditions were provided by the output of the Model of Ozone and Related Chemical Tracers (MOZART-4; Emmons et al., 2010). Both anthropogenic and natural emissions were inputted into the model system. Anthropogenic emissions were derived from the Multi-resolution Emission Inventory for China (MEIC) database (http://www.meicmodel.org/, last access: 8 May 2018). MEIC contains both gaseous and aerosol species, including SO2, NOx, NH3, CO, VOCs (volatile organic compounds), BC, OC (organic carbon), PM10, and PM2.5. Biogenic emissions were calculated using the Model of Emission of Gas and Aerosols from Nature (MEGAN; Guenther et al., 2006).
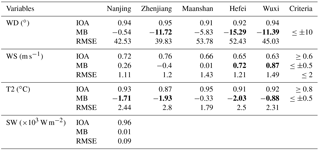
Table 2Statistical metrics for meteorological variables from 10 to 26 October 2015. The benchmarks follow the recommended values reported by Emery et al. (2001). The values that do not meet the criteria are denoted in bold.
Two parallel experiments were conducted to investigate our subject: (1) simulation with aerosol feedback considering both the direct and indirect radiation effects from all chemical species (Exp_WF), in which aerosol optical properties were calculated at each time step and then coupled with the radiative transfer model for both shortwave and long wave radiation (Iacono et al, 2008); (2) simulation with aerosol feedback, excluding BC (Exp_WFexBC), in which only the optical property of BC was subtracted when calculating the shortwave radiation and optical properties of all other aerosols were retained and calculated in the same manner as in experiment EXP_WF (Wang et al., 2016). The two experiments started at 00:00 LT on 1 October 2015 and ended at 00:00 LT on 26 October 2015. In order to reduce the influence of initial conditions, the first nine days were designated as the spin-up period.
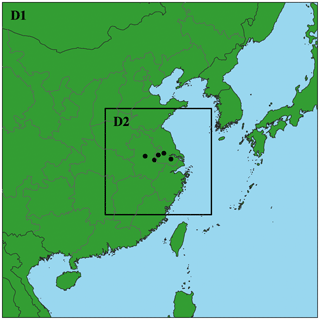
Figure 1Map of the two model domains. The locations of the observation sites used for model evaluation are presented as dots. From west to east, the sites are located in Hefei, Maanshan, Nanjing, Zhenjiang, and Wuxi.
We collected observational data on both meteorology (temperature, wind direction, and wind speed) and air pollutants (Ozone, NO2, and PM2.5) in five cities (Hefei, Maanshan, Nanjing, Zhejiang, and Wuxi, Fig. 1) in October 2015 to evaluate the model performance. Temperature, wind direction, and wind speed, with a temporal resolution of 3 h, were obtained from Meteorological Information Comprehensive Analysis and Process System (MICAPS). These data were measured by the national surface observation network operated by the China Meteorological Administration (CMA). Data on the hourly concentrations of Ozone, NO2, and PM2.5 were downloaded from the publishing website of the China National Environmental Monitoring Center (http://113.108.142.147:20035/emcpublish, last access: 20 April 2018). These air pollutants and three other pollutants (SO2, PM10, and CO) were measured by the national air quality monitoring network operated by the Ministry of Environmental Protection of China. The China National Environmental Monitoring Center is responsible for ensuring data quality. More information on the air pollution measurements is available in Wang et al. (2014). In addition, measurements of shortwave irradiance and BC concentrations in the northern suburb of Nanjing (near the ozone monitoring site) were taken. Shortwave irradiance was measured using a pyranometer (MS-802F of EKO instrument, Japan). The measurement accuracy is 1 W m−2 and the temporal resolution is 1 min. More information is available in the instrument manual (https://eko-eu.com/files/PyranometerManual20160926V11.pdf, last access: 10 December 2017). Hourly concentrations of BC were measured by using an Aethalometer (model AE-33 of Magee Scientific, USA). The sampling time interval was set to 1 min and the inlet flow was set to 5 L min−1. More information is available in Drinovec et al. (2015).
3.1 Model evaluation
To evaluate model performance, the measured and simulated variables from 10 to 26 October 2015 were compared (Fig. 2a, b). In addition, shortwave radiation and BC concentration data observed in Nanjing were used to evaluate the corresponding model predictions.
3.1.1 Meteorology evaluation
Regarding meteorological factors (Fig. 2a), which highly impact transport, deposition, and transformation in the atmosphere (Li et al., 2008), good performance of meteorological conditions will guarantee accuracy in the air pollutant simulations. In this study, the observed temperature, wind direction, and wind speed were used for evaluating the meteorological model. In addition, the shortwave irradiance measured in Nanjing was also used to evaluate the simulation of shortwaves. Model performance statistics, including index of agreement (IOA), mean bias (MB), and the root mean square error (RMSE), are shown in Table 2, along with benchmarks derived from Emery et al. (2001). The IOA of wind direction (WD) was based on the calculation suggested by Kwok et al. (2010), which considers the nature of WD. The other abovementioned performance statistics were calculated following the approach of Lu et al. (1997).
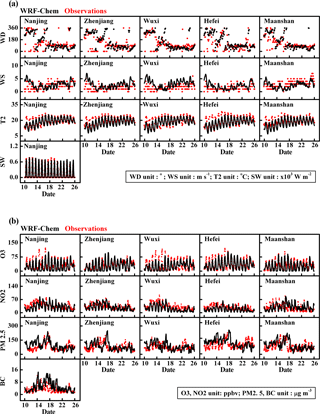
Figure 2(a) Time series comparisons of meteorological variables between observations and simulations from 10 to 26 October 2015. (WD is wind direction; WS is wind speed; T2 is temperature at 2 m above the surface; and SW is shortwave). (b) Same as Fig. 2a but for chemical variables (O3 is ozone; NO2 is nitrogen dioxide; PM2.5 is particulate matter with diameter less than or equal to 2.5 µm; and BC is black carbon).
WD showed similar patterns between the simulation and observations, but the MB values of WD in Zhenjiang, Hefei, and Wuxi were beyond the benchmark. However, the high values of IOA showed good agreement, indicating that the simulation successfully captured the wind direction during the period. Wind speed (WS) showed a slight overestimation in Hefei and Wuxi with positive MBs of 0.72 and 0.87. Furthermore, the WS statistics are acceptable, especially IOAs and RMSEs, which are within the scope of the benchmarks. The negative MBs of temperature at 2 m above the surface (T2) indicate that the model predictions slightly underestimated T2. High values of IOAs in these cities indicate acceptable agreements between measurements and simulations. The shortwave radiation (SW) time series showed similar patterns between the simulation and measurements in Nanjing. The high IOAs and low biases (MB and RMSE) suggest satisfactory model performance on SW, which is very important for the determination of photochemistry and the BC feedback mechanism.
3.1.2 Air pollutant evaluation
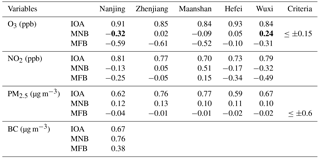
Measured hourly concentrations of O3, NO2, and PM2.5 in the five cities were collected to evaluate the model performance on air pollutants. In addition, hourly BC concentrations measured in Nanjing were also used for evaluating the BC simulation. Statistical metrics on air pollutants, which include IOA, mean normalized bias (MNB), and mean fractional bias (MFB), are shown in Table 3, along with benchmarks derived from EPA (2005, 2007).
For ozone, MNBs in Nanjing and Wuxi were slightly beyond the benchmarks. However, the time series shows similar patterns between the simulation and measurements (Fig. 2b), reflected by the high values of IOA. As an important ozone precursor, a good model performance on NO2 is necessary. More than 0.7 of the IOA values reflect the good agreement between measurements and simulations. The values of MNBs and MFBs are close to those of other studies in this region in October (Hu et al., 2016). Owing to its complex chemical composition, accurate simulation of PM2.5 was difficult. The IOA values of PM2.5 were lower than those of O3; however, MFBs were within the benchmarks, indicating that the model predictions of PM2.5 are acceptable. For the BC time series, similar patterns were found between the simulation and observation. Considering that the MFB was within the benchmarks for PM2.5 and the relevant high value of the IOA (0.67), the model predictions of BC were deemed acceptable.
In general, based on the comparisons between measurements and simulations of both meteorology and air pollutants, the similar time series patterns and acceptable statistical results demonstrate the good simulation capability of the model system in capturing the meteorological and chemical features. In this case, the meteorological and chemical features in eastern China from 10 to 26 October 2015 were well reproduced, which is favorable for our analysis and discussions.
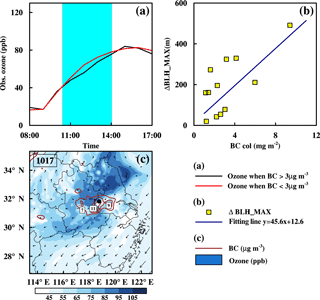
Figure 3(a) Observational averaged ozone concentrations with BC concentrations lower (red) and higher (black) than the monthly mean value during October 2015. (b) Simulated maximum BLH changes (yellow squares) induced by BC. (c) Average distribution of surface BC (red contour) and ozone concentrations (blue color fill), showing wind fields from 10:00 to 14:00 LT on 17 October 2015. Black dot denotes the location of the observation site.
3.2 Observational and model results of BC and ozone
Analyzing relevant observation data, ozone and BC concentrations on sunny days were selected. Subsequently, ozone concentrations were distributed into two sets based on the daytime mean BC concentrations being higher (black) and lower (red) than the monthly mean concentration (∼ 3 µg m−3). When the BC concentration was higher (Fig. 3a), the increase in ozone concentrations occurred later than when BC was lower during the 10:00 to 14:00 period. At 12:00 LT, the difference between the two patterns of ozone concentrations reached its maximum value. Because of the limited measurements, the formation of changes in ozone and the relationship between the BC–BL interaction and surface ozone could not be validated. In this case, numerical simulations using the online coupled chemistry transport model WRF-Chem provided an effective method to analyze and discuss this subject.
With the application of WRF-Chem, Ding et al. (2016) reported the suppression of the BL development induced by the warming effects of BC. By analyzing our model outputs, the maximum changes in the mean BL height (ΔBLH_MAX) over Nanjing were calculated. ΔBLH_MAX is defined as the maximum difference in the hourly mean boundary layer height (BLH) over Nanjing between Exp_WFexBC and Exp_WF during morning (Eq. 1):
In Eq. (1), is the mean boundary layer height over Nanjing. The simulated mean BC columns (from the surface to 2 km) over Nanjing, during the occurrence of ΔBLH_MAX, were also calculated. The relationship between the two variables is shown in Fig. 3b. In a similar fashion to Ding's study, the positive values suggest that BL development is suppressed by the warming effect of BC. This effect is more significant at higher BC concentrations. For example, the BC column was more than 9 mg m−2 on 17 October and the ΔBLH_MAX was more than 400 m. Owing to the significant impact of BC on the BL in this case, we took the model result of 17 October as an example to study the relationship between surface ozone, BC, and BL development. From 10:00 to 14:00 LT on 17 October, the average distribution (Fig. 3c) of BC concentrations was inhomogeneous due to the inhomogeneous distribution of BC emissions (Qin and Xie, 2012) and wind fields at ground level. The northern areas were controlled by southerly winds, whereas northeast winds blew over the southern areas. In the central areas (most parts of Jiangsu and Anhui), winds were weak, which is favorable for the accumulation of air pollutants. BC was therefore mainly concentrated in Nanjing and the surrounding areas. Conversely, surface ozone displayed low concentrations over this region, suggesting that BC and ozone at ground level exhibit opposite distributions over Nanjing.
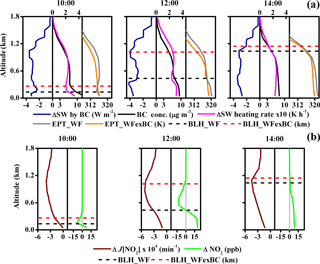
Figure 4(a) Vertical distributions of averaged BC concentrations (black line; unit: µg m−3), attenuation of incident shortwave radiation induced by BC (blue line; unit: W m−2), change of shortwave heating rate induced by BC (magenta line: unit: K h−1), and equivalent potential temperature (EPT; unit: K) of the two experiments (dark grey line for Exp_WF and orange line for Exp_WFexBC). (b) Average changes in J[NO2] (brown line; unit: min−1) and NO2 (green line; unit: ppb) induced by BC in Nanjing at 10:00, 12:00 and 14:00 LT. BLHs of the two experiments (black and red dashed line denote BLH in Exp_WF and Exp_WFexBC, respectively) are presented in both (a) and (b).
3.3 The BC–BL interaction and its effects on photolysis rate and ozone precursors
Because of the solar radiation absorption of BC in the atmosphere, the incident shortwave radiation is attenuated. Consequently, other meteorological elements are affected. Figure 4a presents the vertical profiles of BC concentration (black solid line) and changes in related meteorological elements (Exp_WF−Exp_WFexBC) induced by BC at 10:00, 12:00, and 14:00 LT. Once emitted from surface (Qin and Xie, 2012), BC concentration in the BL is normally higher than that above the boundary layer where the so-called residual layer is positioned in the morning. However, the lower concentrations of BC aloft could also significantly influence the meteorological elements. The vertical profiles of the atmospheric attenuation of shortwave radiation (SW; blue solid line), which is defined as the gradual vertical loss in intensity of the incident solar radiation induced by BC, showed a small reduction above 1.2 km. Shortwave radiation also increased with as BC increased downwards. A greater reduction in shortwave radiation could be observed at a height of 1 km than at the lower adjacent level. This suggests that, when BC concentrations are similar in adjacent layers, solar radiation absorption of BC is more efficient at higher altitudes than that at lower altitudes (Ferrero et al., 2014; Ding et al., 2016). It should also be noted that when BC concentrations are sufficiently high, large amounts of BC absorb more shortwave radiation; hence, the attenuation of shortwave radiation displayed a second peak below the height of 600 m in this study. Furthermore, owing to the absorption of solar radiation induced by BC, the heating rate of shortwave increased correspondingly. The significant shortwave absorption in the residual layer led to a greater increase in heating rate (magenta solid line), which caused a consistent heating effect on air aloft (Fig. 4a 10:00 and 12:00 LT). In this case, it was favorable to form the temperature inversion which showed that the equivalent potential temperature (EPT; grey solid line) in Exp_WF was lower at the top of the BL (black dashed line) than that in the residual layer. The temperature inversion increased the atmospheric stability and suppressed and delayed the development of the BL (black dashed line) at 10:00 and 12:00 LT. Conversely, the EPT in Exp_WFexBC (orange solid line) did not exhibit this behavior and the BL (red dashed line) developed rapidly, reaching 1 km in altitude by 12:00 LT. At 14:00 LT, the BL in Exp_WFexBC was almost fully developed, whereas the BL in Exp_WF was still developing and rising close to the BL in Exp_WFexBC.
As one of the most important ozone precursors, the photolysis of NO2 directly contributes to the chemical formation of tropospheric ozone. Due to the attenuation of incident solar radiation induced by BC, the photolysis rate of NO2 was reduced in the daytime (ΔJ[NO2]; brown solid line in Fig. 4b), which is consistent with the results from previous studies (Dickerson et al., 1997; Li et al., 2005). NO2 in the atmosphere is primarily formed through chemical production or is directly emitted from surface sources (e.g., industry, transportation, and soil) and is usually confined in BL. As a result of the BL suppression caused by BC, more NO2 is confined below the BL, as shown in Fig. 4b (ΔNO2; green solid line). Similarly to NO2, other ozone precursors (e.g., NO, VOCs) also showed the same variations in vertical distribution (Supplement Fig. S1). The chemical production of tropospheric ozone is affected by both photolysis rate and the concentrations of precursors (Crutzen, 1973; Tie et al., 2009). When only considering the photolysis rate, the reduction of J[NO2] will weaken the photochemistry and reduce ozone concentration. When considering the mechanism of the BC–BL interactions at the same time, however, the concentrations of ozone precursors will change which also influences the ozone chemical production. The results may consequently be different from previous studies which only consider the effects of photolysis rate reduction. In addition, the suppressed BL could also affect physical processes in the BL, which will therefore influence surface ozone. Quantitative changes in ozone contributions from chemical and physical processes will be discussed in the following section.
3.4 Changes in surface ozone resulting from BC–BL interaction
Since variations in ozone concentration are directly caused by physical and chemical processes (Zhu et al., 2015), the fact that BC–BL interactions affect the ozone concentration can be discussed using process analysis. The following processes were considered in this work: (1) advection (ADV) caused by transport, which is highly related to wind and ozone concentration gradients from upwind areas to downwind areas; (2) vertical mixing (VMIX) caused by atmospheric turbulence and vertical gradients of ozone concentration, which is closely related to the development of, and variations in, the BL (Zhang and Rao, 1999; Gao et al., 2017); and (3) chemistry (CHEM), which is the result of chemical calculation including ozone chemical production and chemical reduction. Convection process, i.e., the ozone contribution caused by convection movements, was negligible in this case, and is not mentioned further in this paper. Complete details on the process analysis of WRF-Chem are available in Zhang et al. (2014), Gao et al. (2016), and in the WRF-Chem user guide.
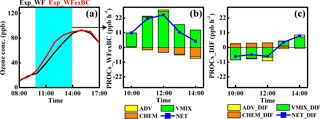
Figure 5(a) Time series of simulated ozone concentration (unit: ppb) from 08:00 to 17:00 LT. (b) Hourly process contributions in the Exp_WFexBC experiment from 10:00 to 14:00 LT. (c) Variations in process contributions caused by BC–BL interactions (Exp_WF − Exp_WFexBC) from 10:00 to 14:00 LT. Cyan shades in (a) highlight the ozone differences induced by BC. In (b) ADV is advection, VMIX is vertical mixing, and CHEM is chemistry, and the blue line with squares denotes the net value of the processes (NET). In (c) variations in each process and the net contribution are denoted by ADV_DIF, VMIX_DIF, CHEM_DIF, and NET_DIF. Units in (b) and (c) are ppb h−1.
As shown in Fig. 5a, the simulated surface ozone concentrations in Exp_WF and Exp_WFexBC were similar, below 20 ppb before 10:00 LT, and increased slowly. From 10:00 LT, the surface ozone concentrations in both cases started to increase rapidly. However, owing to the impacts of BC, ozone in Exp_WF increased more slowly than that in Exp_WFexBC which displayed ozone reduction. At 12:00 LT, the ozone reduction reached a maximum value of 16.4 ppb. From 12:00 to 14:00 LT, the increasing trend of ozone in Exp_WFexBC slowed which reduced the difference in ozone between the two cases. After 14:00 LT, there was no significant differences between the two ozone patterns. By analyzing the process contributions of ozone in Exp_WFexBC (Fig. 5b), VMIX contributed the most whereas ADV contributed the least to surface ozone from 10:00 to 14:00 LT. The result of the three processes, also denoted as the net contribution of ozone (NET), shows the hourly variation of the ozone concentration. In Fig. 5b, the significant positive contributions of VMIX and the consistence in the variations of VMIX and NET suggested that vertical mixing processes were mainly responsible for the increase in ozone in Exp_WFexBC. Because of BC, ozone contributions from chemical and physical processes changed at the surface; this information (Exp_WF−Exp_WFexBC) is presented in Fig. 5c. From 10:00 to 12:00 LT, changes in the chemical contribution (CHEM_DIF) increased at a rate of 3.1 ppb h−1. However, changes in VMIX contribution (VIMX_DIF) decreased more significantly with a rate of −8.2 ppb h−1. NET_DIF in this study indicated that the hourly change of ozone concentration is caused by the impacts of BC. Thus, the negative values of NET_DIF from 10:00 to 12:00 LT suggested that surface ozone reduced continuously. In the afternoon (13:00 to 14:00 LT), the CHEM_DIF was near zero which seemed to have little influence on the change of surface ozone. However, VMIX in Exp_WF was enhanced (VMIX_DIF is positive) which led to a NET_DIF change from negative to positive. Further, the positive NET_DIF indicated that the reduction in surface ozone was offset which was because the increasing trend of surface ozone in Exp_WFexBC slowed down during this period.
Among all the changes in the contributions from processes, VMIX_DIF accounted for more than 50 % of NET_DIF, indicating that change in the ozone contribution from vertical mixing was the key factor impacting surface ozone in this study. In addition, J[NO2] was reduced by BC but changes in CHEM at surface increased before noon. A reduction in the photolysis rate should reduce the chemical production of ozone; however, changes in ozone precursors will also influence the chemical production of ozone. As Fig. S2 shows, due to the suppression of the BL, the concentrations of both NOx and VOCs increased at surface. The ratios of VOCs ∕ NOx also increased which suggested that VOCs increased more significantly than NOx did. In addition, the small change in the ratio of HCHO ∕ NOy indicated that ozone still formed under VOC-limited conditions. In this case, the more significant increase of VOCs was favorable for ozone chemical production. Thus, it could be concluded that the enhancement of the contributions from chemistry was highly related to the increase of ozone precursors.
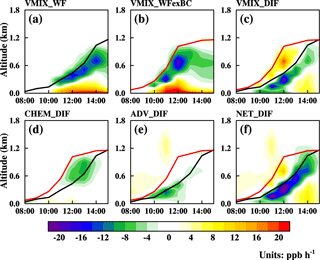
Figure 6Vertical distribution of ozone contribution from the vertical mixing process in Exp_WF (a) and Exp_WFexBC (b). Changes of VMIX (VMIX_DIF; c), CHEM (CHEM_DIF; d), and ADV (ADV_DIF; e) between the two experiments, and the net value of the changes from all processes (NET_DIF; f) from 08:00 to 15:00 LT. Units are ppb h−1. The black and red lines denote the BLH in Exp_WF and Exp_WFexBC.
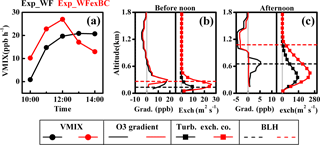
Figure 7(a) Time series of vertical mixing contribution (line with circles; unit: ppb h−1) from 10:00 to 14:00 LT and profiles of ozone vertical gradients (solid lines; unit: ppb) and turbulence exchange coefficient (line with squares; unit: m2 s−1) in Exp_WF (black) and Exp_WFexBC (red) before noon (b) and in the afternoon (c). BL heights (BLH; dashed line; unit: km) of Exp_WF and Exp_WFexBC are denoted in (b) and (c).
The development of the BL directly affects vertical mixing process and the distribution of ozone in the BL (Zhang and Rao, 1999). Herein, the distributions of VMIX contributions with and without the effects of BC are shown in Fig. 6a, b. The BLH with (black line) and without (red line) the impacts of BC are also presented in Fig. 6. In general, ozone concentration increases with height before sunrise and in the early morning over polluted regions (Wang et al., 2015). When the BL developed in the morning, ozone was exchanged by turbulence in the vertical direction resulting in the entrainment of the abundant ozone aloft down to the surface and the increase of surface ozone concentrations. Therefore, VMIXs in both cases showed positive values in lower layer and negative values in upper layer. Differences in VMIX (VMIX_DIF) between Exp_WF and Exp_WFexBC showed the changes in ozone contribution from vertical mixing caused by BC and the vertical distribution of VMIX_DIF is shown in Fig. 6c. With the effects of BC, the suppressed BL weakened turbulence which led to reduced vertical exchange of ozone from 10:00 to 12:00 LT. Thus, the VMIX_DIF showed negative values in the lower layer and positive values in the upper layer. After 12:00 LT, the BL in Exp_WFexBC was fully developed and VMIX became weak. By contrast, the BL in Exp_WF was still developing during this period. Under these conditions, VMIX was not weakened or even larger than that in Exp_WFexBC. Thus, VMIX_DIF showed positive values in lower layers and negative values in upper layers.
Similarly to the VMIX_DIF, changes in ozone contribution from chemistry (CHEM_DIF) are presented in Fig. 6d. The chemical production of ozone is related to both photolysis rate and ozone precursors. As discussed above, the BC–BL interaction leads to reduced photolysis rates but also to more accumulation of ozone precursors at surface. The reduction of photolysis rate will surely decrease photochemical rate; however, the increase of ozone precursors at the surface may offset the influence of the reduction in photolysis rate and enhance the chemical production of ozone. Thus, enhanced chemical contribution could be seen near the surface (with a positive CHEM_DIF of 3 ppb h−1) from 10:00 to 12:00 LT. In the residual layer, contrary to the situation near the surface, less ozone precursors being transported up owing to the suppression of BL (Fig. 4b and S1) and the reduction of photolysis rate (Fig. 4b) led to a decreased chemical contribution (with a negative CHEM_DIF between −9.4 and −2.1 ppb h−1) from 11:00 to 14:00 LT. Owing to the effects of BC, the contribution of ADV decreased slightly within the BL before noon (Fig. 6e). In Fig. 6f, NET_DIF, the result of VMIX_DIF, CHEM_DIF, and ADV_DIF, represents the hourly change of ozone concentrations caused by the impacts of BC. Comparing Fig. 6c–f, the similar distributions and the significant ratio of VMIX_DIF to NET_DIF suggest that the change in the ozone contributions from vertical mixing induced by BC had the greatest influence on surface ozone.
Due to BC–BL interactions, VMIX in Exp_WF is weakened before noon but enhanced in the afternoon (Fig. 7a). The contribution of VMIX depends on the vertical gradients (the difference of ozone concentrations between every two adjacent vertical layers) of ozone and the turbulent exchange coefficient. In Fig. 7b, vertical gradients of ozone (solid lines) showed similar profiles in both experiments during the early stage of BL development before noon. In the afternoon, the ozone gradient (red solid line in Fig. 7c) decreased significantly without the effects of BC in the mature stage of BL development, whereas the ozone gradient remained large around the top of the BL owing to the effects of BC (black line in Fig. 7c). The effects of BC can lead to a significantly smaller turbulence exchange coefficient (black line with square in Fig. 7b), lowering the entrainment of ozone from higher altitudes to the surface, which indicated that VMIX in Exp_WF was smaller before noon. In the afternoon, the faster developing BL without the effects of BC formed a uniformly mixed ozone profile, with very small vertical gradients. As a result, the contribution of VMIX in Exp_WFexBC was smaller, although the turbulence exchange coefficient was still large. In contrast, with the impacts of BC, larger ozone gradients around the top of the BL resulted in stronger entrainment of ozone down to the surface which led to the ozone contribution of VMIX in Exp_WF becoming larger at surface.
In this study, measured data of BC and ozone in Nanjing, an important industrial and economic center in the YRD region of China, showed that ozone concentration increased slowly from 10:00 to 14:00 LT when the BC concentration was relevantly high. With the application of WRF-Chem model, we studied the impacts of BC–BL interactions on surface ozone in Nanjing. Acceptable agreement was achieved between observed and simulated results for both meteorological and chemical variables, suggesting that the WRF-Chem model has the capability to accurately reproduce meteorological factors and air pollutants in this study.
The model results showed that, when high concentrations of BC were confined over Nanjing, the incident solar radiation was absorbed. The absorbed radiation heated the air above the BL, suppressed and delayed the development of the BL. Because of the BL suppression, it caused the changes in the ozone contributions from chemical and physical processes (photochemistry, vertical mixing and advection). In particular, BL suppression led to more ozone precursors (e.g., NOx and VOCs) being confined below the BL. Although the photolysis rate was reduced as a result of the solar radiation absorption induced by BC, more ozone precursors enhanced the contributions from chemistry before noon. However, as a more significant factor, the suppressed BL weakened the turbulence and entrained less ozone aloft down to the surface which reduced the contributions from vertical mixing process. As a result, surface ozone decreased before noon, with the maximum reduction reaching 16.4 ppb at 12:00 LT. In the afternoon, the changes in the chemical processes were small which inconspicuously influenced surface ozone. However, the vertical mixing process still significantly influenced the surface ozone. Due to the delay in the BL development, the vertical ozone structure showed obvious vertical gradients around the top of the BL, and the high concentration of ozone aloft could be entrained down to the surface to offset the surface ozone reduction before noon.
Comparing the changes in the contributions from the chemical and physical processes induced by the effects of BC, the change in vertical mixing process which was caused by BL suppression played a more important role in influencing surface ozone. Our results highlight the great impacts of BC–BL interactions on surface ozone via its influence on ozone contribution from physical processes, which suggests that more attention should be paid to the mechanism of aerosol–BL interactions when controlling ozone pollution in China.
All observations and model outputs used in this study are available. Readers can access the data directly or by contacting Bin Zhu via binzhu@nuist.edu.cn.
The supplement related to this article is available online at: https://doi.org/10.5194/acp-18-7081-2018-supplement.
The authors declare that they have no conflict of interest.
This work was supported by grants from the National Key Research and
Development Program of China (2016YFA0602003), National Natural Science
Foundation of China (91544229). All the model results in this study were
calculated using computational resources provided by the Nanjing University of
Information Science & Technology (NUIST). The observational data used in
this paper for temperature, wind direction, and wind speed can be
accessed from the website http://data.cma.cn/. Hourly concentrations of
O3, NO2, and PM2.5 can be downloaded from
http://113.108.142.147:20035/emcpublish. The shortwave irradiance and BC
concentrations can be accessed from the Comprehensive Meteorological
Observation Base in Nanjing, which is attached to the CMA, by sending an
application and receiving permission. All observations and model
outputs used in this study are available. Readers can access the data
directly or by contacting Bin Zhu via binzhu@nuist.edu.cn.
Edited by: Aijun Ding
Reviewed by: two anonymous referees
Atkinson, R. W., Cohen, A., Mehta, S., and Anderson, H. R.: Systematic review and meta-analysis of epidemiological time-series studies on outdoor air pollution and health in Asia, Air Quality, Atmosphere & Health, 5, 383–391, https://doi.org/10.1007/s11869-010-0123-2, 2012.
Bond, T. C., Streets, D. G., Yarber, K. F., Nelson, S. M., Woo, J. H., and Klimont, Z.: A technology-based global inventory of black and organic carbon emissions from combustion, J. Geophys. Res., 109, D14203, https://doi.org/10.1029/2003JD003697, 2004.
Bond, T. C., Doherty, S. J., Fahey, D. W., Forster, P. M., Berntsen, T., DeAngelo, B. J., Flanner, M. G., Ghan, S., Karcher, B., Koch, D., Kinne, S., Kondo, Y., Quinn, P. K., Sarofim, M. C., Schultz, M. G., Schulz, M., Venkataraman, C., Zhang, H., Zhang, S., Bellouin, N., Guttikunda, S. K., Hopke, P. K., Jacobson, M. Z., Kaiser, J. W., Klimont, Z., Lohmann, U., Schwarz, J. P., Shindell, D., Storlvmo, T., Warren, S. G., and Zender, C. S.: Bounding the role of black carbon in the climate system: A scientific assessment, J. Geophys. Res.-Atmos., 118, 5380–5552, https://doi.org/10.1002/jgrd.50171, 2013.
Castro, T., Madronich, S., Rivale, S., Muhlia, A., and Mar, B.: The influence of aerosols on photochemical smog in Mexico City, Atmos. Environ., 35, 1765–1772, 2001.
Chameides, W. L. and Bergin, M.: Soot takes center stage, Science, 297, 2214–2215, 2002.
Crutzen, P. J.: A discussion of the chemistry of some minor constituents in the stratosphere and troposphere, Pure Appl. Geophys., 106, 1385–1399, https://doi.org/10.1007/BF00881092, 1973.
Dickerson, R. R., Kondragunta, S., Stenchikov, G., Civerolo, K. L., Doddridge, B. G., and Holben, B. N.: The impact of aerosols on solar ultraviolet radiation and photochemical smog, Science, 278, 827–830, https://doi.org/10.1126/science.278.5339.827, 1997.
Ding, A. J., Huang, X., Nie, W., Sun, J. N., Kerminen, V. M., Petaja, T., Su, H., Cheng, Y. F., Yang, X. Q., Wang, M. H., Chi, X. G., Wang, J. P., Virkkula, A., Guo, W. D., Yuan, J., Wang, S. Y., Zhang, R. J., Wu, Y. F., Song, Y., Zhu, T., Zilitinkevich, S., Kulmala, M., and Fu, C. B.: Enhanced haze pollution by black carbon in megacities in China, Geophys. Res. Lett., 43, https://doi.org/10.1002/2016GL067745, 2016.
Ding, A. J., Fu, C. B., Yang, X. Q., Sun, J. N., Petäjä, T., Kerminen, V.-M., Wang, T., Xie, Y., Herrmann, E., Zheng, L. F., Nie, W., Liu, Q., Wei, X. L., and Kulmala, M.: Intense atmospheric pollution modifies weather: a case of mixed biomass burning with fossil fuel combustion pollution in eastern China, Atmos. Chem. Phys., 13, 10545–10554, https://doi.org/10.5194/acp-13-10545-2013, 2013a.
Ding, A. J., Fu, C. B., Yang, X. Q., Sun, J. N., Zheng, L. F., Xie, Y. N., Herrmann, E., Nie, W., Petäjä, T., Kerminen, V.-M., and Kulmala, M.: Ozone and fine particle in the western Yangtze River Delta: an overview of 1 yr data at the SORPES station, Atmos. Chem. Phys., 13, 5813–5830, https://doi.org/10.5194/acp-13-5813-2013, 2013b.
Drinovec, L., Mocnik, G., Zotter, P., Prévôt, A. S. H., Ruckstuhl, C., Coz, E., Rupakheti, M., Sciare, J., Müller, T., Wiedensohler, A., and Hansen, A. D. A.: The “dual-spot” Aethalometer: an improved measurement of aerosol black carbon with real-time loading compensation, Atmos. Meas. Tech., 8, 1965–1979, https://doi.org/10.5194/amt-8-1965-2015, 2015.
Emery, C., Tai, E., and Yarwood, G.: Enhanced meteorological modeling and performance evaluation for two Texas ozone episodes, in: Prepared for the Texas Natural Resource Conservation Commission, ENVIRON International Corporation, Novato, CA, USA, 2001.
Emmons, L. K., Walters, S., Hess, P. G., Lamarque, J.-F., Pfister, G. G., Fillmore, D., Granier, C., Guenther, A., Kinnison, D., Laepple, T., Orlando, J., Tie, X., Tyndall, G., Wiedinmyer, C., Baughcum, S. L., and Kloster, S.: Description and evaluation of the Model for Ozone and Related chemical Tracers, version 4 (MOZART-4), Geosci. Model Dev., 3, 43–67, https://doi.org/10.5194/gmd-3-43-2010, 2010.
EPA, U.S.: Guidance on the Use of Models and Other Analyses in Attainment Demonstrations for the 8-hour Ozone NAAQS, EPA-454/R-05-002, 2005.
EPA, U.S.: Guidance on the Use of Models and Other Analyses for Demonstrating Attainment of Air Quality Goals for Ozone, PM2.5, and Regional Haze, EPA-454/B-07-002, 2007
Fan, J., Rosenfeld, D., Yang, Y., Zhao, C., Leung, L. R., and Li, Z.: Substantial contribution of anthropogenic air pollution to catastrophic floods in Southwest China, Geophys. Res. Lett., 42, https://doi.org/10.1002/2015GL064479, 2015.
Ferrero, L., Castelli, M., Ferrini, B. S., Moscatelli, M., Perrone, M. G., Sangiorgi, G., D'Angelo, L., Rovelli, G., Moroni, B., Scardazza, F., Mocnik, G., Bolzacchini, E., Petitta, M., and Cappelletti, D.: Impact of black carbon aerosol over Italian basin valleys: high-resolution measurements along vertical profiles, radiative forcing and heating rate, Atmos. Chem. Phys., 14, 9641–9664, https://doi.org/10.5194/acp-14-9641-2014, 2014.
Forkel, R., Werhahn, J., Hansen, A. B., McKeen, S., Peckham, S., Grell, G., and Suppan, P.: Effect of aerosol-radiation feedback on regional air quality – A case study with WRF/Chem, Atmos. Environ., 53, 202–211, 2012.
Gao, J., Zhu, B., Xiao, H., Kang, H., Hou, X., and Shao, P.: A case study of surface ozone source apportionment during a high concentration episode, under frequent shifting wind conditions over the Yangtze River Delta, China, Sci. Tot. Environ., 544, 853–863, https://doi.org/10.1016/j.scitotenv.2015.12.039, 2016.
Gao, J., Zhu, B., Xiao, H., Kang, H., Hou, X., Yin, Y., Zhang, L., and Miao, Q.: Diurnal variations and source apportionment of ozone at the summit of Mount Huang, a rural site in Eastern China, Environmental Pollution, 222, 513–522, 2017.
Grell, G. A., Peckham, S. E., Schmitz, R., Mckeen, S. A., Frost, G., Skamarock, K., and Eder, B.: Fully coupled “online” chemistry within the WRF model, Atmos. Environ., 39, 6957–6975, 2005.
Guenther, A., Karl, T., Harley, P., Wiedinmyer, C., Palmer, P. I., and Geron, C.: Estimates of global terrestrial isoprene emissions using MEGAN (Model of Emissions of Gases and Aerosols from Nature), Atmos. Chem. Phys., 6, 3181–3210, https://doi.org/10.5194/acp-6-3181-2006, 2006.
Hu, J., Chen, J., Ying, Q., and Zhang, H.: One-year simulation of ozone and particulate matter in China using WRF/CMAQ modeling system, Atmos. Chem. Phys., 16, 10333–10350, https://doi.org/10.5194/acp-16-10333-2016, 2016.
Iacono, M. J., Delamere, J. S., Mlawer, E. J., Shephard, M. W., Clough, S. A., and Collins, W. D.: Radiative forcing by long-lived greenhouse gases: Calculations with the AER radiative transfer models, J. Geophys. Res., 113, D13103, https://doi.org/10.1029/2008JD009944, 2008.
Jacobson, M. Z.: Studying the effects of aerosols on vertical photolysis rate coefficient and temperature profiles over an urban airshed, J. Geophys. Res., 103, 10593–10604, https://doi.org/10.1029/98JD00287, 1998.
Jacobson, M. Z.: Strong radiative heating due to the mixing state of black carbon in atmospheric aerosols, Nature, 409, 695–697, https://doi.org/10.1038/35055518, 2001.
Jacobson, M. Z.: Control of fossil-fuel particulate black carbon and organic matter, possibly the most effective method of slowing global warming, J. Geophys. Res., 107, D19, https://doi.org/10.1029/2001JD001376, 2002.
Kwok, R. H. F., Fung, J. C. H., Lau, A. K. H., and Fu, J. S.: Numerical study on seasonal variations of gaseous pollutants and particulate matters in Hong Kong and Pearl River Delta Region, J. Geophys. Res., 115, D16308, https://doi.org/10.1029/2009JD012809, 2010.
Lei, W., Zhang, R., Tie, X., and Hess, P.: Chemical characterization of ozone formation in the Houston-Galveston area: A chemical transport model study, J. Geophys. Res., 109, D12301, https://doi.org/10.1029/2003JD004219, 2004.
Li, G., Zhang, R., Fan, J., and Tie, X.: Impacts of black carbon aerosol on photolysis and ozone, J. Geophys., Res., 110, D23206, https://doi.org/10.1029/2005JD005898, 2005.
Li, J., Wang, Z., Akimoto, H., Yamaji, K., Takigawa, M., Pochanart, P., Liu, Y., Tanimoto, H., and Kanaya, Y.: Near-ground ozone source attributions and outflow in central eastern China during MTX2006, Atmos. Chem. Phys., 8, 7335–7351, https://doi.org/10.5194/acp-8-7335-2008, 2008.
Li, J., Wang, Z., Wang, X., Yamaji, K., Takigawa, M., Kanaya, Y., Pochanart, P., Liu, Y., Irie, H., Hu, B., Tanimoto, H., and Akimoto, H.: Impacts of aerosols on summertime tropospheric photolysis frequencies and photochemistry over Central Eastern China, Atmos. Environ., 45, 1817–1829, https://doi.org/10.1016/j.atmosenv.2011.01.016, 2011.
Li, J., Wang, Z., Zhuang, G., Luo, G., Sun, Y., and Wang, Q.: Mixing of Asian mineral dust with anthropogenic pollutants over East Asia: a model case study of a super-duststorm in March 2010, Atmos. Chem. Phys., 12, 7591–7607, https://doi.org/10.5194/acp-12-7591-2012, 2012.
Liao, H. and Seinfeld, J.: Global impacts of gas-phase chemistry-aerosol interactions on direct radiative forcing by anthropogenic aerosols and ozone, J. Geophys. Res., 110, D18, https://doi.org/10.1029/2005JD005907, 2005.
Lohmann, U. and Feichter, J.: Impact of sulfate aerosols on albedo and lifetime of clouds: A sensitivity study with the ECHAM GCM, J. Geophys. Res., 102, 13685–13700, https://doi.org/10.1029/97JD00631, 1997.
Lu, R., Turco, R. P., and Jacobson, M. Z.: An integrated pollution modeling system for urban and regional scales: 2. Simulations for SCAQS 1987, J. Geophys. Res., 102, 6081–6098, https://doi.org/10.1029/96JD03502, 1997.
Monks, P. S., Archibald, A. T., Colette, A., Cooper, O., Coyle, M., Derwent, R., Fowler, D., Granier, C., Law, K. S., Mills, G. E., Stevenson, D. S., Tarasova, O., Thouret, V., von Schneidemesser, E., Sommariva, R., Wild, O., and Williams, M. L.: Tropospheric ozone and its precursors from the urban to the global scale from air quality to short-lived climate forcer, Atmos. Chem. Phys., 15, 8889–8973, https://doi.org/10.5194/acp-15-8889-2015, 2015.
Peng, J. F., Hu, M., Guo, S., Du, Z. F., Zheng, J., Shang, D. J., Zamora, M. L., Zeng, L. M., Shao, M., Wu, Y. S., Zheng, J., Wang, Y., Glen, C. R., Collins, D. R., Molina, M. J., and Zhang R. Y.: Markedly enhanced absorption and direct radiative forcing of black carbon under polluted urban environments, P. Natl. Acad. Sci., 113, 4266–4271, https://doi.org/10.1073/pnas.1602310113, 2016.
Qian, Y., Leung, L. R., Ghan, S. J. and Giorgi, F.: Regional climate effects of aerosols over China: Modeling and observations, Tellus B, 55, 914–934, https://doi.org/10.1046/j.1435-6935.2003.00070.x, 2003.
Qin, Y. and Xie, S. D.: Spatial and temporal variation of anthropogenic black carbon emissions in China for the period 1980–2009, Atmos. Chem. Phys., 12, 4825–4841, https://doi.org/10.5194/acp-12-4825-2012, 2012.
Qiu, C., Khalizov, A. F., and Zhang, R.: Soot aging from OH-initiated oxidation of toluene, Environ. Sci. Technol., 46, 9464–9472, https://doi.org/10.1021/es301883y, 2012.
Ramanathan, V. and Carmichael, G.: Global and regional climate changes due to black carbon, Nat. Geosci., 1, 221–227, https://doi.org/10.1038/ngeo156, 2008.
Saide, P. E., Spak, S. N., Pierce, R. B., OtKin, J. A., Schaack, T. K., Heidinger, A. K., daSilva, A. M., Kacenelenbogen, M., Redemann, J., and Carmichael, G. R.: Central American biomass burning smoke can increase tornado severity in the U.S., Geophys. Res. Lett., 42, 956–965, https://doi.org/10.1002/2014GL062826, 2015.
Skamarock, W., Klemp, J. B., Dudhia, J., Gill, D. O., Barker, D. M., Duda, M., Huang, X. Y., Wang, W., and Powers, J. G.: A description of the advanced research WRF version 3, NCAR technical note NCAR/TN/u2013475, 2008.
Tie, X., Madronich, S., Walters, S., Edwards, D. P., Ginoux, P., Mahowald, N., Zhang, R., Lou, C. and Brasseur, G.: Assessment of the global impact of aerosols on tropospheric oxidants, J. Geophys. Res., 110, D03204, https://doi.org/10.1029/2004JD005359, 2005.
Tie, X., Geng, F., Li, P., Gao, W., and Zhao, C.: Measurement and modelling of O3 variability in Shanghai, China, Atmos. Environ., 43, 4289–4302, 2009.
Tie, X., Geng, F., Guenther, A., Cao, J., Greenberg, J., Zhang, R., Apel, E., Li, G., Weinheimer, A., Chen, J., and Cai, C.: Megacity impacts on regional ozone formation: observations and WRF-Chem modeling for the MIRAGE-Shanghai field campaign, Atmos. Chem. Phys., 13, 5655–5669, https://doi.org/10.5194/acp-13-5655-2013, 2013.
Tie, X., Huang, R. J., Cao, J., Zhang, Q., Cheng, Y., Su, H., Di, C., Poschl, U., Hoffmann, T., Dusek, U., Li, G., Worsnop, D. R., and Dowd, C.: Severe pollution in China amplified by atmospheric moisture, Sci. Rep., 7, 15760, https://doi.org/10.1038/s41598-017-15909-1, 2017.
Wang, D., Zhu, B., Jiang, Z., Yang, X., and Zhu, T.: The impact of the direct effects of sulfate and black carbon aerosols on the subseasonal march of the East Asian subtropical summer monsoon, J. Geophys. Res., 121, 2610–2625, https://doi.org/10.1002/2015JD024574, 2016.
Wang, N., Guo, H., Jiang, F., Ling, Z. H., and Wang, T.: Simulation of ozone formation at different elevations in mountainous area of Hong Kong using WRF-CMAQ model, Sci. Tot. Environ., 505, 939–951, 2015.
Wang, Y., Ying, Q., Hu, J., and Zhang, H.: Spatial and temporal variations of six criteria air pollutants in 31 provincial capital cities in China during 2013–2014, Environ. Int., 73, 413–422, 2014.
Yang, F., Tan, J., Zhao, Q., Du, Z., He, K., Ma, Y., Duan, F., Chen, G., and Zhao, Q.: Characteristics of PM2.5 speciation in representative megacities and across China, Atmos. Chem. Phys., 11, 5207–5219, https://doi.org/10.5194/acp-11-5207-2011, 2011.
Zaveri, R. A. and Peters, L. K.: A new lumped structure photochemical mechanism for large-scale applications, J. Geophys. Res., 104, D23, 30387–30415, https://doi.org/10.1029/1999JD900876, 1999.
Zaveri, R. A., Easter, R. C., Fast, J. D., and Peters, L. K.: Model for simulating aerosol interactions and chemistry (MOSAIC), J. Geophys. Res., 113, D13204, https://doi.org/10.1029/2007JD008782, 2008.
Zhang, H., DeNero, S. P., Joe, D. K., Lee, H.-H., Chen, S.-H., Michalakes, J., and Kleeman, M. J.: Development of a source oriented version of the WRF/Chem model and its application to the California regional PM10 ∕ PM2.5 air quality study, Atmos. Chem. Phys., 14, 485–503, https://doi.org/10.5194/acp-14-485-2014, 2014.
Zhang, J., and Rao, S. T.: The role of vertical mixing in the temporal evolution of ground-level ozone concentrations, J. Appl. Meteorol., 38, 1674–1691, 1999.
Zhang, Y., Wen, X. Y., and Jang, C. J.: Simulating chemistry-aerosol-cloud-radiation-climate feedbacks over the continental U.S. using the online-coupled weather research forecasting model with chemistry (WRF/Chem), Atmos. Environ., 44, 3568–3582, 2010.
Zhu, B., Kang, H., Zhu, T., Su, J., Hou, X., and Gao, J.: Impact of Shanghai urban land surface forcing on downstream city ozone chemistry, J. Geophys. Res.-Atmos., 120, 4340–4351, https://doi.org/10.1002/2014JD022859, 2015.
Zhuang, B. L., Wang, T. J., Liu, J., Li, S., Xie, M., Yang, X. Q., Fu, C. B., Sun, J. N., Yin, C. Q., Liao, J. B., Zhu, J. L., and Zhang, Y.: Continuous measurement of black carbon aerosol in urban Nanjing of Yangtze River Delta, China, Atmos. Environ., 89, 415–424, 2014.


