the Creative Commons Attribution 4.0 License.
the Creative Commons Attribution 4.0 License.
MLS measurements of stratospheric hydrogen cyanide during the 2015–2016 El Niño event
Norbert Glatthor
Peter F. Bernath
Christopher D. Boone
James W. Hannigan
Ivan Ortega
Nathaniel J. Livesey
William G. Read
It is known from ground-based measurements made during the 1982–1983 and 1997–1998 El Niño events that atmospheric hydrogen cyanide (HCN) tends to be higher during such years than at other times. The Microwave Limb Sounder (MLS) on the Aura satellite has been measuring HCN mixing ratios since launch in 2004; the measurements are ongoing at the time of writing. The winter of 2015–2016 saw the largest El Niño event since 1997–1998. We present MLS measurements of HCN in the lower stratosphere for the Aura mission to date, comparing the 2015–2016 El Niño period to the rest of the mission. HCN in 2015–2016 is higher than at any other time during the mission, but ground-based measurements suggest that it may have been even more elevated in 1997–1998. As the MLS HCN data are essentially unvalidated, we show them alongside data from the MIPAS and ACE-FTS instruments; the three instruments agree reasonably well in the tropical lower stratosphere. Global HCN emissions calculated from the Global Fire Emissions Database (GFED v4.1) database are much greater during large El Niño events and are greater in 1997–1998 than in 2015–2016, thereby showing good qualitative agreement with the measurements. Correlation between El Niño–Southern Oscillation (ENSO) indices, measured HCN, and GFED HCN emissions is less clear if the 2015–2016 event is excluded. In particular, the 2009–2010 winter had fairly strong El Niño conditions and fairly large GFED HCN emissions, but very little effect is observed in the MLS HCN.
- Article
(8517 KB) - Full-text XML
- BibTeX
- EndNote
Hydrogen cyanide (HCN) is a minor constituent of the atmosphere that is produced almost entirely from biomass burning. The earliest detailed study (Cicerone and Zellner, 1983) suggested that the main sink should be chemical loss, that this should be significant in the stratosphere, but small in the troposphere, and that the sources and sinks were small enough that the mixing ratio in the troposphere (which is approximately 0.2 ppbv) should show only small variations. Cicerone and Zellner (1983) identified a number of potential sources, mostly related to combustion. Subsequent studies (e.g. Li et al., 2000, 2003) show that both sources and sinks are larger than Cicerone and Zellner (1983) believed, that the main source is biomass burning, and that the oceans form a significant sink in the troposphere. As a consequence, the tropospheric mixing ratio is more variable than was suggested by Cicerone and Zellner (1983).
The first daily global satellite measurements of HCN to be reported (Pumphrey et al., 2006) were made by the Microwave Limb Sounder (MLS) (Waters et al., 2006) on NASA's Aura satellite (Schoeberl et al., 2006). The standard HCN product at that time contained large and obvious systematic errors, especially in the polar regions. The data described by Pumphrey et al. (2006) were weekly zonal means, produced by an off-line algorithm. Recently, version 4 of the MLS data was released; the standard HCN product in this version is much improved and is usable at low latitudes between 68 and 1 hPa.
In this paper we present the version 4 HCN data to date, including the large El Niño event of 2015–2016. We show that HCN concentrations entering the stratosphere are almost twice as large during the 2015–2016 El Niño than at other times and are enhanced to some extent during some of the smaller El Niño events earlier in the Aura mission.
In this section we describe the El Niño–Southern Oscillation system briefly and review the published measurements of HCN during previous large ENSO events.
2.1 The El Niño–Southern Oscillation
The El Niño–Southern Oscillation (ENSO) is a large-scale dynamical feature of the climate system and is the largest cause of inter-annual climate variability. A good introduction to the subject is provided by Sarachik and Cane (2010). The main feature of ENSO is a non-periodic oscillation on a timescale of 2–7 years between two distinct phases. The El Niño phase is characterised by warmer water in the eastern Pacific and the movement and spread of a large region of deep convection from the western Pacific into the central Pacific. The La Niña phase is characterised by cooler water in the eastern Pacific and the confinement of the region of deep convection to the western Pacific.
The atmosphere over the Pacific incorporates a meridional circulation known as the Walker circulation (Bjerknes, 1969). During neutral and La Niña phases of ENSO, this circulation shows ascent over the maritime continent and descent over the eastern Pacific. During an El Niño phase, the ascending branch of the circulation moves into the central Pacific, leaving descending air over the maritime continent. This descending air leads to droughts in Australia and Indonesia, while the La Niña phase is associated with greater-than-normal rainfall in those areas. Although ENSO has its most obvious effects in the tropical Pacific, its effects are felt further afield. Larger El Ninõ events tend to begin in the middle of a calendar year and persist until well into the following calendar year.
It is common practice to summarise the state of ENSO at a given time by a single number called an ENSO index. There is a range of these indices in use. Some are determined purely from sea surface temperature data; the Nino3.4 index (Barnston et al., 1997) is such an index and is taken from an area of ocean chosen specifically to make it useful as a general indicator of ENSO state. Other indices are determined from purely atmospheric data; an example is the Southern Oscillation Index (SOI), defined as the difference between the normalised pressure anomalies at Darwin and Tahiti (Trenberth, 1976; Horel and Wallace, 1981).
Yet other ENSO indices amalgamate several sorts of data into a single index; the Multivariate ENSO Index (MEI) (Wolter and Timlin, 1993, 1998) is a much-used example of this type. ENSO indices are usually calculated as the difference from the mean value over a base period, divided by the standard deviation of that same period. This ensures that they have a value of zero when the climate system is not in either an El Niño phase or a La Niña phase and that the value lies in the range of ±1 for much of the time, moving only occasionally outside the range of ±2. Figure 1 shows time series of the MEI, SOI, and Nino3.4 indices between 1977 and the present. It is clear that there is a high level of correlation between the indices. For the rest of this paper we will therefore use the MEI to indicate the phase of the ENSO system.
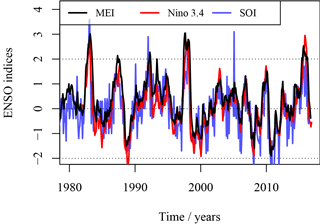
Figure 1 Time series of three different ENSO indices between 1977 and the present. The SOI as usually defined is negative during a positive ENSO phase; we have plotted the negative of the SOI for easier comparison with the other indices. SOI and Nino3.4 data were obtained from http://www.cpc.noaa.gov/data/indices/. MEI data were obtained from http://www.esrl.noaa.gov/psd/enso/mei.
There have been three particularly large El Niño events since 1950: in 1982–1983, 1997–1998, and 2015–2016. All three are shown in Fig. 1 and are the only times several of the indices exceed 2 for several months. Only the last of these large El Niño events occurred during the Aura mission. There were, however, several smaller El Niño events during the mission and the preceding 2 years, most notably in 2002–2003, 2004–2005, 2006–2007, 2009–2010, and 2014–2015, the latter arguably being the initial part of the 2015–2016 event.
It is known that El Niño events cause droughts and hence an excess of biomass burning in Indonesia and neighbouring countries. Field et al. (2016) report that the 2015–2016 event was the most severe in the period when NASA's Earth Observing System (EOS) satellites were operating, making it significantly more severe than 2006–2007. The 1997–1998 event occurred before the EOS satellites began operating, but other types of observation suggest that it was even more severe than 2015–2016.
2.2 HCN during ENSO events
Although there were no regular satellite measurements of HCN during the major El Niño events of 1982–1983 and 1997–1998, there were a number of ground-based measurements made using Fourier-transform infrared (FTIR) spectroscopy. These measurements were made at the Jungfraujoch in Switzerland (46.5∘ N) (Rinsland et al., 1999), Mauna Loa in Hawaii (19.3∘ N) (Rinsland et al., 2000), and Kitt Peak, Arizona (32∘ N) (Rinsland et al., 2001).
The measurements from all three sites are shown in Fig. 2. (Data were obtained from the website of the Network for the Detection of Atmospheric Composition Change (NDACC) – http://www.ndacc.org.) Note that the data are the average mixing ratio for a partial column; the partial columns are for slightly different altitude ranges for the three measurement sites: 3.40–16 km for Mauna Loa, 3.58–11 km for Jungfraujoch, and 2.09–14 km for Kitt Peak. All three sites show a substantial increase (at least a doubling) of HCN mixing ratios during the 1997–1998 El Niño. The response is faster at the lower-latitude sites; the enhanced HCN is observed at Kitt Peak and Mauna Loa in late 1997 and does not appear at Jungfraujoch until spring 1998. It is shown by Rinsland et al. (1999), using trajectory calculations, that the air arriving at Hawaii during the period with enhanced HCN does so from the west; it is suggested that the HCN comes from the extensive forest fires that burned in Indonesia during late 1997 and that a similar explanation is plausible for the Kitt Peak data. Rinsland et al. (2000) consider that Jungfraujoch data are less easy to explain; they suggest a variety of possible causes.
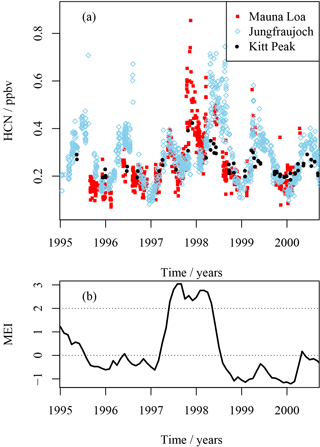
Figure 2 Ground-based HCN measurements between 1995 and 2000, at Kitt Peak (32∘ N), Mauna Loa (19.3∘ N), and Jungfraujoch (46.5∘ N), with the Multivariate ENSO Index (MEI) shown for comparison. Note that the values are slightly different from those shown in Rinsland et al. (1999, 2000, 2001) as the data have been reprocessed with updated spectroscopy.
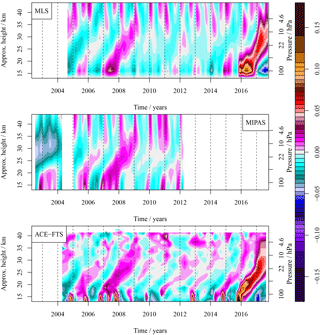
Figure 3 Zonal mean HCN anomaly (in parts per billion volume) for MLS, MIPAS, and ACE-FTS, for the 12.5∘ S to 12.5∘ N latitude band, as a function of altitude and time. The MLS and MIPAS data shown are 20-day averages in order to reduce the noisiness of the figure. The ACE-FTS data are calendar month averages. For consistency, the anomalies are calculated relative to the 2006–2011 period for all instruments. The very low values in the MIPAS data in 2002–04 above 25 km are thought to be at least partly an instrumental artefact.
3.1 The measurement and estimation procedure
The Aura satellite (Schoeberl et al., 2006) was launched in July 2004, and the MLS instrument (Waters et al., 2006) has operated with little interruption from August 2004 to date. The satellite orbits at an altitude of 705 km, performing approximately 14.5 orbits per day. The MLS instrument consists of a 1.6 m parabolic dish antenna feeding heterodyne radiometers operating at 118, 190, 240, and 640 GHz. A separate small antenna feeds another radiometer operating at 2.5 THz. The output of the radiometers is analysed by banks of filters. The antenna looks forward from the Aura platform, in the plane of the orbit, and is scanned across the Earth's limb 240 times per orbit. As the orbit is inclined at 98∘ to the Equator, the instrument observes a latitude range from 82∘ S to 82∘ N every day. The observations are of thermal emission from the atmosphere and can therefore be made day and night. The orbit is sun-synchronous; thus, the observations are always made at the same two local times for a given latitude; the ascending Equator crossing time is 13:45 local time. The radiances reported by the filter banks are used as input to a software package (Livesey et al., 2006) that estimates profiles of temperature and of the mixing ratios of the target chemical species. Most MLS-estimated profiles, including HCN, are reported on pressure levels spaced at six levels per pressure decade, a spacing of approximately 2.7 km in altitude. The estimated profiles are spaced 1.5∘ (167 km) apart along the orbit track. All MLS data products are documented in some detail in Livesey et al. (2017).
Hydrogen cyanide is a linear molecule with a large dipole moment. Linear molecules have a simple microwave spectrum, with lines at integer multiples of a fundamental frequency: 88.6 GHz in the case of HCN. MLS has two filter banks (band 6F and band 27M) that are fed from the 190 GHz radiometer and are affected by the second of these lines, which lies at 177.26 GHz. Details of the radiances in this part of the spectrum and of the spectral coverage of the instrument are given in Pumphrey et al. (2006).
In previous data versions (version 1, 2, and 3) the MLS HCN data were retrieved as part of the same inversion as all other species retrieved from the 190 GHz measurements. In version 4 of the MLS data, HCN is estimated as part of a separate retrieval phase that uses only bands 6F and 27M as input.
HCN mixing ratios are estimated over a range of 0.1 to 100 hPa. Initial inspection of the version 4 HCN suggests that it is similar to earlier versions at 32 km (10 hPa) and above and is much improved in the lower stratosphere. The main improvement is that the version 4 HCN does not have regions of persistently negative mixing ratio in the extratropical lower stratosphere. As a result of this, the data are recommended for use in the range from 0.1 to 21 hPa. In this paper we make cautious use of the data between 31 and 100 hPa, justifying their use by comparison with other data where that is possible. The vertical resolution of the HCN data is considerably poorer than the 2.7 km spacing between the levels on which the data are reported. Averaging kernels for the retrieval are shown by Livesey et al. (2017); the vertical width is between 7 and 9 km in the lower stratosphere. Furthermore, the averaging kernel for 100 hPa has a poor shape, peaking at 68 hPa and having a far lower response at 100 hPa; this implies that the 100 hPa data reflect changes at higher altitudes. A full validation paper describing the data is planned. In the absence of a full validation of the data, we show them alongside data from the MIPAS instrument on Envisat and the ACE-FTS (Atmospheric Chemistry Experiment – Fourier Transform Spectrometer) on SCISAT (Bernath et al., 2005; Bernath, 2017). HCN data from MIPAS have been described recently (Glatthor et al., 2015) and are of good quality between 10 and 30 km altitude, but are not available for dates after March 2012. We use MIPAS data versions V5H_HCN_21 (2002–2004), V5R_HCN_222 (2005–April 2011), and V5R_HCN_223 (April 2011–2012). A small number of data from version V5R_HCN_120 is used to fill gaps in the later versions in 2005 and 2006. ACE-FTS data (version 3.5/3.6) (Boone et al., 2005; Boone and Bernath, 2013) are available over the entire Aura mission. As ACE-FTS is a solar occultation instrument, measurements are made at only two latitudes on any one day; these latitudes change slowly from day to day, crossing the equatorial region approximately once per month (Bernath, 2017). The ACE-FTS HCN data during the 2015–2016 El Niño event have been reported by Sheese et al. (2017).
3.2 The “tape recorder” signal
It was reported by Pumphrey et al. (2008), and confirmed by Glatthor et al. (2015), that HCN shows a tape recorder signal in the tropical lower stratosphere. The tape recorder phenomenon was originally reported in water vapour measurements (Mote et al., 1996) and is observable for any species that is chemically stable in the lower stratosphere and that has seasonal or interannual variations in the mixing ratio entering the tropical lower stratosphere. Attempts to model the tape recorder signal in HCN are described by Park et al. (2013), Pommrich et al. (2010), and Li et al. (2009). These studies show that the interannual variability in lower stratospheric HCN is driven by variability in biomass burning and that much of that variability comes from Indonesia and the surrounding region.
Figure 3 shows the tape recorder signal in the MLS, MIPAS, and ACE-FTS data. The 2004–2008 period shows a strong biennial cycle, with particularly high values entering the stratosphere in late 2007 and most of 2008, as reported by Pumphrey et al. (2008). This feature is corroborated by the MIPAS and ACE-FTS data; in the MIPAS data it appears to extend back to 2002. The 2009–2013 period is rather featureless in the MLS data. The MIPAS data show more structure, with high values at 100 and 68 hPa at the end of 2009, 2010, and 2011. This implies that MLS has much poorer sensitivity than MIPAS at these altitudes. The ACE-FTS data in the 2009–2013 period show an annual tape recorder signal; this is almost invisible in the MLS data due to the instrument's poorer vertical resolution. MIPAS data are unavailable after spring 2012, but the MLS and ACE-FTS data show more variability in the most recent part of the time series. There are particularly low entry values in early 2014, and the values entering the stratosphere in late 2015 and early 2016 are larger than any seen so far during the Aura and Envisat missions. The onset of high values in late 2015 is very rapid and appears in the MLS data to be simultaneous at the 100, 68, and 46 hPa levels. The ACE-FTS data are too sparse in time to show how rapid the onset is but suggest that it initially affects only the 100 and 68 hPa levels. The rapid onset at 46 hPa in the MLS data is, again, due to the instrument's limited vertical resolution. Although the onset of high HCN values is rapid, it is not instantaneous, occurring over about 18 days, between 20 October and 7 November 2015. The smaller increase in late 2006 is similar but occurs over a longer period: approximately 45 days between 18 October 2016 and 3 December 2016.
3.3 HCN as a function of latitude
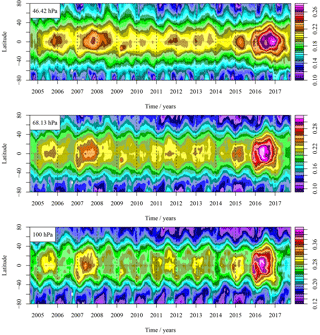
Figure 4 shows the MLS HCN data as a function of time and latitude. The El Niño years of 2015–2016 and 2006–2007 show clear increases in HCN. At 68 hPa, the sudden onset of the increase is seen towards the end of the first year of the event, approximately 10∘ south of the Equator. The subsequent maximum values occur in the middle of the second year of the event, close to the Equator. At 46 hPa, the initial increase is less clear and much of the equatorial signal occurs some months later than at 68 hPa, as would be expected from Fig. 3.
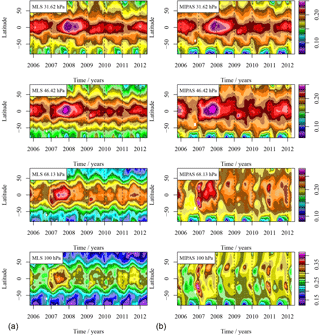
Figure 5 MLS (a) and MIPAS (b) HCN, in parts per billion volume, as a function of time and latitude for four pressure levels. Note that the colour scale is different for each level. A constant offset has been added to the MIPAS data at each level to remove the bias between the two instruments at the Equator; the offsets are +0.04 ppbv at 100 hPa, −0.025 ppbv at 68.1 hPa, −0.032 ppbv at 46.4 hPa, and −0.038 ppbv at 31 hPa.
The 100 hPa data shown in Fig. 4 appear very similar to the 68 hPa data. As noted above, it is likely that the 100 hPa data contain little useful information. To confirm this, in Fig. 5 we show a shortened version of the time series, with the MIPAS data for comparison. It is clear from this that the two instruments agree rather well at 31.6 hPa, but that the agreement becomes worse with decreasing altitude. The MIPAS data at 100 hPa (and to some extent at 68 hPa) show some notable features not present in the MLS data. In particular, the HCN entering the stratosphere during the early part of an El Niño event does so in two disconnected regions at about 30∘ S and 30∘ N. The southern region is just visible in the MLS data at the end of 2006 but is far clearer in the MIPAS data. Enhanced HCN seen at 30∘ N during the Northern Hemisphere summer is caused by the flow of polluted air into the stratosphere via the Asian monsoon (Randel et al., 2010; Ploeger et al., 2017). This feature is difficult to discern in the MLS data. It is clear from the MIPAS data that the feature does not extend to any greater altitude than 68 hPa, implying that the MLS data contain little if any information from altitudes lower than 68 hPa.
The small area of high HCN values seen at 12∘ S in February 2009, in Figs. 4 and 5, is caused by the Black Saturday fires in Australia (Pumphrey et al., 2011).
3.4 Location of the rapid increase in HCN
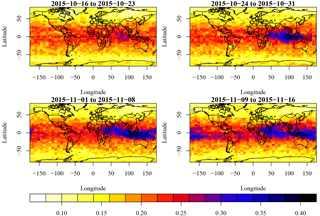
To further examine the rapid increase in HCN in October 2015, in Fig. 6 we show 8-day mean maps of HCN at 68 hPa. It is clear from these that the HCN arrives at this altitude close to the Equator and at a very limited range of longitudes, close to 100∘ E. The subsequent increase to a maximum value in mid-2016 (not shown) does not occur at an identifiable longitude; the distribution of HCN in December 2016 and after appears zonally symmetric. The smaller sudden increase in October and November of 2006 also occurs around 100∘ E.
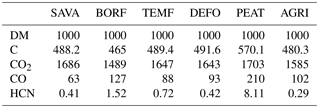
The most detailed and comprehensive estimate of biomass burning and its effect on the atmosphere is the Global Fire Emissions Database, Version 4.1 (GFED4s) (Randerson et al., 2017). This is an updated version of the database described in van der Werf et al. (2010). The emissions data consist of the mass of dry matter mDM burned every month in every 0.25∘ grid box. Each grid box is provided with metadata showing the fraction, f, of the box covered with each of six surface types (savannah, boreal forest, peat, etc.). Also provided is a table giving an emission factor, E, for each combination of surface type and emitted molecule; we show an excerpt from this in Table 1.
Table 1 Emission factors (in grams per kilogram) for use with GFED4s, for all surface types and for a selection of molecular species, including dry matter (DM). Note that C is total carbon.
With this information it is straightforward to calculate an estimate of the mass, m, of any molecule emitted from any grid box in any month by summing over the six surface types:
Emissions from individual grid cells may be summed to give the emissions for any region of the world. For convenience, GFED4s is provided with a mask dividing the world into 14 regions.
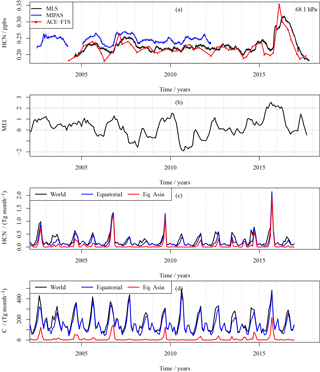
Figure 7(a) Zonal-mean HCN from MLS, MIPAS, and ACE-FTS at 68 hPa (about 18.5 km), between 12.5∘ N and 12.5∘ S. (b) Multivariate ENSO Index (MEI) for comparison. (c) GFED4s HCN emissions. (d) GFED4s C emissions. The equatorial region as shown in (c) and (d) is defined as the region between 30∘ S and 30∘ N.
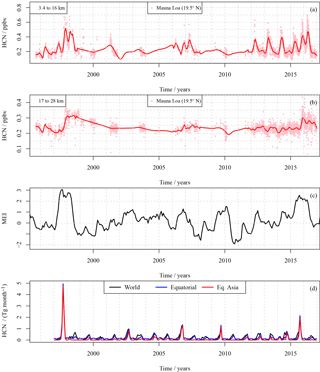
Figure 8Panels (a) and (b) show HCN data from the Mauna Loa FTIR instrument for two different height ranges. Panels (c) and (d) show MEI and GFED HCN emissions for comparison.
In Fig. 7 we show the monthly emissions of HCN and total C calculated for the whole world, the region between 30∘ S and 30∘ N, and for the equatorial Asia (EQAS) region as defined by GFED4s; this region essentially covers the countries of Indonesia, Malaysia, and Papua New Guinea. It is clear that the EQAS region accounts for a much larger fraction of HCN emissions than for biomass burning emissions as a whole. This is because the EQAS region has a far larger fraction of the peat surface type than other equatorial regions and because EHCN is far larger for peat than for the other surface types.
In the strong El Niño year 2015–2016 and the moderate El Niño years 2002–2003, 2006–2007 and 2009–2010 there is a strong peak in global HCN emissions toward the end of the first calendar year; these emission peaks are almost entirely due to emissions from the EQAS region. In the La Niña years 2007–2008, 2008–2009, and 2010–2011, global HCN emissions are lower and are mostly due to parts of the world other than the EQAS region. The remainder of the time, when the MEI is close to zero, the EQAS region makes a significant, but not dominant, contribution to global HCN emissions. This contribution often occurs in the Northern Hemisphere autumn, as in El Niño years, but may occur at other times of the year (e.g. in 2013 and 2005).
The HCN values in the lower stratosphere are, for the most part, what would be expected from the emissions. The emission spikes in autumn 2002, 2006, 2015, and 2014 all result in a sharp increase in HCN at 68 hPa, with a continued rise in the following months. In 2006, 2014, and 2015 the initial increase occurs over the EQAS region. We show this in Fig. 6 for 2015; 2006 and 2014 are similar but less spectacular. We cannot extend this observation to 2002 as this was before the Aura launch, and the MIPAS data have a gap at the time of the sharp increase. The anomalous year is 2009; this year shows a large peak in autumn HCN emissions from the EQAS region, but very little effect is seen in the stratosphere.
These observations support the hypothesis that the excess HCN in the stratosphere during an ENSO event is almost entirely due to unusually large amounts of biomass burning in the EQAS region. Rather more tentatively, we suggest that in some El Niño years (2006–2007, 2014–2015, 2015–2016), a large proportion of the HCN is transported very rapidly to the stratosphere above the EQAS region; the remaining fraction being dispersed within the troposphere. In other El Niño years (2009–2010) the rapid transport does not occur, and any HCN that reaches the stratosphere does so by a less direct route.
Transport of air from the boundary layer to the tropopause is known to be rapid in at least some parts of the world. Hosking et al. (2012) show that in a neutral ENSO year (2005), such transport was most effective over the maritime continent and the western Pacific during the Northern Hemisphere winter. The start of this period of effective transport is around 1 November, coinciding with the end of the dry season in Indonesia.
The fire season in Indonesia in 2015 began in July, was at its strongest in September and October, and ended at the start of November as the wet season commenced (Field et al., 2016). During most of the fire season, the atmosphere above the source region was subsiding due to the displacement and weakening of the Walker circulation. The change from subsidence to ascent occurred around 24 October; the sudden increase of stratospheric HCN over Indonesia occurred during the following 8 days, as shown in Fig. 6. It is likely that HCN emitted during all of the fire season apart from the last week or two is initially dispersed within the boundary layer, only contributing to the stratospheric concentration after becoming well mixed in the troposphere.
Was the 2015–2016 El Niño as large an event, in terms of HCN, as the 1997–1998 event? Figure 8 shows the GFED HCN emissions and MEI; it is clear that, for HCN emissions in the GFED data, 1997–1998 was more than twice as large as 2015–2016.
It is difficult to compare atmospheric HCN for the two events as the data available are so different. FTIR spectrometers (see Fig. 2) provide the longest record, but few are in the tropics, and, of these, only the NDACC Mauna Loa station was recording during both the 1997–1998 and the 2015–2016 events (Hannigan et al., 2009). Figure 8 shows data from this instrument. Solar viewing FTIR instruments derive vertical information from the pressure broadening of absorption transitions in transmission spectra, and typical degrees of freedom in the HCN retrieval are between 2.5 and 3.5. Here we plot average mixing ratios over two deep layers. To reveal the observation of the El Niño enhancements and diminish short-term variability, we smooth the individual observations using the local linear interpolator (Wand and Jones, 1995), with a bandwidth of 0.05 years where the data are dense and 0.45 years where there are lapses in observations; these lapses occur intermittently between 1999 and 2012. Comparing the two events in the stratosphere, HCN in 1997–1998 starts from a slightly lower background level near 0.2 ppbv, increases to a higher value above 0.3 ppbv, and persists at an elevated level for longer. Despite peak values in 2015–2016 being higher, higher sustained levels above 0.3 in 1997–1998 appear to show greater stratospheric loading. In the troposphere, the 1997–1998 event appears larger, both in terms of the peak value and the smoothed curve, in general agreement with GFED. In neither the troposphere nor the stratosphere is the difference between 1997–1998 and 2015–2016 as large as one might expect from the GFED emission estimates alone.
The main driver of interannual variability in HCN in the tropical lower stratosphere is variability in the only significant source: biomass burning. In El Niño years, the equatorial Asian region tends to suffer severe droughts, leading to unusually large amounts of biomass burning. In some years a significant fraction of the biomass burning products from these events are transported rapidly to the stratosphere, arriving at 68 hPa over the EQAS region. The 2015–2016 El Niño event is the strongest event of this type during the Aura mission, resulting in mixing ratios of HCN in the lower stratosphere that are 45 % higher than normal. Both the GFED emissions estimates and the limited data available from a ground-based FTIR instrument suggest that HCN emissions were even greater in the 1997–1998 El Niño event.
The GFED data used in this study are available at https://doi.org/10.3334/ORNLDAAC/1293 (Randerson et al., 2017). The MLS data are available at https://doi.org/10.5067/Aura/MLS/DATA2011 (Pumphrey et al., 2015). The ACE-FTS data are currently available at http://www.ace.uwaterloo.ca/. Registration is required. The MIPAS data are currently available at https://www.imk-asf.kit.edu/english/308.php. Registration is required. The FTIR data are available at http://www.ndacc.org.
HCP wrote most of the paper. NG advised on the MIPAS data and made a number of corrections to the text. PFB and CB advised on the ACE-FTS data. JH and IO advised on the use of the FTIR data and expedited the availability of the Mauna Loa data from 2016. WGR advised as to how the HCN data are handled in the MLS data processing. NJL made a number of corrections to the text and suggested various improvements to the figures.
The authors declare that they have no conflict of interest.
The FTIR data used in this publication were obtained as part of the Network for the Detection of Atmospheric Composition Change (NDACC) and are publicly available (see http://www.ndacc.org). The ACE mission is supported primarily by the Canadian Space Agency.
The National Center for Atmospheric Research is supported by the
National Science Foundation. The NCAR FTS observation programs at
Mauna Loa, HI, are supported under contract by NASA. We wish to thank
NOAA for support of the MLO site operations. Work at
the Jet Propulsion Laboratory, California Institute of Technology,
was performed under contract with NASA. Work on MLS at Edinburgh has
been funded by NERC under grant NE/E003990/1 and previous
grants. The article processing charges for this open-access
publication were paid by the RCUK Open Access Publication Fund.
Edited by: Rolf Müller
Reviewed by: Mengchu Tao and one anonymous referee
Barnston, A. G., Chelliah, M., and Goldenberg, S. B.: Documentation of a highly ENSO-related SST region in the equatorial Pacific, Atmos. Ocean, 35, 367–383, https://doi.org/10.1080/07055900.1997.9649597, 1997. a
Bernath, P. F.: The Atmospheric Chemistry Experiment (ACE), J. Quant. Spectrosc. Ra., 186, 3–16, https://doi.org/10.1016/j.jqsrt.2016.04.006, 2017. a, b
Bernath, P. F., McElroy, C. T., Abrams, M. C., Boone, C. D., Butler, M., Camy-Peyret, C., Carleer, M., Clerbaux, C., Coheur, P.-F., Colin, R., DeCola, P., DeMaziere, M., Drummond, J. R., Dufour, D., Evans, W. F. J., Fast, H., Fussen, D., Gilbert, K., Jennings, D. E., Llewellyn, E. J., Lowe, R. P., Mahieu, E., McConnell, J. C., McHugh, M., McLeod, S. D., Michaud, R., Midwinter, C., Nassar, R., Nichitiu, F., Nowlan, C., Rinsland, C. P., Rochon, Y. J., Rowlands, N., Semeniuk, K., Simon, P., Skelton, R., Sloan, J. J., Soucy, M.-A., Strong, K., Tremblay, P., Turnbull, D., Walker, K. A., Walkty, I., Wardle, D. A., Wehrle, V., Zander, R., and Zou, J.: Atmospheric Chemistry Experiment (ACE): Mission overview, Geophys. Res. Lett, 32, L15S01, https://doi.org/10.1029/2005GL022386, 2005. a
Bjerknes, J.: Atmospheric Teleconnections from the Equatorial Pacific, Mon. Weather Rev., 97, 163–172, 1969. a
Boone, C. D., Nassar, R., Walker, K. A., Rochon, Y., McLeod, S. D., Rinsland, C. P., and Bernath, P. F.: Retrievals for the atmospheric chemistry experiment Fourier-transform spectrometer, Appl. Optics, 44, 7218–7231, 2005. a
Boone, C. D., Walker, K. A., and Bernath, P. F.: Version 3 Retrievals for the Atmospheric Chemistry Experiment Fourier Transform Spectrometer (ACE-FTS), in: The Atmospheric Chemistry Experiment ACE at 10: A Solar Occultation Anthology, edited by: Bernath, P., 103–127, A. Deepak Publishing, Hampton, VA, USA, 2013. a
Cicerone, R. J. and Zellner, R.: The Atmospheric Chemistry of Hydrogen Cyanide (HCN), J. Geophys. Res., 88, 10689–10696, 1983. a, b, c, d
Field, R. D., van der Werf, G. R., Fanin, T., Fetzer, E. J., Fuller, R., Jethva, H., Levy, R., Livesey, N. J., Luo, M., Torres, O., and Worden, H. M.: Indonesian fire activity and smoke pollution in 2015 show persistent nonlinear sensitivity to El Niño-induced drought, P. Natl. Acad. Sci. USA, 113, 9204–9209, https://doi.org/10.1073/pnas.1524888113, 2016. a, b
Glatthor, N., Höpfner, M., Stiller, G. P., von Clarmann, T., Funke, B., Lossow, S., Eckert, E., Grabowski, U., Kellmann, S., Linden, A., A. Walker, K., and Wiegele, A.: Seasonal and interannual variations in HCN amounts in the upper troposphere and lower stratosphere observed by MIPAS, Atmos. Chem. Phys., 15, 563–582, https://doi.org/10.5194/acp-15-563-2015, 2015. a, b
Hannigan, J. W., Coffey, M. T., and Goldman, A.: Semiautonomous FTS Observation System for Remote Sensing of Stratospheric and Tropospheric Gases, J. Atmos. Oceanic Technol., 26, 1814–1828, https://doi.org/10.1175/2009JTECHA1230.1, 2009. a
Horel, J. D. and Wallace, J. M.: Planetary-scale atmospheric phenomena associated with the Suthern Oscillation, Mon. Weather Rev., 109, 813–829, https://doi.org/10.1175/1520-0493(1981)109<0813:PSAPAW>2.0.CO;2, 1981. a
Hosking, J. S., Russo, M. R., Braesicke, P., and Pyle, J. A.: Tropical convective transport and the Walker circulation, Atmos. Chem. Phys., 12, 9791–9797, https://doi.org/10.5194/acp-12-9791-2012, 2012. a
Li, Q., Jacob, D. J., Bey, I., Yantosca, R. M., Zhao, Y., Kondo, Y., and Notholt, J.: Atmospheric Hydrogen Cyanide (HCN): Biomass burning source, ocean sink?, Geophys. Res. Lett., 27, 357–360, 2000. a
Li, Q., Jacob, D. J., Yantosca, R. M., Heald, C. L., Singh, H. B., Koike, M., Zhao, Y., Sachse, G. W., and Streets, D. G.: A global three-dimensional model analysis of the atmospheric budgets of HCN and CH3CN: Constraints from aircraft and ground measurements, J. Geophys. Res, 108, 8827, https://doi.org/10.1029/2002JD003075, 2003. a
Li, Q., Palmer, P. I., Pumphrey, H. C., Bernath, P., and Mahieu, E.: What drives the observed variability of HCN in the troposphere and lower stratosphere?, Atmos. Chem. Phys., 9, 8531–8543, https://doi.org/10.5194/acp-9-8531-2009, 2009. a
Livesey, N. J., Snyder, W. V., Read, W. G., and Wagner, P. A.: Retrieval algorithms for the EOS Microwave Limb Sounder (MLS) instrument, IEEE T. Geosci. Remote, 44, 1144–1155, 2006. a
Livesey, N. J., Read, W. G., Wagner, P. A., Froidevaux, L., Lambert, A., Manney, G. L., Valle, L. M., Pumphrey, H. C., Santee, M. L., Schwartz, M. J., Wang, S., Fuller, R. A., Jarnot, R. F., Knosp, B. W., and Martinez, E.: Earth Observing System (EOS) Aura Microwave Limb Sounder (MLS) Version 4.2x Level 2 data quality and description document., Tech. Rep. JPL D-33509 Rev C, NASA Jet Propulsion Laboratory California Institute of Technology, Pasadena, California, 91109-8099, available at: http://mls.jpl.nasa.gov (last access: 4 January 2018), 2017. a, b
Mote, P. W., Rosenlof, K. H., McIntyre, M. E., Carr, E. S., Gille, J. C., Holton, J. R., Kinnersley, J. S., Pumphrey, H. C., Russell, J. M., and Waters, J. W.: An atmospheric tape recorder: The imprint of tropical tropopause temperatures on stratospheric water vapor, J. Geophys. Res, 101, 3989–4006, https://doi.org/10.1029/95JD03422, 1996. a
Park, M., Randel, W. J., Kinnison, D. E., Emmons, L. K., Bernath, P. F., Walker, K. A., Boone, C. D., and Livesey, N. J.: Hydrocarbons in the upper troposphere and lower stratosphere observed from ACE-FTS and comparisons with WACCM, J. Geophys. Res.-Atmos., 118, 1964–1980, https://doi.org/10.1029/2012JD018327, 2013. a
Ploeger, F., Konopka, P., Walker, K., and Riese, M.: Quantifying pollution transport from the Asian monsoon anticyclone into the lower stratosphere, Atmos. Chem. Phys., 17, 7055–7066, https://doi.org/10.5194/acp-17-7055-2017, 2017. a
Pommrich, R., Müller, R., Grooß, J.-U., Günther, G., Konopka, P., Riese, M., Heil, A., Schultz, M., Pumphrey, H.-C., and Walker, K. A.: What causes the irregular cycle of the atmospheric tape recorder signal in HCN?, Geophys. Res. Lett., 37, L16805, https://doi.org/10.1029/2010GL044056, 2010. a
Pumphrey, H. C., Jimenez, C. J., and Waters, J. W.: Measurement of HCN in the middle atmosphere by EOS MLS, Geophys. Res. Lett., 33, L08804, https://doi.org/10.1029/2005GL025656, 2006. a, b, c
Pumphrey, H. C., Boone, C., Walker, K. A., Bernath, P., and Livesey, N. J.: Tropical tape recorder observed in HCN, Geophys. Res. Lett, 35, L05801, https://doi.org/10.1029/2007GL032137, 2008. a, b
Pumphrey, H. C., Santee, M. L., Livesey, N. J., Schwartz, M. J., and Read, W. G.: Microwave Limb Sounder observations of biomass-burning products from the Australian bush fires of February 2009, Atmos. Chem. Phys., 11, 6285–6296, https://doi.org/10.5194/acp-11-6285-2011, 2011. a
Pumphrey, H., Livesey, N., and Read, W.: MLS/Aura Level 2 Hydrogen Cyanide (HCN) Mixing Ratio V004, Greenbelt, MD, USA, Goddard Earth Sciences Data and Information Services Center (GES DISC), available at: https://doi.org/10.5067/Aura/MLS/DATA2011 (last access: 4 January 2018), 2015.
Randel, W. J., Park, M., Emmons, L., Kinnison, D., Bernath, P., Walker, K. A., Boone, C., and Pumphrey, H.: Asian Monsoon Transport of Pollution to the Stratosphere, Science, 328, 611–613, https://doi.org/10.1126/science.1182274, 2010. a
Randerson, J. T., van der Werf, G. R., Giglio, L., Collatz, G. J., and Kasibhatla, P. S.: Global Fire Emissions Database, Version 4.1 (GFEDv4), ORNL DAAC, Oak Ridge, Tennessee, USA, available at: https://doi.org/10.3334/ORNLDAAC/1293 (last access: 15 January 2018), 2017.
Rinsland, C. P., Goldman, A., Zander, R., and Mahieu, E.: Enhanced tropospheric HCN columns above Kitt Peak during the 1982–1983 and 1997–1998 El Niño warm phases, J. Quant. Spectrosc. Ra., 69, 3–8, https://doi.org/10.1016/S0022-4073(00)00122-9, 2001. a, b
Rinsland, C. P., Goldman, A., Murcray, F. J., Stephen, T. M., Pougatchev, N. S., Fishman, J., David, S. J., Blatherwick, R. D., Novelli, P. C., Jones, N. B., and Connor, B. J.: Infrared solar spectroscopic measurements of free tropospheric CO, C2H6, and HCN above Mauna Loa, Hawaii: Seasonal variations and evidence for enhanced emissions from the Southeast Asian tropical fires of 1997–1998, J. Geophys. Res, 104, 18667–18680, https://doi.org/10.1029/1999JD900366, 1999. a, b, c
Rinsland, C. P., Mahieu, E., Zander, R., Demoulin, P., Forrer, J., and Buchmann, B.: Free tropospheric CO, C2H6, and HCN above central Europe: Recent measurements from the Jungfraujoch station including the detection of elevated columns during 1998, J. Geophys. Res., 105, 24235–24249, https://doi.org/10.1029/2000JD900371, 2000. a, b, c
Sarachik, E. S. and Cane, M. A.: The El Niño-Southern Oscillation Phenomenon, Cambridge University Press, Cambridge, UK, https://doi.org/10.1017/CBO9780511817496, 2010. a
Schoeberl, M. R., Douglass, A. R., Hilsenrath, E., Bhartia, P. K., Barnett, J., Beer, R., Waters, J., Gunson, M., Froidevaux, L., Gille, J., Levelt, P. F., and DeCola, P.: Overview of the EOS Aura Mission, IEEE T. Geosci. Remote, 44, 1066–1074, 2006. a, b
Sheese, P. E., Walker, K. A., and Boone, C. D.: A global enhancement of hydrogen cyanide in the lower stratosphere throughout 2016, Geophys. Res. Lett., 44, 5791–5797, https://doi.org/10.1002/2017GL073519, 2017. a
Trenberth, K. E.: Spatial and temporal variations of the Southern Oscillation, Q. J. Roy. Meteor. Soc., 102, 639–653, https://doi.org/10.1002/qj.49710243310, 1976. a
van der Werf, G. R., Randerson, J. T., Giglio, L., Collatz, G. J., Mu, M., Kasibhatla, P. S., Morton, D. C., DeFries, R. S., Jin, Y., and van Leeuwen, T. T.: Global fire emissions and the contribution of deforestation, savanna, forest, agricultural, and peat fires (1997–2009), Atmos. Chem. Phys., 10, 11707–11735, https://doi.org/10.5194/acp-10-11707-2010, 2010. a
Wand, M. P. and Jones, M. C.: Kernel Smoothing, Chapman and Hall, London, 1995. a
Waters, J. W., Froidevaux, L., Harwood, R., Jarnot, R., Pickett, H., Read, W., Siegel, P., Cofield, R., Filipiak, M., Flower, D., Holden, J., Lau, G., Livesey, N., Manney, G., Pumphrey, H., Santee, M., Wu, D., Cuddy, D., Lay, R., Loo, M., Perun, V., Schwartz, M., Stek, P., Thurstans, R., Boyles, M., Chandra, S., Chavez, M., Chen, G.-S., Chudasama, B., Dodge, R., Fuller, R., Girard, M., Jiang, J., Jiang, Y., Knosp, B., LaBelle, R., Lam, J., Lee, K., Miller, D., Oswald, J., Patel, N., Pukala, D., Quintero, O., Scaff, D., Snyder, W., Tope, M., Wagner, P., and Walch, M.: The Earth Observing System Microwave Limb Sounder (EOS MLS) on the Aura satellite, IEEE T. Geosci. Remote, 44, 1106–1121, 2006. a, b
Wolter, K. and Timlin, M. S.: Monitoring ENSO in COADS with a seasonally adjusted principal component index, Proc. of the 17th Climate Diagnostics Workshop, 52–57, NOAA/N MC/CAC, NSSL, Oklahoma Clim. Survey, CIMMS and the School of Meteor., Univ. of Oklahoma, available at: http://www.cdc.noaa.gov/people/klaus.wolter/MEI, 1993. a
Wolter, K. and Timlin, M. S.: Measuring the strength of ENSO events – how does 1997/98 rank?, Weather, 53, 315–324, 1998. a


