the Creative Commons Attribution 4.0 License.
the Creative Commons Attribution 4.0 License.
Climatic factors contributing to long-term variations in surface fine dust concentration in the United States
Paul Ginoux
High concentrations of dust particles can cause respiratory problems and increase non-accidental mortality. Studies found fine dust (with an aerodynamic diameter of less than 2.5 µm) is an important component of the total PM2.5 mass in the western and central US in spring and summer and has positive trends. This work examines climatic factors influencing long-term variations in surface fine dust concentration in the US using station data from the Interagency Monitoring Protected Visual Environments (IMPROVE) network during 1990–2015. The variations in the fine dust concentration can be largely explained by the variations in precipitation, surface bareness, and 10 m wind speed. Moreover, including convective parameters such as convective inhibition (CIN) and convective available potential energy (CAPE) that reveal the stability of the atmosphere better explains the variations and trends over the Great Plains from spring to fall.
While the positive trend of fine dust concentration in the southwestern US in spring is associated with precipitation deficit, the increase in fine dust over the central Great Plains in summer is largely associated with enhanced CIN and weakened CAPE, which are caused by increased atmospheric stability due to surface drying and lower-troposphere warming. The strengthening of the Great Plains low-level jet also contributes to the increase in fine dust concentration in the central Great Plains in summer via its positive correlation with surface winds and negative correlation with CIN.
Summer dusty days in the central Great Plains are usually associated with a westward extension of the North Atlantic subtropical high that intensifies the Great Plains low-level jet and also results in a stable atmosphere with subsidence and reduced precipitation.
- Article
(10069 KB) - Full-text XML
-
Supplement
(10707 KB) - BibTeX
- EndNote
Mineral dust is one of the most abundant atmospheric aerosols by mass. It is lifted to the atmosphere by strong wind from dry and bare surfaces. Severe dust storms have far-reaching socioeconomic impacts, affecting public transportation and health (e.g., Morman and Plumlee, 2013) by degrading visibility and causing traffic accidents, breathing problems, and lung disease. Dust storms are found to be associated with increases in non-accidental mortality in the US during 1993–2005 (Crooks et al., 2016).
Major dust sources in the US are located over the western and central US. While several deserts are located over the western US, e.g., the Mojave, Sonoran, and northern Chihuahuan deserts, over the central US the dust sources are largely anthropogenic, in association with agricultural activities (Ginoux et al., 2012). Climate models project a drying trend in the late half of the 21st century over the southwest and central US (e.g., Seager et al., 2007; Cook et al., 2015), regions largely collocated with the major dust sources in the US. This raises questions such as how future dust activities will change in the US. To project future dust variations, we first need to understand how dust activity varies in the present day. Pu and Ginoux (2017) explored this question using dust optical depth (DOD) derived from MODIS Deep Blue (M-DB2) aerosol products during 2003–2015 and found that variations in dust activity in the US are largely associated with precipitation, near-surface wind speed, and surface bareness.
While DOD describes the total optical depth of dust aerosols with different sizes and is widely used to study climate–dust interactions, fine dust with an aerodynamic diameter of less than 2.5 µm is more frequently used for air quality purposes. Fine dust contributes about 40–50 % of total particulate matter 2.5 (PM2.5) mass over the southwestern US in spring and about 20–30 % over the southwestern to central US in summer (Hand et al., 2017).
Stations in the network of the Interagency Monitoring of Protected Visual Environments (IMPROVE) have collected near-surface PM2.5 samples in the US since 1988 (Malm et al., 1994; Hand et al., 2011). Analysis of chemical elements is used to derive surface fine dust concentration. Due to its long temporal coverage, this dataset has been widely used to study long-term variations in surface fine dust in the US. Using IMPROVE data, Hand et al. (2016) found an increasing trend of fine dust in spring in the southwestern US during 1995–2014 and related this trend to a negative Pacific decadal oscillation (PDO) from 2007 to 2014. Tong et al. (2017) also found a rapid increase in dust storm activity in the southwestern US from 1988 to 2011 and related the trend to sea surface temperature variations in the Pacific. Later, Hand et al. (2017) examined the trends of IMPROVE fine dust concentration in different seasons from 2000 to 2014 and found positive trends over the southwestern US in spring and over the central US in summer and fall. Similarly, Zhang et al. (2017) also found a positive trend of fine dust over the central US from 2005 to 2015 and suggested this trend may contribute to the increase in absorbing aerosol optical depth in the region. Nonetheless, the possible causes of the fine dust trends, especially the increase in fine dust over the central US, have not been thoroughly discussed by previous studies. Here, we explore the underlying factors driving the long-term variations in fine dust from 1990 to 2015. We start with local environmental factors and then examine the possible influence of the low-level jet over the Great Plains on fine dust concentration in summer.
The following section describes the data and analysis method used in the paper. Section 3 presents our major results, and conclusions are summarized in Sect. 4.
2.1 IMPROVE fine dust
IMPROVE stations are located in national parks and wilderness areas in the US, with PM2.5 sampling performed twice weekly (Wednesday and Saturday; Malm et al., 1994) prior to 2000 and every third day afterwards. Records from 204 stations within a domain of 15–53∘ N and 60–127∘ W are used in this study, and most of the stations have data extending back more than 10 years (Fig. S1 in the Supplement). Elemental concentration is determined from X-ray fluorescence, and fine dust concentration is calculated using the concentrations of aluminum (Al), silicon (Si), calcium (Ca), iron (Fe), and titanium (Ti) by assuming oxide norms associated with predominant soil species (Malm et al., 1994; their Eq. 5). More details regarding IMPROVE stations, sampling, and the analysis method can be found in previous studies (Hand et al., 2011, 2012, 2016, 2017).
We averaged daily station data to monthly means and then interpolated them to a 0.5∘ by 0.5∘ grid using inverse distance weighted interpolation, i.e., weights depending on the inverse cubic distance between the site location and the interpolated grid point. All daily data are used to calculate monthly mean. We tried the criteria of about 50 % completeness (i.e., at least five records in each month) for calculating monthly mean, and the results are similar. In daily composite analysis, daily station data are interpolated to a 0.5∘ by 0.5∘ grid using the same method. Least-squares linear trend analysis is applied to the interpolated data, and a Student's t test is used for statistical significance. We realize that the time-varying station numbers could contribute to the uncertainties of our trend analysis; thus similar analysis is also applied to station data with long-term records (see Fig. 1 for details).
Following Pu and Ginoux (2017), two dusty regions are selected for analysis. The southwestern US (WST for short; 32–42∘ N, 105–124∘ W) and Great Plains (GP for short; 25–49∘ N, 95–105∘ W) cover the major dust source regions in the US (black boxes in Fig. 1). In later analyses, we also focus on the central Great Plains (CGP for short; 32–40∘ N, 95–102∘ W) in summer to examine the positive trend of fine dust in the region.
2.2 Cloud-Aerosol Lidar with Orthogonal Polarization (CALIOP) products
CALIOP is the two-wavelength polarization lidar carried by the Cloud-Aerosol Lidar and Infrared Pathfinder Satellite Observation (CALIPSO) satellite, which was launched in April 2006 (Winker et al., 2004, 2007). CALIOP measures backscattered radiances attenuated by the presence of aerosols and clouds, whose microphysical and optical properties are retrieved. Daily products are available since June 2006. To examine the vertical profile of dust concentration in the US, both the daily 532 nm total attenuated backscatter from the Level 1 product and the depolarization ratio from the Level 2 product are used. The depolarization ratio can be used to separate spherical and nonspherical hydrometeors and aerosols (Sassen, 1991), and here a threshold of 0.2 is used to separate non-spherical dust from other aerosols (Li et al., 2010).
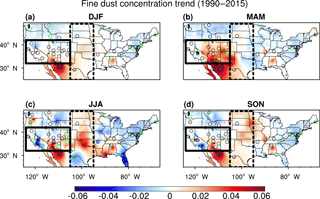
Figure 1Trend (shading) of fine dust concentration (µg m−3) from 1990 to 2015 in (a) DJF, (b) MAM, (c) JJA, and (d) SON from IMPROVE gridded data. Dotted areas are significant at the 95 % confidence level. The colored circles show the trend at IMPROVE stations with consecutive records for at least 23 years during 1990–2015. Circles with green outlines denote that the trend is significant at the 90 % confidence level. Black boxes denote the averaging areas of the southwestern US (solid) and the Great Plains (dashed).
2.3 Precipitation
The Precipitation Reconstruction over Land (PRECL; Chen et al., 2002) from the National Oceanic and Atmospheric Administration (NOAA) is a global analysis available monthly from 1948 to present at a 1∘ by 1∘ resolution. Its relatively high resolution and long records are suitable to study long-term connections between fine dust and precipitation. The dataset is derived from gauge observations from the Global Historical Climatology Network (GHCN), version 2 and the Climate Anomaly Monitoring System (CAMS) datasets. Monthly precipitation from 1990 to 2015 is used.
2.4 Leaf area index (LAI)
Monthly LAI derived from version 4 of Climate Data Record (CDR) of Advanced Very High Resolution Radiometer (AVHRR) surface reflectance (Claverie et al., 2014) and produced by the National Aeronautics and Space Administration (NASA) Goddard Space Flight Center (GSFC) and the University of Maryland is used. The gridded monthly data are on a 0.05∘ by 0.05∘ horizontal resolution and available from 1981 to present. A detailed discussion on the algorithm and evaluation of the dataset can be found in Claverie et al. (2016). This dataset is selected due to its high spatial resolution and long temporal coverage. Monthly data from 1990 to 2015 are used.
Surface bareness is derived from seasonal mean LAI and is calculated following Pu and Ginoux (2017),
2.5 Reanalysis
North American Regional Reanalysis (NARR; Mesinger et al., 2006) provides 3-hourly, daily, and monthly meteorological variables from 1979 to the present at a high spatial resolution (i.e., about 32 km horizontally). Precipitation in the NARR is assimilated with observations. Here daily precipitation is used for daily composite analysis in Sect. 3.3.2. The reanalysis reasonably captures the hydroclimatic fields in the continental US on multiple timescales (Ruiz-Barradas and Nigam, 2006; Ruane, 2010a, b); thus it is suitable to study the connection between fine dust concentration and local hydroclimatic variables. Daily and monthly convective variables such as convective inhibition (CIN) and convective available potential energy (CAPE) are used. CIN is defined as the energy that a parcel needs to overcome to rise above the level of free convection (LFC) and is usually written as
where PLFC is the pressure at LFC, Psfc is the pressure at the surface, Rd is the specific gas constant for dry air, Tvp is the virtual temperature of the lifted parcel, and Tve is the virtual temperature of the environment. CIN is usually a negative variable, with bigger CIN (in absolute value) indicating greater inhibition. On the other hand, CAPE describes the positive buoyancy of an air particle from the LFC to the equilibrium level (neutral buoyancy), and can be written as:
where PEL is the pressure at the equilibrium level. Both CIN and CAPE describe the stability of the atmosphere, and usually convection easily occurs when CAPE is high and CIN is low (in absolute value; e.g., Colby, 1984; Riemann-Campe et al., 2009; Myoung and Nielsen-Gammon, 2010a). Note the two variables can sometimes vary in opposite directions. Indeed, when CAPE is high, strong inhibition may still prohibit the occurrence of deep convection.
In addition, daily and monthly means of horizontal wind speed at 900 hPa, temperature at 700 hPa (T700), 10 m wind speed, dew point temperature (Tdp), and 2 m air temperature (T2m), total cloud cover, and total and convective precipitation are used.
Another reanalysis used in this work is ERA-Interim (Dee et al., 2011) from the European Centre for Medium-Range Weather Forecasts (ECMWF). ERA-Interim is a global reanalysis with a horizontal resolution of T255 (about 0.7∘ or 80 km) and 37 vertical levels, available from 1979 to present. It complements the regional reanalysis by providing a larger domain to analyze circulation variations and also a few surface variables (such as surface turbulent stress) that are not available in the NARR. We use 6-hourly analysis and 3-hourly forecast variables such as surface turbulent stress, vertical and horizontal winds, air temperature, and specific humidity from 1000 to 200 hPa, 850 hPa winds, and geopotential height to calculate daily means of these variables.
2.6 Multiple-linear regression
To understand the connection between the potentially controlling factors and the variation in fine dust concentration, multiple-linear regressions are applied by regressing the observed gridded fine dust concentration onto three, four, or five standardized controlling factors, a method similar to the one used by Pu and Ginoux (2017). Since multiple controlling factors and gridded surface fine dust have different horizontal resolutions, for the regression analysis we first interpolated all variables to a 1∘ by 1∘ grid, then applied the regression at each grid point.
The fine dust concentration can be reconstructed by using the regression coefficients and observed variations in the controlling factors (such as precipitation, surface wind, and bareness). We focus our analysis on two statistical properties: correlations of regional averaged time series and (centered) pattern correlations (e.g., Pu et al., 2016b) for the trends. These two properties are calculated for both observed and regression-model-estimated (i.e., reconstructed) fine dust concentrations.
3.1 Trends of surface fine dust concentration during 1990–2015 and local controlling factors
Figure 1 shows the trend of fine dust concentration from gridded data (shading) and also those from stations with at least 23 years of consecutive records (colored circles) from 1990 to 2015. Most long-term sites show trends similar to those from the interpolated data, with a few exceptions, e.g., over northern Alabama, where interpolated data show positive trends due to the influence of nearby stations with shorter records (Fig. S1 in the Supplement). Significant positive trends are found over the southwestern US in spring (MAM), over the central to southern Great Plains in summer (JJA), and the northern Great Plains in fall (SON). Dust concentration also increases over southwestern Arizona (up to 0.06 µg m−3 yr−1), by about 2.5 % of its climatological value (Fig. S2 in the Supplement) per year, in all seasons. A similar increasing trend of fine dust in southern Arizona in spring from 1988 to 2009 is also noticed by Sorooshian et al. (2011). A decreasing trend is found over the northeastern US in all seasons as well. The overall pattern is somewhat similar to the trend identified by Hand et al. (2017; their Fig. 9) for 2000–2014, who also found increasing trends of fine dust in the southwestern US in spring and over the CGP in summer. One thing we want to point out here is that most of the stations in the Great Plains have records shorter than 15 years, with only three stations having records for more than 25 years (Fig. S1 in the Supplement); therefore the positive trends here are combinations of interpolated information from nearby stations in the early period (before ∼ 2002) and more reliable data largely from local stations in the late period.
As suggested by previous studies, the trend of fine dust may be biased due to suspicious trends in some chemical species (Al, Si, and Ti) used to construct fine dust in association with changes of analytical methods (e.g., Hyslop et al., 2015; Hand et al., 2016, 2017). Fe has been suggested as a good proxy of fine dust since it's more stable and is a key component of dust (Hand et al., 2016, 2017). We examined the trend of fine Fe (Fig. S3 in the Supplement) and found the pattern is very similar to the trend of fine dust. In fact, we found the correlations between seasonal mean fine dust and Fe (both gridded data and long-term stations) are around 0.90 (significant at the 99 % confidence level) in most parts of the US during 1990–2015 (Fig. S4 in the Supplement). This suggests the trends revealed directly from the surface fine dust record are comparably reliable as those calculated from Fe. Thus we use fine dust concentration for this analysis.
What are the dominant factors influencing the variations in surface fine dust concentration? Hand et al. (2016) found that the PDO played an important role in the variability in fine dust concentration over the southwestern US in March by creating a windier, drier, and less-vegetated environment. We would like to extend their analysis to other seasons and regions. In addition, we focus on identifying key controlling factors at the local level because remote forcings such as the PDO influence dust variations through their tele-connection with local controlling factors. Pu and Ginoux (2017) found that local precipitation, surface bareness, and surface wind speed could explain 49 to 88 % of the variances in dust event frequency (derived from DOD) over the western US and the Great Plains in different seasons from 2003 to 2015. We first examine to what extent these factors can explain the variance in near-surface fine dust concentration. Similar to Pu and Ginoux (2017), we do not separate the contribution from local emissions or remote transport to the fine dust concentration, although contributions from Asian dust in spring over the western US (Fischer et al., 2009; Creamean et al., 2014; Yu et al., 2012) and from North African dust in summer over the southeastern US (Perry et al., 1997; Prospero, 1999a) have been observed.
Figure 2a–d show the dominant controlling factor among precipitation, surface wind, and bareness for fine dust concentration variations on the interannual timescale from 1990 to 2015 at each grid point. Precipitation plays an important role in most parts of the southern US in winter. In spring, surface wind starts to dominate the variations in fine dust along the Gulf of Mexico coast and eastern Great Plains, consistent with the intensification of the Great Plains low-level jet (e.g., Helfand and Schubert, 1995; Weaver and Nigam, 2008; Pu and Dickinson, 2014; Pu et al., 2016a) in April and May, while bareness is important over the western Great Plains and the Midwest. During summer, the influence of surface wind speed gets stronger, especially over western Arizona and the lower Mississippi basin, whereas bareness and precipitation are also important in many parts of the Great Plains and western US. Precipitation becomes the dominant factor over most parts of the US again in fall, with surface winds playing a weak role over the southeast and northeast coasts.
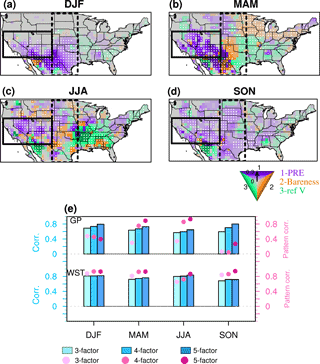
Figure 2(a–d) Multiple-linear regression coefficients calculated by regressing fine dust concentration from 1990 to 2015 onto standardized precipitation (purple), bareness (orange), and surface wind (green). Color denotes the most influential factor at each grid (i.e., the largest regression coefficient in absolute value among the three), while saturation of the color shows the magnitude of the coefficient (0 to 0.3). Areas significant at the 95 % confidence levels are dotted. (e) Bar plot showing the correlations between observed regional mean fine dust concentration and the reconstructed concentration using three, four, and five controlling factors (light, median, and deep blue), and pattern correlation between trends from the observation and from reconstructed fine dust using three, four, and five factors (light, medium, and deep pink) in the Great Plains (GP) and the southwestern US (WST, black boxes in panels a–d). “Three-factor” denotes precipitation, bareness, and surface wind; “four-factor” denotes precipitation, bareness, surface wind, and CIN; “five-factor” denotes precipitation, bareness, surface wind, CIN, and CAPE. Black boxes denote the averaging areas of the WST (solid) and GP (dashed).
The regression coefficients obtained here share some similarity with those shown by Pu and Ginoux (2017; their Fig. 4) using DOD, e.g., the importance of surface bareness in the Great Plains in spring and summer. However, there are also quite large differences, likely due to different periods of regression and the fact that the DOD and surface fine dust concentration are not always linearly related to each other (Fig. S5 in the Supplement). Fine dust covers a small fraction of the total mass distribution of dust particles; thus the connections between fine dust concentration and the controlling factors could be different from those with the DOD. For example, the scavenging effect of precipitation is more efficient on small particles (e.g., Zender et al., 2003) and as a result precipitation generally plays an overall more important role in fine dust variations than in the DOD, especially in winter, spring, and fall.
The correlations of regional averaged time series between reconstructed fine dust concentration in the southwestern US (using regression coefficients and observed variations in precipitation, surface wind, and bareness) and that from the IMPROVE range from 0.69 in fall to 0.82 in winter, indicating that the three factors above explain about 48 to 67 % of variance in fine dust in the southwestern US from 1990 to 2015. Over the Great Plains, these factors only explain 32 to 48 % of variance statistically, much lower than over the southwestern US. Also note the low confidence level of the regression coefficients over the CGP in summer (Fig. 2c), which indicates that the above three factors are not sufficient to well explain the variations of fine dust in the Great Plains.
The development of dust storms has long been related to convection and atmospheric stability (e.g., Marsham et al., 2008; Cuesta et al., 2009). Here we examine whether the variances in fine dust concentration and trend can be better represented by adding CIN (i.e., four-factor) and both CIN and CAPE (i.e., five-factor) in addition to the three factors (i.e., three-factor) discussed above.
Figure 2e shows correlations (blue bars) between the observed and the reconstructed regional mean fine dust concentration using three-, four-, and five-factor regressions and corresponding pattern correlations (pink dots) between trends from the observed and reconstructed fine dust for the Great Plains and the southwestern US. Over the Great Plains, pattern correlations are largely improved when including CIN and CAPE, especially in spring (from 0.30 to 0.89) and summer (from 0.34 to 0.93), although slightly decreased in winter. The correlations of regional mean time series between the reconstructed and observed fine dust are also slightly improved from a three-factor regression to five-factor regression. Over the southwestern US, the improvement of pattern correlation is smaller, and the correlations of time series change little when including CIN and CAPE.
The collinearity among the factors used in the multiple linear regression can be examined by the variance inflation factor (VIF; O'Brien, 2007; Abudu et al., 2011), and usually values between 5 and 10 are considered high collinearity and the results of regression are less reliable. Increasing the number of predictors in multiple linear regression generally increases VIFs. The VIFs for three-factor regression are around 1 and 2 in most areas, with a few spots around 3 (not shown), while the VIFs for five-factor regression are slightly higher, especially for CIN and CAPE over the southwestern US (Figs. S6 and S7 in the Supplement). The increase in VIF and relatively weak improvement in the correlations in the southwestern US when adding the convective factors suggest that three factors (precipitation, surface wind, and bareness) are sufficient to capture the variations and trend in surface fine dust in the region. Over the Great Plains, adding CIN and CAPE can better explain the variations.
We now examine key factors driving the observed positive trends of fine dust concentration in spring and summer, the dustiest seasons (Fig. S2 in the Supplement), based on the analysis above. Specifically, we focus on the positive trends of surface fine dust over the southwestern US in spring and over the CGP in summer (Fig. 1b and c). Figure 3a shows the trend of observed and reconstructed fine dust concentrations in spring along with three components contributed to the reconstructed trend (i.e., from precipitation, bareness, and surface wind). The reconstructed trend (Reg (all)) largely captures the positive trend in the southwestern US shown in the observation (Obs). Among the three factors, precipitation plays the most important role in contributing to the positive trend over the southwestern US, consistent with its dominant role in explaining observed interannual variability (Fig. 2b). The increase in fine dust is mainly associated with a decreasing trend of precipitation in the southwestern US (Fig. 3b). Such a drying trend has been related to an increase in anticyclonic conditions in the northeastern Pacific (Prein et al., 2016) and an intensification of Pacific trades during 2002–2012 (Delworth et al., 2015).
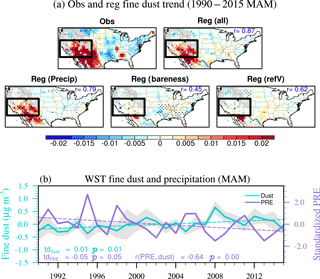
Figure 3(a) Observed (Obs) and reconstructed (Reg) trends of fine dust concentration (µg m−3) using three factors in spring from 1990 to 2015. The contributions from each factor (precipitation, bareness, and surface wind) to the overall reconstructed trend are also shown (second row). Dotted areas are significant at the 90 % confidence level. Pattern correlation between reconstructed dust concentration trends and observed trends in the domain (25–49.5∘ N, 66.5–125∘ W) are shown at the top right corner of each plot. The black box denotes the southwestern US (WST). (b) Time series of fine dust concentration (cyan) and precipitation (purple) averaged over the WST and their linear trends (dashed lines; values are listed at bottom left) in spring from 1990 to 2015. Grey shading denotes ± 1 standard error of the observations. The correlation between fine dust and precipitation is also listed at the bottom in purple.
The reconstructed summer trend using coefficients from five-factor regression is very similar to the observation, with a pattern correlation of 0.95 in the domain (Fig. 4a). The positive trend over the CGP is largely contributed by CIN, with a positive center at northern Texas, western Kansas, and Oklahoma. Parts of the positive trend over Oklahoma and western Kansas are contributed by CAPE. In fact, both CIN and CAPE have significant negative trends over the CGP, although the trend of CAPE is slightly weaker than that of CIN (Fig. 4b). A decrease in CIN (i.e., an increase in its absolute value) denotes an increasing inhibition of convection, while weakened CAPE denotes a decreasing instability associated with moist convection. Note that CIN is also significantly negatively correlated with fine dust concentration on an interannual timescale (r = −0.39, p = 0.05). This again indicates that CIN plays a more important role than CAPE in the recent positive trend of fine dust.
Both the trends of the CIN and CAPE denote an increase in atmospheric stability. Changes of CIN and CAPE have been related to boundary layer or near-surface temperature and moisture (e.g., Ye et al., 1998; Gettelman et al., 2002; Alappattu and Kunhikrishnan, 2009). Myoung and Nielsen-Gammon (2010b) found that the variations in CIN over Texas in the warm season can be represented well by the differences of temperature at 700 hPa (T700) and surface dew point temperature (Tdp), i.e., T700−Tdp. While T700 is a good proxy for temperature at the free troposphere below the LFC, Tdp denotes the dryness at the surface. Thus, T700−Tdp represents a joint effect of surface drying and warming at 700 hPa, a positive anomaly of which indicates increased atmospheric stability. Here we find both CIN and CAPE have significant negative correlations with T700−Tdp over the CGP (Fig. 4c). A significant positive trend of T700−Tdp is also found, supporting the assumption that the atmospheric stability is enhanced during the period. Such a change of stability is largely due to the increase in T700, although surface drying also contributes.
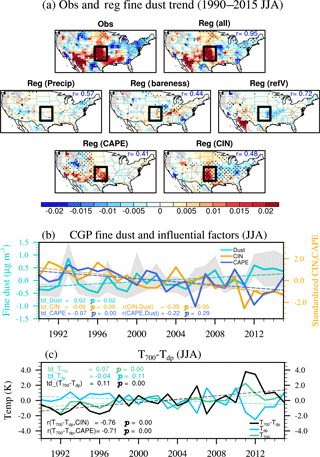
Figure 4(a) Observed (Obs) and reconstructed (Reg) trends of fine dust concentration (µg m−3) using five factors in summer from 1990–2015. The contributions from each factor (precipitation, bareness, surface wind, CAPE, and CIN) are also shown (second and third rows). Dotted areas are significant at the 90 % confidence level. Pattern correlation between reconstructed dust concentration trends and the observed trends in the domain (25–49.5∘ N, 66.5–125∘ W) are shown at the right corner of each plot. The black box denotes the central Great Plains (CGP). (b) Time series of fine dust concentration (cyan), CIN (orange), and CAPE (deep blue) averaged over the CGP and their linear trends (dashed lines) in summer from 1990 to 2015. Grey shading denotes ± 1 standard error of the observations. (c) Time series of T700−Tdp (black), T700 (green), and Tdp (light blue) and their linear trends (dashed lines) in summer from 1990 to 2015.
CIN is also found to be significantly correlated with rain days (daily precipitation ≥ 1 mm day−1) in summer in Texas (Myoung and Nielsen-Gammon, 2010b). Here a similar positive correlation between CIN and rain days in the CGP is also found from 1990 to 2015 (r = 0.79, p < 0.001), suggesting that CIN could influence fine dust concentration via its connection with rain days. A stable atmosphere prevents deep moist convection, which reduces the chance of scavenging by precipitation, and also likely prevents dilution of fine dust concentration in the boundary layer with the clean air above through convective mixing. The connection underlying CIN and fine dust concentration is further discussed in Sect. 3.3 using daily data.
3.2 The connection between the Great Plains low-level jet and summertime fine dust variations in the CGP
An important feature related to the moisture and heat transport and precipitation in the Great Plains from late spring to summer is the Great Plains low-level jet, which develops in April and reaches its maximum wind speed in June and July at around 900 hPa (e.g., Weaver and Nigam, 2008; Pu et al., 2016a). The southerly jet covers most of the southern to central Great Plains, and turns into a westerly around 40∘ N passing through the Midwest. How this jet may influence the dust concentration in the CGP in summer is examined here.
Figure 5a shows the time series of the jet index in summer following the definition of Weaver and Nigam (2008) by averaging 900 hPa meridional wind speed at the jet core (25–35∘ N, 97–102∘ W) from 1990 to 2015. The jet index is significantly positively correlated with fine dust concentration in the CGP in summer (r = 0.56, p < 0.01) and also has a significant positive trend, suggesting that the jet also contributes to the increase in fine dust in the CGP. Such a positive connection between the jet and fine dust concentration can be explained by the jet's negative correlation with CIN and positive correlation with the near-surface wind speed in the CGP (Fig. 5b). An intensified jet increases the near-surface wind speed and meanwhile increases the stability of atmosphere over the CGP by advecting moisture away to the Midwest.
Because most of the IMPROVE sites (four out of six) in the CGP only have records since 2002, correlations between the jet index and fine dust concentration, CIN, and surface wind for 2002–2015 are also calculated (Fig. 5c). The patterns are similar to those during 1990–2015.
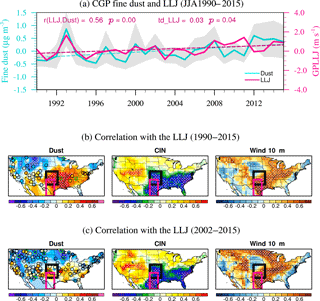
Figure 5(a) Time series of fine dust concentration (µg m−3) averaged in the CGP (cyan) and the index of the Great Plains low-level jet (magenta) and their trends (dashed line) in JJA from 1990 to 2015. Grey shading denotes ± 1 standard error of the observations. Correlations between the jet index and fine dust concentration, CIN, and near-surface wind speed for (b) 1990–2015 and (c) 2002–2015. Colored circles denote correlations at IMPROVE stations, with green outlines denoting that the correlation is significant at the 90 % confidence level. Areas significant at the 95 % confidence level are dotted in panel (b) and areas significant at the 90 % confidence level are dotted in panel (c). The black box in panels (b–c) denotes the CGP region, and the deep pink box denotes the averaging area for the jet index.
Dust from Africa can be transported to the southeastern US and even Texas in summer (e.g., Perry et al., 1997; Prospero, 1999a, b; Prospero et al., 2010, 2014; Bozlaker et al., 2013). Can the intensified jet transport more African dust and thus contribute to the increase in fine dust in the CGP? Fully addressing this question will require a dust model that can reproduce the emission and transport processes of African dust well, which is beyond the scope of this paper. Here we discuss this question based on observational analysis. The regression and trend analysis above suggests that local atmospheric stability largely contributes to the positive trend. Since African dust is transported to the continental US passing through the Caribbean Sea and the Gulf of Mexico, we assume that the variations in fine dust at stations nearby would reveal the influence of African dust. Two of such stations, VIIS1 (18.3∘ N, 64.8∘ W) in the Virgin Islands National Park and EVER1 (25.4∘ N, 80.7∘ W) in the Everglades National Park, are used. It is found that the records from these stations have significantly positive correlations with fine dust concentration over the southeastern US in JJA, but not over the CGP (Fig. S8 in the Supplement). This suggests that the influence of African dust is largely over the southeastern US on seasonal mean, consistent with the results of Hand et al. (2017), who found the influence of North African dust is mainly over the southeastern US, Appalachia, and Virgin Islands regions in summer as indicated by a shift of elemental composition at IMPROVE sites.
3.3 Factors contributing to high dust concentration over the CGP in summer
While the negative correlation between fine dust concentration and precipitation in the southwestern US is straightforward, the correlation between fine dust and CIN in the CGP is less obvious. Here we further examine the connection between fine dust and CIN and other factors associated with high dust concentration in the area using daily events. As mentioned earlier, since most stations in the CGP have records since 2002, the following analysis focuses on summer during 2002–2015.
3.3.1 Connection between surface fine dust concentration and CIN
What's the physical connection between CIN and surface fine dust concentration? Here we first explore the connection between CIN and a variable that is closely related to dust emission. Figure 6a–c show the scatter plot of standardized (means are removed and then divided by 1 standard deviation) CIN and friction velocity (U∗) anomalies, for all the days in summer from 2002 to 2015, days when IMPROVE records are available (431 days), and dusty days, defined as days when daily anomaly of IMPROVE observation is greater than 1 standard deviation (52 days), respectively. U∗ is defined as the following:
where τ is the Reynolds stress and ρ is air density, and and are the vertical flux of horizontal momentum. We calculated U∗ using components of surface turbulent stress (, from ERA-Interim. U∗ has long been related to dust emission (e.g., Gillette and Passi, 1988; Marticorena and Bergametti, 1995; Zender et al., 2003). As shown in Fig. 6a–c, CIN is significantly negatively related to U∗ on all summer days and dusty days. This indicates a large negative CIN, or great inhibition for convection, and is related to stronger near-surface turbulent fluxes and U∗. How does CIN influence U∗?

Figure 6Scatter plot of standardized friction velocity (U∗) and CIN anomalies for (a) all days in JJA from 2002 to 2015, (b) days when fine dust data are available, and (c) dusty days (when daily fine dust concentration anomaly is greater than 1 standard deviation).
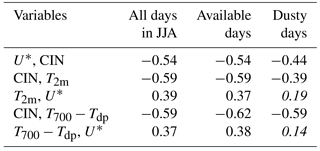
In the CGP, both CIN and U∗ are significantly correlated with near-surface temperature, T2m, in JJA and for days when fine dust records are available (Table 1), indicating that CIN is connected with U∗ via their mutual connection with near-surface temperature. Note such a connection seems not valid during dusty days (correlation between T2m and U∗ is not significant). Similarly, we found significant correlations between CIN and T700−Tdp and between T700−Tdp and U∗ (Table 1). This again suggests that CIN is connected with U∗ via its connection with surface variables such as temperature and dryness. Variables in Table 1 are all from ERA-Interim (except CIN) to be consistent with U∗. Results are similar if using NARR variables.
One hypothesis for the connection between CIN and U∗ on dusty days is shown in Table 2. A significant positive correlation between CIN and vertical wind at 850 hPa (w850) is found, indicating that when the inhibition is strong, it favors subsidence. This is consistent with the finding by Riemann-Campe et al. (2009), who found in climatology a high CIN value is located over subtropical regions with strong subsidence. The subsidence may transport momentum downward and promote U∗. This is consistent with the negative correlation between U∗ and w850 (Table 2). However, we also notice that the on dusty days connections above are not valid if using w850 from the NARR, suggesting further investigation on this mechanism is needed.
Table 1Correlations between friction velocity (U∗) and CIN, CIN and 2 m temperature (T2m), T2m and U∗, T700−Tdp (the differences between air temperature at 700 hPa and 2 m dew point temperature) and CIN, and T700−Tdp and U∗ for all days in JJA from 2002 to 2015 (1288 days), days when fine dust concentration is available (431 days), and dusty days (52 days). All values are significant at the 95 % confidence level (t test) except those listed in italic.
In addition to the connection between CIN and surface variables, the possible mechanism that strong inhibition prevents dilution is also examined. We found four examples in CALIOP snapshots over the CGP when the daily anomaly of near-surface fine dust concentration from the IMPROVE network is greater than 1 standard deviation. Figure 7 shows nighttime 532 nm total attenuated backscatter (shading) on 10 August 2007 (top) and on 21 June 2013 (bottom). Black contours show the area with a depolarization ratio ≥ 0.2, denoting dust aerosols. In both cases, the inhibition is quite strong, with the daily CIN anomaly greater than 1 standard deviation. The difference between the two cases is that on 21 June 2013 CAPE is higher, which leads to some convection as denoted by the clouds above. However, in both cases, with strong inhibition, dust particles are largely located in a layer between the surface and 2 km. Figure 8 shows a different situation when CIN has a positive anomaly (i.e., weak inhibition). In these cases, dust particles extend up to 4 km, and surface fine dust concentrations in the CGP (with anomalies of 2.3 and 2.1 µg m−3) are also lower than those in Fig. 7 (with anomalies of 4.0 and 7.1 µg m−3). Nonetheless, more cases are needed to further verify this mechanism. The anomalous high fine dust concentration in Everglades National Park (Figs. 7–8) in three of the four cases shown here suggests that there may be a contribution from African dust on these days, but further analyses are needed to clarify the magnitude of its contribution.
Table 2Correlations between U∗ and CIN, CIN and vertical wind speed at 850 hPa (w850), and w850 and U∗ during dusty days in JJA from 2002 to 2015. All values are significant at the 95 % confidence level, except the value significant at the 90 % confidence level, labeled with a “+” (t test).
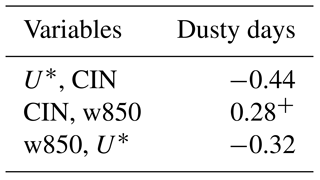
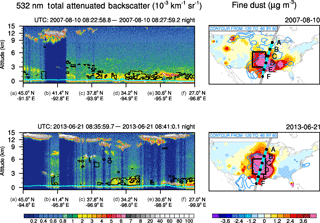
Figure 7Nighttime 532 nm total attenuated backscatter (shading) and depolarization ratio (black contours, values ≥ 0.2 are shown) from CALIOP on 10 August 2007 (top left) and on 21 June 2013 (bottom left), along with daily anomalies of fine dust concentration (µg m−3; shading, right column) and CIN (blue contour, only negative values from −60 to −120 J kg−1 are shown). CALIOP orbit tracks are shown in grey lines (right column) with the cyan part and sampling points (a–f) denoting the cross section shown in the left column. Black boxes denote the CGP region.
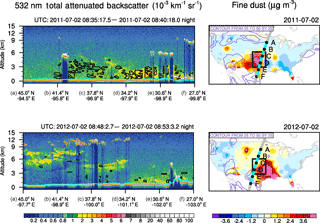
Figure 8Same as Fig. 7 but for 2 July 2011 (top) and 2 July 2012 (bottom). Only positive CIN anomalies from 25 to 50 J kg−1 are shown (light purple contour).
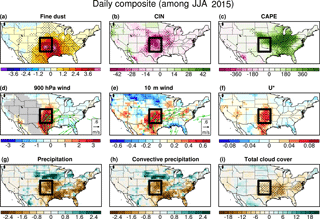
Figure 9Daily composites of the anomalies of (a) fine dust concentration (µg m−3), (b) CIN (J kg−1), (c) CAPE (J kg−1), (d) 900 hPa wind speed (m s−1), (e) 10 m wind speed (m s−1), (f) U∗ (m s−1), (g) total precipitation (mm day−1), (h) convective precipitation (mm day−1), and (i) total cloud cover (%) during dusty days in JJA from 2002 to 2015. Dotted areas are significant at the 95 % confidence level. Shown in panels (d) and (e) are the 900 hPa and 10 m wind anomalies (green vectors) significant at the 95 % confidence level, respectively. Black boxes denote the CGP region.
3.3.2 Large-scale circulation pattern on dusty days
Figure 9 shows the daily composites of related meteorological variables on dusty days, i.e., when the daily anomaly of CGP fine dust concentration is greater than 1 standard deviation. Anomalous high fine dust concentration is associated with a reduced CIN (Fig. 9b) in the CGP, but not so much with CAPE (Fig. 9c). CAPE is anomalously enhanced over the northern Great Plains and the Midwest. Both the Great Plains low-level jet, near-surface wind, and friction velocity are enhanced (Fig. 9d–f). Precipitation (mostly convective precipitation) in the CGP also decreases with reduced cloud cover but increases in the north (Fig. 9g–i), consistent with enhanced CAPE there. These features are quite consistent with our analysis above on the favorable condition of enhanced fine dust in the CGP.
Figure 10 shows the composites of vertical velocity (shading), vertical and meridional wind vectors, specific humidity (purple contours), and potential temperature (grey contours) zonally averaged over the CGP (95–102∘ W), along with fine dust concentration (orange line). Anomalous dry subsidence is centered at 30–36∘ N, with anomalous southerly winds at low level associated with an intensified jet, while a rising motion of moist air is located around 38-42∘ N with a maximum at 700–400 hPa. The dipole pattern of anomalous vertical velocity is consistent with the precipitation anomaly in the area (Fig. 9g–h). The anomalous potential temperature contour is quite uniform near the surface at 30–36∘ N with an inversion around 700 hPa, indicating a well-mixed boundary layer in the region with increased fine dust.
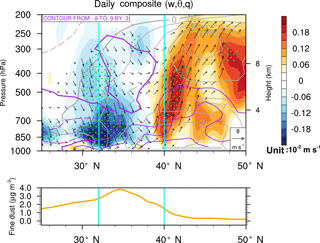
Figure 10Daily composite of the anomalies of vertical velocity (shading; 10−2 m s−1), potential temperature (grey contours; K), and specific humidity (purple contours; g kg−1) from ERA-Interim, and fine dust concentration anomalies (bottom; orange line) averaged between 95 and 102∘ W for dusty days in JJA from 2002 to 2015. The dotted area denotes vertical velocity significant at the 90 % confidence level. Topography is outlined in grey. Cyan lines denote the domain of the CGP.
What causes the changes of atmospheric stability, precipitation, and winds? Figure 11 shows the composites of T2m and geopotential height and winds at 850 hPa during dusty days. Following L. F. Li et al. (2012), 1560 gpm contour is used here to denote the western edge of the North Atlantic subtropical high in the 2002–2015 climatology (blue) and on dusty days (red). A westward extension of the subtropical high during dust days is quite evident, with enhanced geopotential height over the southeastern US and the Gulf of Mexico (Fig. 11b). Such a westward extension of the subtropical high intensifies the low-level jet by increasing the zonal pressure gradient and also contributes to the anomalous precipitation and vertical velocity patterns, as similar patterns are found in previous studies associated with a westward extension of the subtropical high (e.g., L. F. Li et al., 2012; their Figs. 3a and 4a). The formation of the North Atlantic subtropical high has been related to the land–sea heating contrast (Wu and Liu, 2003; Liu et al., 2004; Miyasaka and Nakamura, 2005; L. F. Li et al., 2012; W. H. Li et al., 2012). One possible reason of the westward extension of the subtropical high is the anomalous surface warming over a large part of the central and eastern US (Fig. 11a) on dusty days that enhances the land–sea temperature gradient.
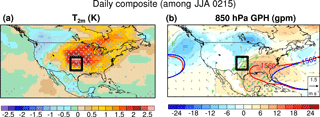
Figure 11Daily composites of the anomalies of (a) T2m (K) and (b) 850 hPa geopotential height (gpm) and horizontal wind vectors (m s−1; grey) from ERA-Interim averaged over dusty days in JJA from 2002 to 2015. Blue and red contours in panel (b) denote 1560 gpm in the climatology (2002–2015) and during dusty days, respectively. Areas significant at the 95 % confidence level are dotted. Wind vectors significant at the 95 % confidence level are plotted in green. Black boxes denote the CGP region.
Fine dust is an important component in the total PM2.5 mass in the western to central US in spring and summer (Hand et al., 2017). Previous studies found positive trends of fine dust concentration in the southwestern US in spring and the central US in summer in the past 20 years (Hand et al., 2016, 2017; Zhang et al., 2017), but the underlying causes are not clear, especially for the positive trend over the central US. This study examined local controlling factors associated with variations in near-surface fine dust concentration from Interagency Monitoring of Protected Visual Environments (IMPROVE) stations for 1990–2015. While precipitation, surface bareness, and surface wind speed largely control the variation in fine dust concentration in the southwestern US, including two convective parameters that reveal the stability of the atmosphere, including convective inhibition (CIN) and convective available potential energy (CAPE), better explains the variations over the Great Plains from spring to fall.
In particular, we found that the increasing trend of fine dust concentration over the southwestern US in spring is associated with a significantly decreasing trend of precipitation, while the positive trend of fine dust over the central Great Plains (CGP) is largely due to enhanced atmospheric stability revealed by enhanced CIN (greater inhibition) and decreased CAPE. Such a stability change is associated with surface drying and warming in the lower troposphere around 700 hPa, i.e., a positive trend of T700−Tdp. A stable atmosphere prevents moist convection that can remove fine dust by in-cloud or precipitation scavenging and also likely prevents the dilution of fine dust concentration by prohibiting convective mixing between the dusty boundary layer air and the clean air above.
The variations in the fine dust concentration in the CGP are also significantly correlated to the Great Plains low-level jet, with a stronger jet corresponding to a higher fine dust concentration. Such a connection is largely due to the jet's positive correlation with surface wind speed and negative correlation with CIN.
The influence of CIN on dust emission in the CGP is examined using daily data in summer. It is found that CIN is significantly negatively related to surface friction velocity (U∗), i.e., with greater inhibition in association with stronger U∗. Such a connection is largely due to CIN's connection with surface variables such as 2 m temperature and dew point temperature. During dusty days, another possible connection is that the anomalous subsidence associated with strong inhibition may transport momentum downward and increase surface U∗.
Dusty days in the CGP in summer are associated with a westward extension of the North Atlantic subtropical high that intensifies the Great Plains low-level jet and surface wind speed, increases atmospheric stability, and also creates anomalous subsidence over the southern to central Great Plains and reduces precipitation. The westward extension of the subtropical high is likely associated with the anomalous surface warming over the central to eastern US.
Our findings have important implications for future projections of fine dust variation in the US. Climate models have projected drying trends over the southwestern and the central US (e.g., Seager et al., 2007; Cook et al., 2015) as well as an intensification of the North Atlantic subtropical high (W. H. Li et al., 2012) in the late 21st century, all favorable to an increase in fine dust in the southwestern US and CGP. Whether current increasing trends of fine dust will persist into the future requires further investigations that include factors not discussed here such as changes of anthropogenic land use, local synoptic-scale systems (e.g., cyclones and fronts), and remote forcings.
IMPROVE fine dust data are downloaded from http://views.cira.colostate.edu/fed/DataWizard/ (last access: March 2017, Malm et al., 1994; Hand et al., 2011). AVHRR leaf area index data are available at: https://www.ngdc.noaa.gov/docucomp/page?xml=NOAA/NESDIS/NCDC/Geoportal/iso/xml/C00898.xml&view=getDataView&header=none (last access: March 2017, Claverie et al., 2014). PRECL Precipitation data are provided by the NOAA/OAR/ESRL PSD, Boulder, Colorado, USA, from their website at http://www.esrl.noaa.gov/psd/ (last access: March 2017, Chen et al., 2002). The CALIPSO products are downloaded from https://www-calipso.larc.nasa.gov/tools/data_avail/dpo_read.php?y=2007&m=08&d=10 (last access: June 2017, Winker et al., 2004, 2007). ERA-Interim is downloaded from http://www.ecmwf.int/en/research/climate-reanalysis/era-interim (last access: March 2017, Dee et al., 2011). The NARR reanalysis is downloaded from https://www.esrl.noaa.gov/psd/data/gridded/data.narr.html (last access: March 2017, Mesinger et al., 2006).
The supplement related to this article is available online at: https://doi.org/10.5194/acp-18-4201-2018-supplement.
The authors declare that they have no conflict of interest.
IMPROVE is a collaborative association of state, tribal, and federal
agencies and international partners. The US Environmental Protection Agency is
the primary funding source, with contracting and research support from the
National Park Service. The Air Quality Group at the University of California,
Davis is the central analytical laboratory, with ion analysis provided by
Research Triangle Institute, and carbon analysis provided by Desert Research
Institute. This research is supported by NOAA and Princeton University's
Cooperative Institute for Climate Science and NASA under grant
NNH14ZDA001N-ACMAP. The authors thank Stuart Evans and Jordan Schnell
for their helpful comments on the early version of this paper. The insightful
comments from Patrick Chuang and the other reviewer helped improve
the paper and are sincerely appreciated.
Edited by: Patrick Chuang
Reviewed by: Patrick Chuang and one anonymous referee
Abudu, S., Cui, C. L., King, J. P., Moreno, J., and Bawazir, A. S.: Modeling of daily pan evaporation using partial least squares regression, Sci. China Technol. Sc., 54, 163–174, https://doi.org/10.1007/s11431-010-4205-z, 2011.
Alappattu, D. P. and Kunhikrishnan, P. K.: Premonsoon estimates of convective available potential energy over the oceanic region surrounding the Indian subcontinent, J. Geophys. Res.-Atmos., 114, https://doi.org/10.1029/2008jd011521, 2009.
Bozlaker, A., Prospero, J. M., Fraser, M. P., and Chellam, S.: Quantifying the Contribution of Long-Range Saharan Dust Transport on Particulate Matter Concentrations in Houston, Texas, Using Detailed Elemental Analysis, Environ. Sci. Technol., 47, 10179–10187, https://doi.org/10.1021/es4015663, 2013.
Chen, M. Y., Xie, P. P., Janowiak, J. E., and Arkin, P. A.: Global land precipitation: A 50-yr monthly analysis based on gauge observations, J. Hydrometeorol., 3, 249–266, https://doi.org/10.1175/1525-7541(2002)003<0249:Glpaym>2.0.Co;2, 2002.
Claverie, M., Vermote, E., and NOAA-CDR-Program: NOAA Climate Data Record (CDR) of Leaf Area Index (LAI) and Fraction of Absorbed Photosynthetically Active Radiation (FAPAR), Version 4, NOAA National Climatic Data Center, https://doi.org/10.7289/V5M043BX, 2014.
Claverie, M., Matthews, J. L., Vermote, E. F., and Justice, C. O.: A 30+ Year AVHRR LAI and FAPAR Climate Data Record: Algorithm Description and Validation, Remote Sens.-Basel, 8, 263, https://doi.org/10.3390/rs8030263, 2016.
Colby, F. P.: Convective Inhibition as a Predictor of Convection during Ave-Sesame-Ii, Mon. Weather Rev., 112, 2239–2252, https://doi.org/10.1175/1520-0493(1984)112<2239:Ciaapo>2.0.Co;2, 1984.
Cook, B. I., Ault, T. R., and Smerdon, J. E.: Unprecedented 21st century drought risk in the American Southwest and Central Plains, Science Advances, 1, 1–7, https://doi.org/10.1126/sciadv.1400082 2015.
Creamean, J. M., Spackman, J. R., Davis, S. M., and White, A. B.: Climatology of long-range transported Asian dust along the West Coast of the United States, J. Geophys. Res.-Atmos., 119, 12171–12185, https://doi.org/10.1002/2014jd021694, 2014.
Crooks, J. L., Cascio, W. E., Percy, M. S., Reyes, J., Neas, L. M., and Hilborn, E. D.: The Association between Dust Storms and Daily Non-Accidental Mortality in the United States, 1993–2005, Environ. Health Persp., 124, 1735–1743, https://doi.org/10.1289/Ehp216, 2016.
Cuesta, J., Marsham, J. H., Parker, D. J., and Flamant, C.: Dynamical mechanisms controlling the vertical redistribution of dust and the thermodynamic structure of the West Saharan atmospheric boundary layer during summer, Atmos. Sci. Lett., 10, 34–42, https://doi.org/10.1002/asl.207, 2009.
Dee, D. P., Uppala, S. M., Simmons, A. J., Berrisford, P., Poli, P., Kobayashi, S., Andrae, U., Balmaseda, M. A., Balsamo, G., Bauer, P., Bechtold, P., Beljaars, A. C. M., van de Berg, L., Bidlot, J., Bormann, N., Delsol, C., Dragani, R., Fuentes, M., Geer, A. J., Haimberger, L., Healy, S. B., Hersbach, H., Holm, E. V., Isaksen, L., Kallberg, P., Kohler, M., Matricardi, M., McNally, A. P., Monge-Sanz, B. M., Morcrette, J. J., Park, B. K., Peubey, C., de Rosnay, P., Tavolato, C., Thepaut, J. N., and Vitart, F.: The ERA-Interim reanalysis: configuration and performance of the data assimilation system, Q. J. Roy. Meteor. Soc., 137, 553–597, https://doi.org/10.1002/qj.828, 2011.
Delworth, T. L., Zeng, F. R., Rosati, A., Vecchi, G. A., and Wittenberg, A. T.: A Link between the Hiatus in Global Warming and North American Drought, J. Climate, 28, 3834–3845, https://doi.org/10.1175/Jcli-D-14-00616.1, 2015.
Fischer, E. V., Hsu, N. C., Jaffe, D. A., Jeong, M. J., and Gong, S. L.: A decade of dust: Asian dust and springtime aerosol load in the US Pacific Northwest, Geophys. Res. Lett., 36, L03821, https://doi.org/10.1029/2008gl036467, 2009.
Gettelman, A., Seidel, D. J., Wheeler, M. C., and Ross, R. J.: Multidecadal trends in tropical convective available potential energy, J. Geophys. Res.-Atmos., 107, 4606, https://doi.org/10.1029/2001jd001082, 2002.
Gillette, D. A. and Passi, R.: Modeling Dust Emission Caused by Wind Erosion, J. Geophys. Res.-Atmos., 93, 14233–14242, https://doi.org/10.1029/JD093iD11p14233, 1988.
Ginoux, P., Prospero, J. M., Gill, T. E., Hsu, N. C., and Zhao, M.: Global-Scale Attribution of Anthropogenic and Natural Dust Sources and Their Emission Rates Based on Modis Deep Blue Aerosol Products, Rev. Geophys., 50, RG3005, https://doi.org/10.1029/2012rg000388, 2012.
Hand, J. L., Copeland, S. A., Day, D. E., Dillner, A. M., Indresand, H., Malm, W. C., McDade, C. E., Moore, C. T., Pitchford, M. L., Schichtel, B. A., and Watson, J. G.: IMPROVE (Interagency Monitoring of Protected Visual Environments): Spatial and seasonal patterns and temporal variability of haze and its constituents in the United States, available at: http://vista.cira.colostate.edu/Improve/spatial-and-seasonal-patterns-and-temporal-variability-of-haze-and-its-constituents- in-the-united-states-report-v-june-2011/ (last access: March 2017), 2011.
Hand, J. L., Schichtel, B. A., Pitchford, M., Malm, W. C., and Frank, N. H.: Seasonal composition of remote and urban fine particulate matter in the United States, J. Geophys. Res.-Atmos., 117, D05209, https://doi.org/10.1029/2011jd017122, 2012.
Hand, J. L., White, W. H., Gebhart, K. A., Hyslop, N. P., Gill, T. E., and Schichtel, B. A.: Earlier onset of the spring fine dust season in the southwestern United States, Geophys. Res. Lett., 43, 4001–4009, https://doi.org/10.1002/2016gl068519, 2016.
Hand, J. L., Gill, T. E., and Schichtel, B. A.: Spatial and seasonal variability in fine mineral dust and coarse aerosol mass at remote sites across the United States, J. Geophys. Res.-Atmos., 122, 3080–3097, https://doi.org/10.1002/2016jd026290, 2017.
Helfand, H. M. and Schubert, S. D.: Climatology of the Simulated Great-Plains Low-Level Jet and Its Contribution to the Continental Moisture Budget of the United-States, J. Climate, 8, 784–806, https://doi.org/10.1175/1520-0442(1995)008<0784:Cotsgp>2.0.Co;2, 1995.
Hyslop, N. P., Trzepla, K., and White, W. H.: Assessing the Suitability of Historical PM2.5 Element Measurements for Trend Analysis, Environ. Sci. Technol., 49, 9247–9255, https://doi.org/10.1021/acs.est.5b01572, 2015.
Li, F. Y., Ginoux, P., and Ramaswamy, V.: Transport of Patagonian dust to Antarctica, J. Geophys. Res.-Atmos., 115, D18217, https://doi.org/10.1029/2009jd012356, 2010.
Li, L. F., Li, W. H., and Kushnir, Y.: Variation of the North Atlantic subtropical high western ridge and its implication to Southeastern US summer precipitation, Clim. Dynam., 39, 1401–1412, https://doi.org/10.1007/s00382-011-1214-y, 2012.
Li, W. H., Li, L. F., Ting, M. F., and Liu, Y. M.: Intensification of Northern Hemisphere subtropical highs in a warming climate, Nat. Geosci., 5, 830–834, https://doi.org/10.1038/Ngeo1590, 2012.
Liu, Y. M., Wu, G. X., and Ren, R. C.: Relationship between the subtropical anticyclone and diabatic heating, J. Climate, 17, 682–698, https://doi.org/10.1175/1520-0442(2004)017<0682:Rbtsaa>2.0.Co;2, 2004.
Malm, W. C., Sisler, J. F., Huffman, D., Eldred, R. A., and Cahill, T. A.: Spatial and Seasonal Trends in Particle Concentration and Optical Extinction in the United-States, J. Geophys. Res.-Atmos., 99, 1347–1370, https://doi.org/10.1029/93jd02916, 1994.
Marsham, J. H., Parker, D. J., Grams, C. M., Taylor, C. M., and Haywood, J. M.: Uplift of Saharan dust south of the intertropical discontinuity, J. Geophys. Res.-Atmos., 113, D21102, https://doi.org/10.1029/2008jd009844, 2008.
Marticorena, B. and Bergametti, G.: Modeling the Atmospheric Dust Cycle .1. Design of a Soil-Derived Dust Emission Scheme, J. Geophys. Res.-Atmos., 100, 16415–16430, https://doi.org/10.1029/95jd00690, 1995.
Mesinger, F., DiMego, G., Kalnay, E., Mitchell, K., Shafran, P. C., Ebisuzaki, W., Jovic, D., Woollen, J., Rogers, E., Berbery, E. H., Ek, M. B., Fan, Y., Grumbine, R., Higgins, W., Li, H., Lin, Y., Manikin, G., Parrish, D., and Shi, W.: North American regional reanalysis, B. Am. Meteorol. Soc., 87, 343–360, https://doi.org/10.1175/Bams-87-3-343, 2006.
Miyasaka, T. and Nakamura, H.: Structure and formation mechanisms of the northern hemisphere summertime subtropical highs, J. Climate, 18, 5046–5065, https://doi.org/10.1175/Jcli3599.1, 2005.
Morman, S. A. and Plumlee, G. S.: The role of airborne mineral dusts in human disease, Aeolian Res., 9, 203–212, https://doi.org/10.1016/j.aeolia.2012.12.001, 2013.
Myoung, B. and Nielsen-Gammon, J. W.: Sensitivity of Monthly Convective Precipitation to Environmental Conditions, J. Climate, 23, 166–188, https://doi.org/10.1175/2009jcli2792.1, 2010a.
Myoung, B. and Nielsen-Gammon, J. W.: The Convective Instability Pathway to Warm Season Drought in Texas. Part I: The Role of Convective Inhibition and Its Modulation by Soil Moisture, J. Climate, 23, 4461–4473, https://doi.org/10.1175/2010jcli2946.1, 2010b.
O'Brien, R. M.: A caution regarding rules of thumb for variance inflation factors, Qual. Quant., 41, 673–690, https://doi.org/10.1007/s11135-006-9018-6, 2007.
Perry, K. D., Cahill, T. A., Eldred, R. A., Dutcher, D. D., and Gill, T. E.: Long-range transport of North African dust to the eastern United States, J. Geophys. Res.-Atmos., 102, 11225–11238, https://doi.org/10.1029/97jd00260, 1997.
Prein, A. F., Holland, G. J., Rasmussen, R. M., Clark, M. P., and Tye, M. R.: Running dry: The US Southwest's drift into a drier climate state, Geophys. Res. Lett., 43, 1272–1279, https://doi.org/10.1002/2015gl066727, 2016.
Prospero, J. M.: Long-range transport of mineral dust in the global atmosphere: Impact of African dust on the environment of the southeastern United States, P. Natl. Acad. Sci. USA, 96, 3396–3403, https://doi.org/10.1073/pnas.96.7.3396, 1999a.
Prospero, J. M.: Long-term measurements of the transport of African mineral dust to the southeastern United States: Implications for regional air quality, J. Geophys. Res.-Atmos., 104, 15917–15927, https://doi.org/10.1029/1999jd900072, 1999b.
Prospero, J. M., Landing, W. M., and Schulz, M.: African dust deposition to Florida: Temporal and spatial variability and comparisons to models, J. Geophys. Res.-Atmos., 115, D13304, https://doi.org/10.1029/2009jd012773, 2010.
Prospero, J. M., Collard, F. X., Molinie, J., and Jeannot, A.: Characterizing the annual cycle of African dust transport to the Caribbean Basin and South America and its impact on the environment and air quality, Global Biogeochem. Cy., 28, 757–773, https://doi.org/10.1002/2013gb004802, 2014.
Pu, B. and Dickinson, R. E.: Diurnal Spatial Variability of Great Plains Summer Precipitation Related to the Dynamics of the Low-Level Jet, J. Atmos. Sci., 71, 1807–1817, https://doi.org/10.1175/Jas-D-13-0243.1, 2014.
Pu, B. and Ginoux, P.: Projection of American dustiness in the late 21st century due to climate change, Sci. Rep., 7, 5553, https://doi.org/10.1038/s41598-017-05431-9, 2017.
Pu, B., Dickinson, R. E., and Fu, R.: Dynamical connection between Great Plains low-level winds and variability of central Gulf States precipitation, J. Geophys. Res.-Atmos., 121, 3421–3434, https://doi.org/10.1002/2015jd024045, 2016a.
Pu, B., Fu, R., Dickinson, R. E., and Fernando, D. N.: Why do summer droughts in the Southern Great Plains occur in some La Nina years but not others?, J. Geophys. Res.-Atmos., 121, 1120–1137, https://doi.org/10.1002/2015jd023508, 2016b.
Riemann-Campe, K., Fraedrich, K., and Lunkeit, F.: Global climatology of Convective Available Potential Energy (CAPE) and Convective Inhibition (CIN) in ERA-40 reanalysis, Atmos. Res., 93, 534–545, https://doi.org/10.1016/j.atmosres.2008.09.037, 2009.
Ruane, A. C.: NARR's Atmospheric Water Cycle Components. Part I: 20-Year Mean and Annual Interactions, J. Hydrometeorol., 11, 1205–1219, https://doi.org/10.1175/2010jhm1193.1, 2010a.
Ruane, A. C.: NARR's Atmospheric Water Cycle Components. Part II: Summertime Mean and Diurnal Interactions, J. Hydrometeorol., 11, 1220–1233, https://doi.org/10.1175/2010jhm1279.1, 2010b.
Ruiz-Barradas, A. and Nigam, S.: Great plains hydroclimate variability: The view from North American regional reanalysis, J. Climate, 19, 3004–3010, https://doi.org/10.1175/Jcli3768.1, 2006.
Sassen, K.: The Polarization Lidar Technique for Cloud Research – a Review and Current Assessment, B. Am. Meteorol. Soc., 72, 1848–1866, https://doi.org/10.1175/1520-0477(1991)072<1848:Tpltfc>2.0.Co;2, 1991.
Seager, R., Ting, M. F., Held, I., Kushnir, Y., Lu, J., Vecchi, G., Huang, H. P., Harnik, N., Leetmaa, A., Lau, N. C., Li, C. H., Velez, J., and Naik, N.: Model projections of an imminent transition to a more arid climate in southwestern North America, Science, 316, 1181–1184, https://doi.org/10.1126/science.1139601, 2007.
Sorooshian, A., Wonaschutz, A., Jarjour, E. G., Hashimoto, B. I., Schichtel, B. A., and Betterton, E. A.: An aerosol climatology for a rapidly growing arid region (southern Arizona): Major aerosol species and remotely sensed aerosol properties, J. Geophys. Res.-Atmos., 116, D19205, https://doi.org/10.1029/2011jd016197, 2011.
Tong, D. Q., Wang, J. X. L., Gill, T. E., Lei, H., and Wang, B. Y.: Intensified dust storm activity and Valley fever infection in the southwestern United States, Geophys. Res. Lett., 44, 4304–4312, https://doi.org/10.1002/2017gl073524, 2017.
Weaver, S. J. and Nigam, S.: Variability of the great plains low-level jet: Large-scale circulation context and hydroclimate impacts, J. Climate, 21, 1532–1551, https://doi.org/10.1175/2007jcli1586.1, 2008.
Winker, D. M., Hunt, W., and Hostetler, C.: Status and performance of the CALIOP lidar, Bba Lib., 5575, 8–15, https://doi.org/10.1117/12.571955, 2004.
Winker, D. M., Hunt, W. H., and McGill, M. J.: Initial performance assessment of CALIOP, Geophys. Res. Lett., 34, L19803, https://doi.org/10.1029/2007gl030135, 2007.
Wu, G. X. and Liu, Y. M.: Summertime quadruplet heating pattern in the subtropics and the associated atmospheric circulation, Geophys. Res. Lett., 30, 1201, https://doi.org/10.1029/2002gl016209, 2003.
Ye, B., Del Genio, A. D., and Lo, K. K. W.: CAPE variations in the current climate and in a climate change, J. Climate, 11, 1997–2015, https://doi.org/10.1175/1520-0442-11.8.1997, 1998.
Yu, H. B., Remer, L. A., Chin, M., Bian, H. S., Tan, Q., Yuan, T. L., and Zhang, Y.: Aerosols from Overseas Rival Domestic Emissions over North America, Science, 337, 566–569, https://doi.org/10.1126/science.1217576, 2012.
Zender, C. S., Bian, H. S., and Newman, D.: Mineral Dust Entrainment and Deposition (DEAD) model: Description and 1990s dust climatology, J. Geophys. Res.-Atmos., 108, 4416, https://doi.org/10.1029/2002jd002775, 2003.
Zhang, L., Henze, D. K., Grell, G. A., Torres, O., Jethva, H., and Lamsal, L. N.: What factors control the trend of increasing AAOD over the United States in the last decade?, J. Geophys. Res.-Atmos, 122, 1797–1810, https://doi.org/10.1002/2016JD025472, 2017.


