the Creative Commons Attribution 4.0 License.
the Creative Commons Attribution 4.0 License.
Optical and microphysical properties of natural mineral dust and anthropogenic soil dust near dust source regions over northwestern China
Jinsen Shi
Jianrong Bi
Zhongwei Huang
Beidou Zhang
Tian Zhou
Kaiqi Fu
Quanliang Chen
Jinyuan Xin
Mineral dust aerosols (MDs) not only influence the climate by scattering and absorbing solar radiation but also modify cloud properties and change the ecosystem. From 3 April to 16 May 2014, a ground-based mobile laboratory was deployed to measure the optical and microphysical properties of MDs near dust source regions in Wuwei, Zhangye, and Dunhuang (in chronological order) along the Hexi Corridor over northwestern China. Throughout this dust campaign, the hourly averaged (±standard deviation) aerosol scattering coefficients (σsp, 550 nm) of the particulates with aerodynamic diameters less than 2.5 µm (PM2.5) at these three sites were sequentially 101.5 ± 36.8, 182.2 ± 433.1, and 54.0 ± 32.0 Mm−1. Correspondingly, the absorption coefficients (σap, 637 nm) were 9.7 ± 6.1, 6.0 ± 4.6, and 2.3 ± 0.9 Mm−1; single-scattering albedos (ω, 637 nm) were 0.902 ± 0.025, 0.931 ± 0.037, and 0.949 ± 0.020; and scattering Ångström exponents (Åsp, 450–700 nm) of PM2.5 were 1.28 ± 0.27, 0.77 ± 0.51, and 0.52 ± 0.31. During a severe dust storm in Zhangye (i.e., from 23 to 25 April), the highest values of (∼ 5074 Mm−1), backscattering coefficient (, ∼ 522 Mm−1), and ω637 (∼ 0.993) and the lowest values of backscattering fraction (b2.5, ∼ 0.101) at 550 nm and (∼ −0.046) at 450–700 nm, with peak values of aerosol number size distribution (appearing at the particle diameter range of 1–3 µm), exhibited that the atmospheric aerosols were dominated by coarse-mode dust aerosols. It is hypothesized that the relatively higher values of mass scattering efficiency during floating dust episodes in Wuwei and Zhangye are attributed to the anthropogenic soil dust produced by agricultural cultivations.
- Article
(12171 KB) - Full-text XML
-
Supplement
(745 KB) - BibTeX
- EndNote
The role of mineral dust aerosols (MDs) in the climate system has received considerable attention over recent years (Arimoto et al., 2006; Ramanathan et al., 2001; Li and Min, 2010). MD has a profound impact on the radiative balance of the Earth by scattering and absorbing solar radiation (Huang et al., 2010, 2014; Wang et al., 2010; Li et al., 2016; Liu et al., 2016; Yang et al., 2016a); it can also act as cloud condensation nuclei to alter the precipitation rate and hydrological cycle of the Earth (Rosenfeld et al., 2001; Zhao and Garrett, 2015; Li et al., 2017). East Asia includes the Taklimakan, Tengger, Badain Jaran, and Gobi deserts and is thus considered to be one of the major source regions of natural dust in the world, as it produces large amounts of natural mineral dust (Zhang et al., 1997; Wang et al., 2008; Che et al., 2011, 2013; Ge et al., 2014; Xin, 2005, 2010, 2015). The long-range transport of MDs from dust source regions has a significant influence on aerosol radiative forcing and changing environment (Chen et al., 2013; Ge et al., 2011; Liu et al., 2015; Huang et al., 2008). In order to fully account for the climate effects of MDs over eastern Asian regions, several international intensive field campaigns were conducted to measure their optical, physical, and chemical properties in recent decades, for example, the Asian Aerosol Characterization Experiment (ACE-Asia) (Arimoto et al., 2006), the NASA Global Tropospheric Experiment Transport and Chemical Evolution over the Pacific (TRACE-P) (Jacob et al., 2003), the Atmospheric Brown Clouds–East Asia Regional Experiment (ABC-EAREX) (Nakajima et al., 2003), and the 2008 China–US joint dust field experiment (Ge et al., 2010; Li et al., 2010; Wang et al., 2010). For instance, Ge et al. (2010) illustrated that the mean single-scattering albedo (SSA) measured at Zhangye increases with wavelength from 0.76 ± 0.02 at 415 nm to 0.86 ± 0.01 at 870 nm. Seasonal variations in the scattering coefficients and the absorption coefficients were also collected at Dunhuang and Zhangye of Gansu Province as well as Yulin of Shanxi Province (Li et al., 2010; Xu et al., 2004; Yan et al., 2007). However, the systematic review of the optical and microphysical properties of MDs in eastern Asia is still a challenge due to limited observations, especially for fine-mode mineral dust near the dust source areas in northwestern China.
Recently, the potential impacts of anthropogenic soil dust have also received an increasing amount of attention (Prospero et al., 2002; Tegen and Fung, 1995; Tegen et al., 2002; Huang et al., 2015a; Shi et al., 2015; Pu et al., 2015; Wang et al., 2015a). Anthropogenic mineral dust can also influence air quality and human health through the processes of their emission, transport, removal, and deposition (Aleksandropoulou et al., 2011; Chen et al., 2013; Huang et al., 2014, 2015a, b; Kim et al., 2009; Li et al., 2009; Mahowald and Luo, 2003; Zhang et al., 2005, 2015). Ginoux et al. (2010) estimated that anthropogenic dust accounts for 25 % of all dust aerosols using observational data from satellite products combined with a land-use fraction dataset. Nie et al. (2014) found observational evidence on new particle formation and growth in heavy dust plumes mixed with anthropogenic pollution via dust-induced heterogeneous photochemical processes. Because anthropogenic dust emissions from disturbed soils are not well constrained, we define anthropogenic dust as mineral dust from areas that have been disrupted by human activities, such as deforestation, overgrazing, and agricultural and industrial activities (Aleksandropoulou et al., 2011; Tao et al., 2014, 2015, 2017; Tegen and Fung, 1995; Tegen et al., 2002, 2004; Thompson et al., 1988); anthropogenic dust is thus different from natural mineral dust, which originates from desert regions (Che et al., 2011, 2013; Goudie and Middleton, 2001; Li et al., 2012; Park and Park, 2014; Pu et al., 2015; Wang et al., 2008, 2010). This assumption is consistent with the results of a recent study by Huang et al. (2015a), who found that anthropogenic dust comprises 91.8 % of regional emissions in eastern China and 76.1 % of regional emissions in India.
Understanding that the natural dust mixed with the anthropogenic aerosols in the troposphere has a critical impact on our ability to gain insight into atmospheric compositions and predict global climate change (Nie et al., 2014; Ramanathan et al., 2007; Spracklen and Rap, 2013; Wang et al., 2015b). Although several attempts have been conducted to investigate the significance of the effects of dust on global climate, meteorology, atmospheric dynamics, ecosystems, and human health (Rosenfeld et al., 2011; Qian et al., 2004; Yang et al., 2016b), only limited field campaigns have focused on the properties of the anthropogenic dust aerosols near dust source regions. In this study, we not only focus on the surface measurements of the optical and microphysical properties of anthropogenic dust but also use statistical analysis to identify the possible signatures of natural dust storms transported from dust source regions over northwestern China.
2.1 Site description
The Hexi Corridor is a ∼ 1000 km northwest–southeast-oriented chain of oases in northwestern China (mainly in the Gansu Province), surrounded by the Qilian Mountains (elevation: ∼ 4000 m), the Bei Shan (elevation: ∼ 2500 m), Heli Shan (elevation: ∼ 2000 m) and the Wushaoling Mountains (elevation: ∼ 3000 m). The Hexi Corridor is considered to be a relatively polluted area because of the combination of local topography and the human activities occurring over northwestern China (Zhang et al., 2009; Li et al., 2010; Wang et al., 2010; Bi et al., 2017).
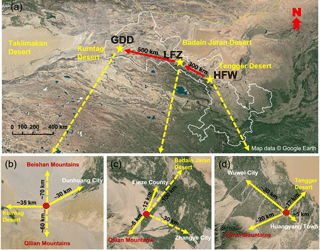
Figure 1(a) The sampling locations of the ground-based mobile laboratory and their surrounding areas near dust source regions during the 2014 dust field campaigns at (b) the Gobi Desert in Dunhuang (GDD, 39.96∘ N, 94.33∘ E; 1367 m a.s.l.), (c) Linze farmland in Zhangye (LFZ, 39.04∘ N, 100.12∘ E; 1578 m a.s.l.), and (d) Huangyang farmland in Wuwei (HFW, 37.72∘ N, 102.89∘ E; 1691 m a.s.l.).
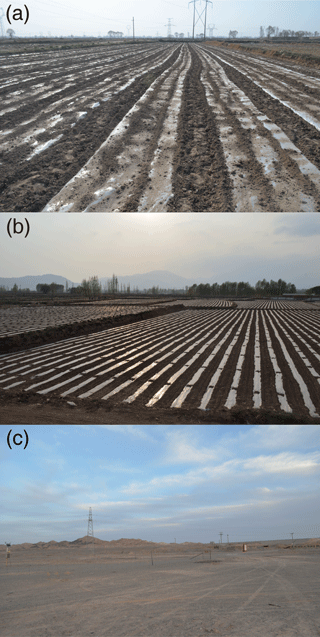
Figure 2Same as Fig. 1 but for land surface conditions at (a) Huangyang farmland in Wuwei (HFW), (b) Linze farmland in Zhangye (LFZ), and (c) the Gobi Desert in Dunhuang (GDD).
The comprehensive dust field campaign was carried out along the Hexi Corridor from 3 April to 16 May 2014. A ground-based mobile facility of the Semi-Arid Climate and Environment Observatory of Lanzhou University (SACOL) was used at three sites, which were Wuwei (37.72∘ N, 102.89∘ E; 1691 m a.s.l.; 3–7 April), Zhangye (39.04∘ N, 100.12∘ E; 1578 m a.s.l.; 9–28 April), and Dunhuang (39.96∘ N, 94.33∘ E; 1367 m a.s.l.; 3–16 May). The locations of these sites are shown in Fig. 1a. As presented in Fig. 1b, c, and d, the Huangyang farmland in Wuwei (HFW in figures and tables) is located only ∼ 17 km west of the Tengger Desert and ∼ 20 km away from the Qilian Mountains. Moreover, anthropogenic air pollutants originating from Wuwei City (about 30 km northwest of the site) can directly influence the sampling site because of the prevailing wind direction along the local topography. The Linze farmland in Zhangye (LFZ in tables and figures) is located in northwestern Zhangye City (∼ 30 km), to the southwest of Linze County (∼ 12 km), encompassed by the Qilian Mountains and the Badain Jaran Desert. The nearest main roadway, national highway 312, is approximately 200 m southwest of the site. As shown in Fig. 2a and b, the sites in Wuwei and Zhangye are mainly agricultural fields with similar land surface type, with corn and cotton being the major crops. In general, agricultural and preparation activities, such as disking, tillage, and seeding operations, are carried out in April and early May; thus, the local tropospheric aerosols in Wuwei and Zhangye were potentially influenced by the anthropogenic soil dust due to agricultural cultivation activities. However, the sampling site in Dunhuang is located in the Gobi Desert (GDD in tables and figures), ∼ 35 km away from the eastern edge of the Kumtag Desert and in the upwind direction of Dunhuang City, and national highway 215 is about 2 km west of the site. There were not any significant anthropogenic pollution sources around the mobile facility during the sampling period in Dunhuang, and the primary components were presumably dominated by natural mineral dust (Fig. 2c).
2.2 Instrumentation
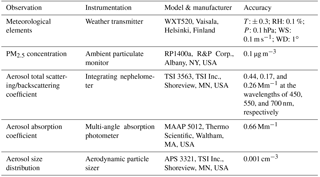
During the 2014 dust field campaign, ambient temperature (T), relative humidity (RH), pressure (P), wind direction (WD), and wind speed (WS) were automatically measured with a weather transmitter (model WXT520, Vaisala Inc., Helsinki, Finland) at 1 min intervals. The aerosol optical and microphysical properties measured at these three sites consist of absorption coefficients (σap), total scattering coefficients (σsp) and backscattering coefficients (σbsp), mass concentrations, and aerosol number size distribution. The wind direction datasets were associated with the aerosol absorption and scattering coefficients and can be used to determine the origins of natural and anthropogenic dust. Figure 3a shows the ground-based mobile laboratory of SACOL deployed in Dunhuang. The measurements were conducted in the laboratory, where temperature was maintained at 20 ∘C. To minimize local contaminations, a metal sampling stack (10 cm in diameter) was installed at the top of the ground-based mobile laboratory (∼ 6.5 m above the ground level). The airflow was split into several flows and supplied to different instruments, and the particle size cut measurements were obtained using 1 and 2.5 µm impactors, which are shown in Fig. 3b. All of the collectors were operated at 50 ∘C to dry the aerosols (i.e., to a RH of less than 40 %). For proper operation under the flow conditions in the present experiments, the internal plumbing of the commercial unit has to be modified once a week. Details of the most relevant instrument's accuracy for aerosol and dust measurements are given in Table 1. Finally, all datasets measured were adjusted to standard temperature and pressure conditions (STP; T=273.15 K, P=101.325 kPa), in which 5 min and hourly averaged data were used.
The mass concentration with the particle diameter (Dp) less than 2.5 µm (PM2.5) was measured continuously using an ambient particulate monitor (model RP1400a, R&P Corp., Albany, NY, USA) with a flow rate of 16.7 L min−1, which is based on the principle of tapered element oscillating microbalance (TEOM) (Patashnick and Rupprecht, 1991). We checked the main and auxiliary flow rates of the TEOM monitor at least once a week, and the Teflon-coated glass fiber filters must be exchanged before the filter loading percentage reaches 60 % to ensure the validity of the data generated by the TEOM.
Two integrating nephelometers (model 3563, TSI Inc., Shoreview, MN, USA) with 1 and 2.5 µm impactors were also employed to measure the total scattering and backscattering coefficients of aerosol particles at three wavelengths of 450, 550, and 700 nm; the detection limits of three wavelengths are 0.44, 0.17, and 0.26 Mm−1 (1 Mm m−1), respectively. The nephelometer has a signal-to-noise ratio (S:N) of 2:1 (Anderson et al., 1996; Shi et al., 2013). The two nephelometers were checked with internally filtered particle-free air once a day and standard CO2 every 2 days. CO2 calibrations were performed before the experiment or when the CO2 check error was greater than 5 % (Anderson et al., 1996; Anderson and Ogren, 1998). Multiple calibrations following the manufacturer's protocol were performed, and the instrument noise was periodically measured throughout this dust field campaign using an inline high-efficiency particulate air (HEPA) filter. The datasets collected by nephelometers were corrected for angular nonidealities, which will cause particle scattering in the near-forward direction to be underestimated. For reducing and quantifying the uncertainties in aerosol optical properties measured by the nephelometers, the data reduction and uncertainty analysis for the scattering datasets due to nonideal detection are processed following Anderson and Ogren (1998). Combining these errors could yield a total uncertainty of ±8 % for a scattering coefficient at 550 nm.
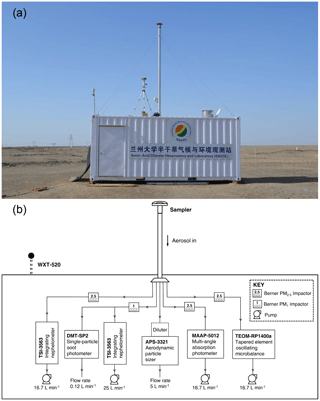
Figure 3(a) The ground-based mobile laboratory in Dunhuang and (b) the schematic diagram of the ensemble instrumentation system.
A multi-angle absorption photometer (MAAP, model 5012, Thermo Scientific, Waltham, MA, USA) was used to determine the aerosol absorption coefficients of PM2.5 at a wavelength of 637 nm (Müller et al., 2011) with a temporal resolution of 1 min and a flow rate of 16.7 L min−1. The overall uncertainty in the absorbance determined has been estimated to be ±12 % (Petzold and Schönlinner, 2004). The detailed description of the MAAP measurements and calibration can be found in the literature (Petzold et al., 2002; Petzold and Schönlinner, 2004).
The particle size distribution ranging from 0.5 to 20 µm (52 channels) was measured using an aerodynamical particle sizer (APS) spectrometer (model 3321, TSI Inc., Shoreview, MN, USA), assuming that all aerosols are homogeneous with spherical particles, despite the fact that the observed coarse-mode dust particles exhibit nonspherical geometries (Mishchenko et al., 1995). The instrument was just calibrated by TSI Inc. before the experiment. Because of the high aerosol concentrations (i.e., exceeds 1000 cm−3) when the extreme dust storm break out, two diluters (model 3302A, TSI Inc., Shoreview, MN, USA) with dilution ratio of 20:1 and 100:1 were used on top of the APS, and the data have taken account of the dilution ratios and particle loss due to the dilutors.
Although the single-particle soot photometer (SP2, DMT Inc., Boulder, CO, USA) was also used to measure the mass concentration and size distribution of black carbon (BC) in Zhangye from 9 to 28 April 2014, the datasets are used to analyze the mixing status of BC with the other aerosols during this dust field campaign in another paper (Wu et al., 2018). A comparison of the BC mass concentration between the SP2 and MAAP instruments is given in Fig. S1 in the Supplement. The result indicated that the tendency of BC mass concentrations was very similar, but the values measured with the MAAP were relatively larger than those measured with the SP2. We note that the relatively large bias between the MAAP and SP2 instruments may result from the size distribution of BC measured by using different sampler inlet impactors of 2.5 and 1 µm, respectively.
2.3 Data analysis methods
The mass absorption coefficient (MAC) is a key parameter that can be used to attribute the light absorption of aerosols to BC and to understand its effects on climate. Some studies have attempted to perform this attribution based on the assumption of the wavelength dependence of absorption (e.g., Favez et al., 2009; Yang et al., 2009). These values are calculated by assuming that the imaginary part of the complex refractive index of BC is independent of the wavelength (λ) and that the absorption cross section of BC varies as a function of λ−1 (Bond and Bergstrom, 2006). A narrow range of BC for MAC (6.4–6.6 m2 g−1) was found to provide a good fit to urban particles collected by previous studies (Arnott et al., 2003; Bond and Bergstrom, 2006; Schwarz et al., 2008), and a value of 6.6 m2 g−1 is currently used in the MAAP. To calculate the aerosol absorption coefficient at 637 nm, the following equation is used:
where mBC is the equivalent mass concentration of BC reported by the MAAP.
The backscattering fraction (b) is defined as the ratio of aerosol scattering in the backward hemisphere to the total scattering (, which is related to particle size distribution. The wavelength-dependent variation in σsp is characterized by the scattering Ångström exponent (Åsp), which is calculated as
where and are the aerosol scattering coefficients at wavelengths λ1 and λ2, respectively. In this paper, we calculated Åsp from 450 to 700 nm (i.e., using the scattering coefficients measured with the nephelometer at 450 and 700 nm).
The aerosol SSA is a key parameter that can be used to investigate the optical and microphysical properties of atmospheric aerosols (Haywood and Shine, 1995), which is defined as the ratio of the scattering coefficient to the total extinction coefficient (i.e., the sum of the scattering and absorption coefficients). To calculate the SSA at 637 nm, we first interpolate the σsp values to 637 nm using the Ångström law:
The SSA at 637 nm (ω637) is then calculated using Eq. (4):
Mass scattering efficiency (MSE) is calculated as the slope of the reduced major axis linear regression of and PM2.5:
where is the aerosol scattering coefficient at 550 nm and PM2.5 is the mass concentration measured with the TEOM.
In order to estimate the uncertainties of optical properties on our dust aerosol measurements during this dust field campaign, we performed a closure study to compare the measured with the nephelometer associated with that calculated based on the particle number size distribution measurements using a modified Mie model. Computer programs based on the Mie theory (Mie, 1908) to calculate scattering of particles are freely available (e.g., BHCOAT model; Bohren and Huffman, 1983), and we made use of an implementation of these algorithms in MATLAB (Mathworks, MA, USA) (Mätzler, 2002). Mie scattering calculations of a single spherical particle require the aerosol number size distribution, the aerosol complex refractive index (, and the size parameter ( as key input parameters. The scattering coefficients are calculated from the integration of the scattering efficiency (Qsp) over the whole number size distribution:
where Dp is the particle diameter, and N(logDp) represents number size distribution measured with the APS. In this study, the real part of the refractive index (n) was assumed to be 1.53, which is widely used for mineral dust in literatures (Müller et al., 2009; McConnell et al., 2010); the imaginary part of the refractive index (k) was determined using Mie calculations.
3.1 Temporal variability
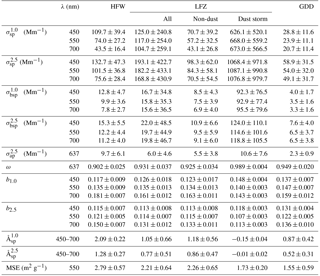
Floating dust is generally defined as a weather phenomenon in which fine-mode dust particles are suspended in the lower troposphere under calm or low-wind conditions, with horizontal visibility less than 10 km, while a dust storm is when large quantities of dust particles are lofted by strong winds, and horizontal visibility is reduced to below 1 km (Wang et al., 2005, 2008). During this dust field campaign, three floating dust episodes (which are shown as dotted boxes in Fig. 4) occurred on 3–7 April in Wuwei and on 9–12 and 25–28 April in Zhangye. We also observed the optical and microphysical properties of natural mineral dust during a heavy dust storm (shown as a solid box in Fig. 4) from 23 to 25 April in Zhangye. Moreover, we identified five clear-sky days in Zhangye (16, 18, 19, 20, and 22 April) and three clear-sky days in Dunhuang (11, 14, and 15 May) as background weather conditions based on the manual weather record and the abovementioned measurements. According to the land surface types shown in Fig. 2, one of the major novelties of this study is to investigate the characteristics of anthropogenic and natural dust during floating dust and dust storm episodes, respectively. Figure 4 illustrates the temporal variations in hourly averaged σsp, σbsp, σap, b, ω, and Åsp; MSE; and aerosol size distribution in Wuwei, Zhangye, and Dunhuang in chronological order from 3 April to 16 May 2014. Note that the time periods denoted in Fig. 4 contain some gaps due to transportation of the ground-based mobile facility and instrument failure. The statistical analyses of the optical parameters are also summarized in Table 2. Hereinafter, these results are given as the mean ± the standard deviation of the hourly averaged datasets. Unless otherwise noted, the data collected during the strong dust storm in Zhangye are excluded, and all the aerosol-scattering-related parameters discussed here are for the wavelength of 550 nm.
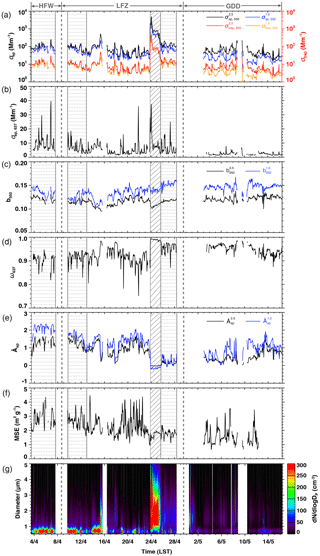
Figure 4Temporal variations in hourly averaged (a) aerosol scattering and backscattering coefficient at 550 nm; (b) absorption coefficient at 637 nm; (c) the backscattering fraction at 550 nm; (d) single-scattering albedo at 637 nm; (e) scattering Ångström exponent (calculated from 450 to 700 nm); (f) mass scattering efficiency (MSE) of PM2.5 at 550 nm; and (g) aerosol size distribution (dN/dlogDp, 0.5 µm < Dp < 5 µm) during the entire period from 3 April to 16 May 2014. The shaded box represents a strong dust storm that occurred in Zhangye, and the dotted boxes represent three floating dust episodes that occurred in Wuwei and Zhangye.
Aerosol optical and microphysical properties were entirely different at these three sites. One of the most significant features in Fig. 4a is that the variations in were highly consistent with those in during the whole period of the field campaign; the backscattering coefficients showed the same trends with the total scattering coefficients but at a relatively small magnitude. The values of and were very close in Wuwei and Zhangye; however, large differences were observed in Dunhuang. This result indicated that fine-mode particles (typically Dp< ∼1 µm) dominate the scattering coefficient in farmland regions, whereas coarse-mode particles (typically Dp> ∼1 µm) play a more important role in the desert regions. Except for the values obtained during the heavy dust storm, the hourly averaged values were 101 ± 37 and 84 ± 58 Mm−1 at two anthropogenically influenced sites in Wuwei and Zhangye, respectively; the corresponding values were 12.2 ± 4.4 and 9.5 ± 5.9 Mm−1. By contrast, the much lower (54.0 ± 32.0 Mm−1) and (6.5 ± 3.7 Mm−1) values were measured in Dunhuang. The values of b2.5 were 0.121 ± 0.005, 0.115 ± 0.007, and 0.122 ± 0.005 in Wuwei, Zhangye, and Dunhuang, respectively, which were consistent with the result in Backgarden (0.124 ± 0.015; Garland et al., 2008), a rural site near the megacity Guangzhou in southeastern China, but higher than those observed in Shouxian in eastern China (0.101 ± 0.017; Fan et al., 2010).
Meanwhile, large standard deviations in were found in Wuwei and Zhangye, which were possibly attributed to frequent floating dust events and local anthropogenic emissions (Wang et al., 2008, 2015a). The lowest value of during the field campaign was obtained in Dunhuang (2.3 ± 0.9 Mm−1), which can be compared with the relative higher σap of 9.7 ± 6.0 and 5.5 ± 3.8 Mm−1 in Wuwei and Zhangye, respectively. This observation most likely revealed that natural mineral dust is still a weaker absorber than anthropogenic soil dust that has been mixed with local air pollutants. Compared with Fig. 4b, Fig. 4d shows that the majority of ω637 values were much higher in Dunhuang than those at the other two sites, where these values ranged between ∼ 0.874 and 0.986, with a mean value of 0.949 ± 0.020. Similar results were also found in other field campaigns in Zhangye (ω550 of 0.95 ± 0.02; Li et al., 2010) and Yulin (ω530 of 0.95 ± 0.05; Xu et al., 2004). By contrast, only 0.7 and 21.9 % of the values reached up to 0.95 in Wuwei and Zhangye (as shown in Fig. 7), and their average values were much lower (0.902 ± 0.025 and 0.925 ± 0.034, respectively) and also exhibited large variations. This phenomenon indicated that light absorption and scattering aerosols remained at a low level in Dunhuang. The average MSE values in Wuwei, Zhangye, and Dunhuang were 2.79 ± 0.57, 2.21 ± 0.64, and 1.55 ± 0.59 m2 g−1, with maximum values of 4.37, 4.49, and 3.57 m2 g−1, respectively. The higher MSE values in Wuwei and Zhangye reflect the fact that anthropogenic dust, which was influenced by local soil dust during floating dust episodes, scatters more solar radiation than natural dust (Fig. 4f).
Aerosol size distribution (hereinafter defined as dN ∕ dlogDp) in the range of 0.5–5 µm is also presented in Fig. 4g, which indicated that fine-mode particles were dominant in Wuwei and Zhangye. Conversely, a relatively low level of number concentration (calculated from the integral of the size distribution curve) was maintained in Dunhuang, where an hourly averaged number concentration of 7.2 and 9.0 cm−3 for fine-mode and coarse-mode particles, respectively, was found with an average percentage of coarse-mode particles relative to total atmospheric particles of ∼ 55 %, which was higher than the relative percentages observed in Wuwei (∼ 16 %) and Zhangye (∼ 33 %).
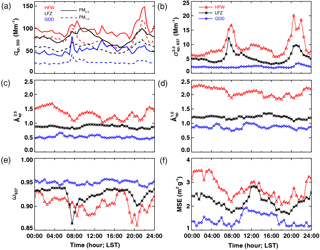
Figure 5Diurnal variations in (a) aerosol scattering coefficient at 550 nm, where solid lines represent the variations in PM2.5 and dotted lines represent the variations in PM1.0; (b) the aerosol absorption coefficient at 637 nm and the scattering Ångström exponent for (c) PM2.5 and (d) PM1.0 (both calculated from 450 to 700 nm); (e) single-scattering albedo at 637 nm; and (f) mass scattering efficiency at 550 nm in Wuwei (red lines), Zhangye (black lines), and Dunhuang (blue lines) from 3 April to 16 May 2014. Note that data collected during the strong dust storm in Zhangye are excluded.
On 23–25 April 2014, a severe dust storm along with a strong northerly wind occurred in Zhangye. The hourly averaged value increased remarkably from ∼ 186 to 5074 Mm−1, which was about 10 times higher than that measured in non-dust plume periods in Zhangye (∼ 509 Mm−1), while the maximum of was ∼ 37.6 Mm−1 during this dust storm, which was slightly higher than that measured during non-dust plume periods (∼ 36.0 Mm−1). Figure 4d and e delineate that the peaks of ω637 (0.989 ± 0.004, maximal value > 0.99) associated with the negative values of Åsp (−0.01 ± 0.02, minimal value < −0.04) were close to those observed in another field campaign over northwestern China (Li et al., 2010), which is possibly related to the reduction of anthropogenic emissions and the prevalence of coarse-mode particles (Cermak et al., 2010). Figure 4g demonstrates that the values of aerosol number size distribution peaked at 1–3 µm during the dust storm. Simultaneously, the number concentration of coarse-mode particles generally exceeded 300 cm−3 and even approached 1200 cm−3, which revealed that pure coarse-mode particles from desert regions were dominant. These results were consistent with those of a previous study, in which the aerosol diameter of PM10 was determined to be larger during dust plume periods than it was during non-dust plume periods (Wang et al., 2010).
3.2 Diurnal variations
Here, we also present the diurnal cycles of , , , and ω637, as well as those of Åsp and MSE values in Wuwei (red lines), Zhangye (black lines), and Dunhuang (blue lines) throughout the experiment (Fig. 5). As shown in Fig. 5a and b, the values of , , and presented prominent bimodal distributions in Wuwei and Zhangye. The maximal (∼ 16.8 Mm−1) appeared at 08:00 LST (local standard time) in Wuwei, with two secondary peak values occurring at 21:00 LST (∼ 20.2 Mm−1) and 22:00 LST (∼ 18.7 Mm−1). Similarly, two comparable peaks of appeared at 08:00 LST (∼ 12.2 Mm−1) and 20:30 LST (∼ 9.7 Mm−1) in Zhangye. These results indicated that not only anthropogenic mineral dust but also local air pollutants (e.g., BC and OC) were found in Wuwei and Zhangye; these pollutants likely originated from agricultural activities, biomass burning, and the burning of fossil fuels (e.g., domestic coal combustion, diesel emissions from vehicles). The pronounced diurnal variations at these sites may also be associated with the local meteorological elements (Arya, 1999). The ω637 values also displayed distinct differences between day and night in Wuwei and Zhangye (Fig. 5e), and the lower values occurred at 08:30 LST (∼ 0.881) and ∼ 19:30–20:30 LST (∼ 0.860–0.884) in Wuwei and at 07:30 LST (∼ 0.864) and 20:30 LST (∼ 0.902) in Zhangye, which were consistent with the diurnal features. However, the higher ω637 values (∼ 0.940–0.957) with only slight diurnal variations in Dunhuang indicated that natural dust aerosols were dominant near the dust source areas. Additionally, there were large diurnal variations in and in Wuwei, which were in the range of ∼ 1.0–1.7 and ∼ 1.8–2.3, respectively; these values observed in Dunhuang were in the range of ∼ 0.4–0.6 and ∼ 0.7–1.0, respectively, which could partly support the conclusion that its atmospheric aerosols were dominated by coarse-mode particles (Fig. 5c–d). Large diurnal variations in MSE were also found at all three sites; MSE values were the lowest in Dunhuang because of the amount of natural mineral dust near the source areas (Fig. 5f).
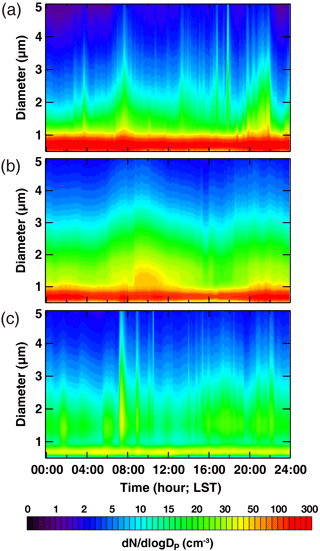
Figure 6Same as Fig. 5 but for aerosol size distribution (dN ∕ dlogDp, 0.5 µm < Dp < 5 µm) in (a) Wuwei, (b) Zhangye, and (c) Dunhuang from 3 April to 16 May 2014. Note that data collected during the strong dust storm in Zhangye are excluded.
As presented in Fig. 6a, the accumulated fine-mode particles increased in Wuwei yielded a maximum number distribution concentration of more than 100 cm−3 due to the frequent outbreaks of floating dust episodes that occurred on 3–7 April 2014. The similar pattern of fine-mode particles was found in Zhangye but with a slightly lower number distribution of fine-mode particles (Fig. 6b). We suggest that the fine-mode particles represented the dominant contributions in Wuwei and Zhangye, which was due to the formation of local anthropogenic soil dust by agricultural cultivations.
Figure 7 shows the histograms of the SSA values at these three sites. During the floating dust period in Wuwei, the majority of the ω637 values of fine-mode particles that originated from anthropogenic soil dust ranged between 0.900 and 0.925; approximately 20 % of those values were within the range of 0.875–0.900 and 0.925–0.950. The overall range of ω637 values observed in Zhangye was similar to that observed in Wuwei, but the values that ranged between 0.900 and 0.925 in Wuwei were 30 % higher than those in Zhangye. This result was consistent with that of Li et al. (2010), who noted that the SSA of a dust storm was approximately 0.98 for coarse-mode particles, while lower SSA values (i.e., ranged between 0.89 and 0.91) were closely related to local air pollution. Thus, we infer that the atmospheric aerosols in Wuwei and Zhangye not only include anthropogenic soil dust that is smaller than 1 µm but have also undergone mixing with air pollutants during their transportation from urban and industrial regions. However, the ω637 values in Dunhuang ranged between 0.875 and 1.00, with the majority of these values falling between 0.950 and 0.975 because of the high percentage of natural mineral dust. These results are consistent with those of a previous study, which indicated that the surface measurement of SSA for coarse-mode particles from Saharan desert regions at 550 nm yielded a value of 0.97 ± 0.02 (Cattrall et al., 2003).
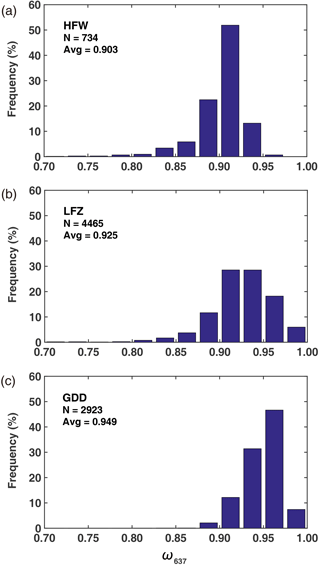
Figure 7Histograms of 5 min averaged single-scattering albedo at 637 nm in (a) Wuwei, (b) Zhangye, and (c) Dunhuang. The numbers of samples and average values are also shown. Note that data collected during the strong dust storm in Zhangye are excluded.
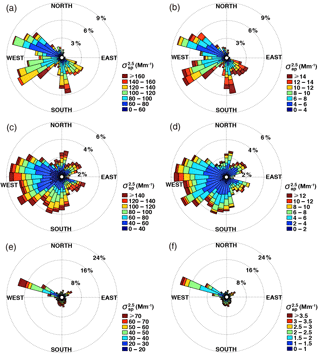
Figure 8Wind roses for (a) aerosol scattering coefficient at 550 nm and (b) aerosol absorption coefficient at 637 nm in Wuwei. Panels (c) and (d) are the same as (a) and (b) but for Zhangye. Panels (e) and (f) are the same as (a) and (b) but for Dunhuang. Note that data collected during the strong dust storm in Zhangye are excluded.
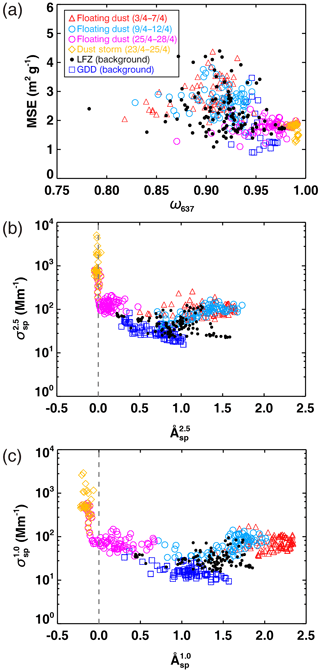
Figure 9Scatter plots of (a) mass scattering efficiency (MSE) versus single-scattering albedo at 637 nm and (b) scattering Ångström exponent at 450–700 nm versus aerosol scattering coefficient of PM2.5 at 550 nm. Panel (c) is the same as (b) but for PM1.0. The color symbols represent different atmospheric conditions during the dust field campaign.
3.3 Local emission source attribution
Additionally, the wind roses described in Fig. 8 can be used to provide further insights into the correlation between the meteorology and local emission sources. The wind direction accompanying and most likely represents the emissions from both local sources and regional transport from remote regions. The dominant wind directions at these three sites were generally more abundant to the west. Figure 8a indicates that the higher values of (> 160 Mm−1) were found along with the south wind, which implied that dust particles were primarily generated from nearby farmlands; the majority of values were dominated by the southeast wind because of the emissions of anthropogenic pollutants from Huangyang. The fact that the highest values of (> 140 Mm−1) and (> 12 Mm−1) were associated with the west wind in Zhangye most likely indicated that anthropogenic soil dust mixed with local air pollutants from their upwelling residences (Fig. 8c and d). However, both and were probably influenced by coarse-mode mineral dust origin from desert areas due to the prevalent northwest wind in Dunhuang (Fig. 8e and f).
MSE is a key parameter that can be used to estimate the radiative forcing effects due to atmospheric particles on global climate. Therefore, several studies have been performed to determine the optical properties of aerosols using MSE values (Laing et al., 2016). For instance, Hand and Malm (2007) noted that the MSE is mainly dependent on particle composition (e.g., the particle refractive index and aerosol size distribution). As shown in Fig. 9a, coarse-mode particles have significantly higher ω637 (> 0.93) and lower MSE (1 < MSE < 2) values because of the presence of natural mineral dust under background weather conditions in Dunhuang. However, there appeared to be no clear difference between the ω637 and MSE values due to floating dust periods in Wuwei and Zhangye. The presence of higher MSE in Wuwei and Zhangye, suggested that fine-mode particles cannot only be attributed to floating dust periods (due to local soil dust) but also include BC, OC, and other air pollutants that originated from the burning of biomass and fossil fuels. For instance, the large variations in ω637 and MSE observed in Wuwei and Zhangye were consistent with values that were previously measured during dust storms or biomass burning events (Li et al., 2010; Laing et al., 2016). Another notable feature is the remarkable discrepancy between the optical properties of aerosols for a given type of aerosol with diameters of less than 1 and 2.5 µm. Although the values of measured during this dust field campaign were only slightly lower than those of (as is presented in Fig. 9b and c), the values ranged between ∼ 1.4 and 2.3 (mean: 2.1) for fine-mode particles because of floating dust episodes in Wuwei, compared to the values of that ranged between ∼ 0.5 and 1.7 (mean: 1.3) observed during the same period. Similar results were also found at the other two sites in Zhangye and Dunhuang.
3.4 Case study
Aerosol optical depth (AOD) is a major optical parameter for aerosol particles and a key factor affecting global climate (Holben et al., 1991, 2001, 2006; Srivastava and Bhardwaj, 2014). Dubovik et al. (2002) demonstrated that nonspherical mineral dust can be retrieved using the assumption of spherical aerosols for high aerosol loading (AOD > 0.5, Å < 0.7) in desert regions due to dust events. Figure 10 illustrates the spatial distribution of deep blue AOD at 550 nm in East Asia retrieved using Terra MODIS during a heavy dust storm over northern China on 24 April 2014. During this dust storm, the spatial distribution of high aerosol loadings with AOD values of > 1.6 over northwestern China was observed; in this distribution, the transport of natural mineral dust from the Taklimakan Desert to the downwelling regions over China can be clearly seen. The most prominent feature in Fig. 11 is that reached its peak value of ∼ 5074 Mm−1 and that a strong relationship (R2=0.9093) existed between and during the dust storm. However, the values of observed during this dust storm were consistent with those measured during floating dust episodes in Wuwei and Zhangye. Therefore, we note large differences in between natural mineral dust and anthropogenic soil dust because of the presence of fine-mode particles during floating dust episodes and coarse-mode particles during the dust storm. We also observed the lowest values of and (which were in the range of ∼ 1.2–7.9 and ∼ 16–224 Mm−1, respectively) in Dunhuang, which indicated that natural mineral dust represented the dominant particles under the background conditions of Dunhuang.
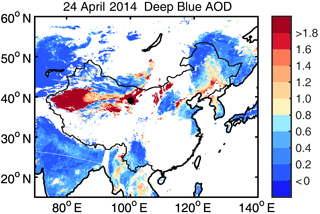
Figure 10Terra MODIS Deep Blue AOD measured at 550 nm by the NASA Giovanni system during a heavy dust storm on 24 April 2014. The black dot represents the location of the ground-based mobile laboratory at Zhangye.
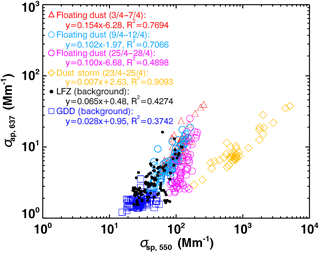
Figure 11Scatter plot of aerosol absorption coefficients versus scattering coefficients from 3 April to 16 May 2014. The color symbols represent different atmospheric conditions during the dust field campaign.
Figure 12 shows the average aerosol number size distribution observed under different weather conditions during this field campaign. These data clearly show that the dominant particles during the dust storm in Zhangye were coarse-mode particles ranging in size from 1 µm to 5 µm, which peaked at 1.60 µm with a maximum dN ∕ dlogDp value of ∼ 590 cm−3. Compared with the dust storm, the dN ∕ dlogDp reached peaks with values of ∼ 336 and ∼ 332 cm−3 at 0.67 µm during typical floating dust episodes on 4–7 April in Wuwei and 9–12 April in Zhangye, respectively. This observation indicated that fine-mode anthropogenic soil dust possibly mixed with local air pollutants was dominant during these two floating dust episodes. However, another floating dust episode that occurred in Zhangye revealed a bimodal variation, which peaked at 0.67 µm (∼ 77 cm−3) and 1.49 µm (∼ 60 cm−3). It should also be noted that the lowest value of dN ∕ dlogDp for fine-mode particles was observed in Dunhuang under the background weather conditions. These results are very close to those of previous studies that stated that atmospheric particles were dominated by both anthropogenic soil dust and air pollutants during floating dust episodes; however, the number of coarse-mode particles increased sharply during natural dust storms that originated from dust source regions (Wang et al., 2010; Li et al., 2010).
The gravimetric density of fine-mode particles is reported to range between 1.0 and 2.0 g cm−3, with an average value of 1.5 g cm−3 (Sloane et al., 1991; Seinfeld and Pandis, 1998). In this study, the gravimetric density of fine-mode mineral dust particles was estimated by using the integrated volume concentrations measured by APS and the mass concentration of PM2.5 measured by TEOM. As shown in Fig. S2 and Table 3, we found that the gravimetric density of dust particles was in the range of 1.04–1.64 g cm−3, and there was no evidence of significant differences in the dust gravimetric density during floating dust and dust storm episodes. Then, the volume-weighted mean diameters (VMDs) under the diameters of 2.5 and 1.0 µm were also calculated by using the integrated number size distribution of APS data (DeCarlo et al., 2005). We found that the VMD2.5 and values were correlated well during the whole dust field campaign (Fig. S3 in Supplement). However, there was no significant linear correlation between VMD1.0 and . The highly possible explanation is that the VMD1.0 is calculated based on the aerosol size diameter ranging from 0.5 to 1 µm measured by APS, while the variation in is affected by an aerosol diameter under 1 µm.
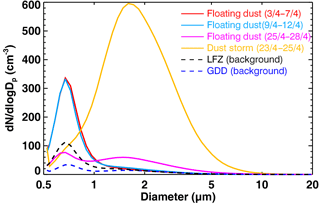
Figure 12Average aerosol size distribution (dN ∕ dlogDp, cm−3) based on all run data collected under different weather conditions during the entire campaign.
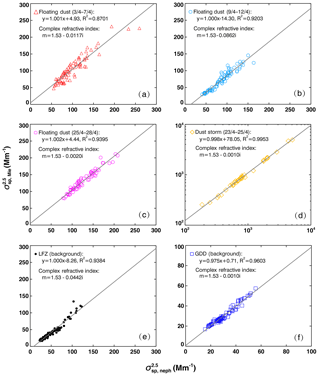
Figure 13Correlation between PM2.5 scattering coefficient calculated from the Mie theory and observed with the nephelometer at 550 nm under different atmospheric conditions during the dust field campaign.
Table 3Statistical summary of optical and microphysical properties of aerosols in different atmospheric conditions during the dust field campaign.
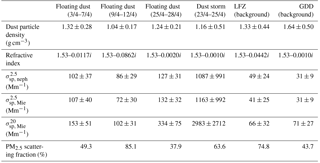
Finally, we used the Mie theory and the aerosol number size distribution to estimate the scattering coefficient compared with that derived using the nephelometer. As shown in Fig. 13, the Mie-calculated scattering coefficient ( and the measured scattering coefficient ( of 550 nm were highly correlated. For instance, the imaginary part of the refractive index (0.001) for natural dust during the dust storm in Zhangye and the background weather condition in Dunhuang were similar to the result of SAMUM-1 in the Sahara Desert (Müller et al., 2009). However, the higher values of the imaginary part (∼ 0.01–0.08) during floating dust reflected inherently more anthropogenic dust particles, which can absorb more solar radiation than natural mineral dust during the dust storm. Based on the Mie calculation in this study, the PM2.5 scattering fraction, which is defined as the contribution of the light scattering of PM2.5 to the total scattering (the calculated scattering coefficient in the size range of 0.5–20 µm), was ∼ 36.4 % during the dust storm, while it was in the range of ∼ 37.9–85.1 % during floating dust episodes. Detailed information of Mie-calculated and measured scattering coefficient is summarized in Table 3. Comparisons between σsp,Mie and σsp,neph were carried out taking into account the uncertainties of the measurements and the calculations. The was ∼ 6.6 % higher than during the dust storm, while it was ∼ 16.5 % lower than that during floating dust from 9 to 12 April. Generally, most of the values agreed well with , which can reflect a good quality of the datasets of during this dust field campaign.
This study is novel in that we not only captured natural mineral dust near the desert regions but also characterized the properties of anthropogenic soil dust produced by agricultural cultivations, especially during floating dust episodes. The most prominent conclusion is that there were significant differences in the optical and microphysical properties of aerosols between anthropogenic soil dust and natural mineral dust under different atmospheric conditions (e.g., dust storm, floating dust episodes, and background conditions). During the floating dust period in Wuwei (i.e., 3–7 April), the average values of , , , ω637, , and MSE were 102 ± 37, 12.2 ± 4.4, 9.7 ± 6.1 Mm−1, 0.902 ± 0.025, 1.28 ± 0.27, and 2.79 ± 0.57 m2 g−1, respectively; during two floating dust periods in Zhangye (i.e., 9–12 and 25–28 April), the corresponding values were 115 ± 36, 12.1 ± 4.2, 6.4 ± 4.0 Mm−1, 0.935 ± 0.030, 0.73 ± 0.59, and 2.24 ± 0.57 m2 g−1, respectively, whereas these values were sequentially 1088 ± 991, 114.6 ± 101.6, 10.6 ± 7.6 Mm−1, 0.989 ± 0.004, −0.014 ± 0.018, and 1.73 ± 0.20 m2 g−1 during the heavy dust storm in Zhangye (i.e., 23–25 April). We also note that the values of observed in Wuwei (74 ± 27 Mm−1) and Zhangye (57 ± 33 Mm−1) were only slightly lower than those of , while large differences were observed in Dunhuang. The number size distribution (dN ∕ dlogDp) of coarse-mode particles with diameters of 1–3 µm can reach a peak of ∼ 590 cm−3, which revealed that pure coarse-mode particles from desert regions were dominant during the dust storm in Zhangye. However, the overall variations in ω637 were in the range of ∼ 0.82–0.95 and ∼ 0.83–0.98 during floating dust episodes in Wuwei and Zhangye, respectively, indicating that atmospheric aerosols not only include the anthropogenic soil dust produced by agricultural cultivations but have also mixed with air pollutants because of the transportation from their upwelling residences. We used a modified Mie theory and the aerosol number size distribution measured with an APS to estimate the scattering coefficients. The imaginary parts of the refractive indexes for natural dust during the dust storm was 0.001, while the higher values of the imaginary part (∼ 0.01–0.08) during floating dust periods reflected inherently more anthropogenic dust particles. These results reflected that atmospheric aerosols during this dust field campaign were not only dominated by anthropogenic soil dust produced by agricultural cultivations in Wuwei and Zhangye but also included natural mineral dust originated from the dust source regions over northwestern China.
All datasets and codes used to produce this study can be obtained by contacting Xin Wang (wxin@lzu.edu.cn). The MODIS data used in this study are available at Aerosol Product, https://modis.gsfc.nasa.gov/data/dataprod/mod04.php (NASA, 2017).
The supplement related to this article is available online at: https://doi.org/10.5194/acp-18-2119-2018-supplement.
The authors declare that they have no conflict of interest.
This research was supported by the Foundation for Innovative Research Groups
of the National Science Foundation of China (41521004) and the National Science
Foundation of China (41775144 and 41522505). The MODIS data were obtained
from the NASA Earth Observing System Data and Information System.
Edited by: Aijun Ding
Reviewed by: two anonymous referees
Aleksandropoulou, V., Torseth, K., and Lazaridis, M.: Atmospheric Emission Inventory for Natural and Anthropogenic Sources and Spatial Emission Mapping for the Greater Athens Area, Water Air Soil Pollut., 219, 507–526, https://doi.org/10.1007/s11270-010-0724-2, 2011.
Anderson, T. L. and Ogren, J. A.: Determining aerosol radiative properties using the TSI 3563 Integrating Nephelometer, Aerosol Sci. Tech., 29, 57–69, https://doi.org/10.1080/02786829808965551, 1998.
Anderson, T. L., Covert, D. S., Marshall, S. F., Laucks, M. L., Charlson, R. J., Waggoner, A. P., Ogren, J. A., Caldow, R., Holm, R. L., Quant, F. R., Sem, G. J., Wiedensohler, A., Ahlquist, N. A., and Bates, T. S.: Performance characteristics of a high-sensitivity, three-wavelength total scatter-backscatter nephelometer, J. Atmos. Ocean. Tech., 13, 967–986, 1996.
Arimoto, R., Kim, Y. J., Kim, Y. P., Quinn, P. K., Bates, T. S., Anderson, T. L., Gong, S., Uno, I., Chin, M., Huebert, B. J., Clarke, A. D., Shinozuka, Y., Weber, R. J., Anderson, J. R., Guazzotti, S. A., Sullivan, R. C., Sodeman, D. A., Prather, K. A., and Sokolik, I. N.: Characterization of Asian Dust during ACE-Asia, Global Planet. Change, 52, 23–56, https://doi.org/10.1016/j.gloplacha.2006.02.013, 2006.
Arnott, W. P., Moosmuller, H., Sheridan, P. J., Ogren, J. A., Raspet, R., Slaton, W. V., Hand, J. L., Kreidenweis, S. M., and Collett, J. L.: Photoacoustic and filter-based ambient aerosol light absorption measurements: Instrument comparisons and the role of relative humidity, J. Geophys. Res.-Atmos., 108, 4034, https://doi.org/10.1029/2002jd002165, 2003.
Arya, S. P.: Air Pollution Meteorology and Dispersion, 310 pp., Oxford University Press, New York, 1999.
Bi, J., Huang, J., Shi, J., Hu, Z., Zhou, T., Zhang, G., Huang, Z., Wang, X., and Jin, H.: Measurement of scattering and absorption properties of dust aerosol in a Gobi farmland region of northwestern China – a potential anthropogenic influence, Atmos. Chem. Phys., 17, 7775–7792, https://doi.org/10.5194/acp-17-7775-2017, 2017.
Bohren, C. F. and Huffman, D. R.: Absorption and Scattering of Light by Small Particles, John Wiley, Hoboken, NJ, 1983.
Bond, T. C. and Bergstrom, R. W.: Light Absorption by Carbonaceous Particles: An Investigative Review, Aerosol Sci. Tech., 40, 27–67, https://doi.org/10.1080/02786820500421521, 2006.
Cattrall, C., Carder, K. L., and Gordon, H. R.: Columnar aerosol single-scattering albedo and phase function retrieved from sky radiance over the ocean: measurements of Saharan dust, J. Geophys. Res.-Atmos., 108, 4287, https://doi.org/10.1029/2002jd002497, 2003.
Cermak, J., Wild, M., Knutti, R., Mishchenko, M. I., and Heidinger, A. K.: Consistency of global satellite-derived aerosol and cloud data sets with recent brightening observations, Geophys. Res. Lett., 37, https://doi.org/10.1029/2010gl044632, 2010.
Che, H. Z., Wang, Y. Q., and Sun, J. Y.: Aerosol optical properties at Mt. Waliguan Observatory, China, Atmos. Environ., 45, 6004–6009, https://doi.org/10.1016/j.atmosenv.2011.07.050, 2011.
Che, H. Z., Wang, Y. Q., Sun, J. Y., Zhang, X. C., Zhang, X. Y., and Guo, J. P.: Variation of Aerosol Optical Properties over the Taklimakan Desert in China, Aerosol Air Qual. Res., 13, 777–785, https://doi.org/10.4209/aaqr.2012.07.0200, 2013.
Chen, S. Y., Huang, J. P., Zhao, C., Qian, Y., Leung, L. R., and Yang, B.: Modeling the transport and radiative forcing of Taklimakan dust over the Tibetan Plateau: A case study in the summer of 2006, J. Geophys. Res.-Atmos., 118, 797–812, https://doi.org/10.1002/jgrd.50122, 2013.
DeCarlo, P. F., Slowik, J. G., Worsnop, D. R., Davidovits, P., and Jimenez, J. L.: Particle morphology and density characterization by combined mobility and aerodynamic diameter measurements. Part 1: Theory, Aerosol Sci. Tech., 38, 1185–1205, https://doi.org/10.1080/02786820590928897, 2005.
Dubovik, O., Holben, B. N., Eck, T. F., Smirnov, A., Kaufman, Y. J., King, M. D., Tanré, D., and Slutsker, I.: Variability of absorption and optical properties of key aerosol types observed in worldwide locations, J. Atmos. Sci., 59, 590–608, https://doi.org/10.1175/1520-0469(2002)059<0590:VOAAOP>2.0.CO;2, 2002.
Fan, X. H., Chen, H. B., Xia, X. G., Li, Z. Q., and Cribb, M.: Aerosol optical properties from the Atmospheric Radiation Measurement Mobile Facility at Shouxian, China, J. Geophys. Res.-Atmos., 115, https://doi.org/10.1029/2010jd014650, 2010.
Favez, O., Cachier, H., Sciare, J., Sarda-Esteve, R., and Martinon, L.: Evidence for a significant contribution of wood burning aerosols to PM2.5 during the winter season in Paris, France, Atmos. Environ., 43, 3640–3644, https://doi.org/10.1016/j.atmosenv.2009.04.035, 2009.
Garland, R. M., Yang, H., Schmid, O., Rose, D., Nowak, A., Achtert, P., Wiedensohler, A., Takegawa, N., Kita, K., Miyazaki, Y., Kondo, Y., Hu, M., Shao, M., Zeng, L. M., Zhang, Y. H., Andreae, M. O., and Pöschl, U.: Aerosol optical properties in a rural environment near the mega-city Guangzhou, China: implications for regional air pollution, radiative forcing and remote sensing, Atmos. Chem. Phys., 8, 5161–5186, https://doi.org/10.5194/acp-8-5161-2008, 2008.
Ge, J. M., Su, J., Ackerman, T. P., Fu, Q., Huang, J. P., and Shi, J. S.: Dust aerosol optical properties retrieval and radiative forcing over northwestern China during the 2008 China-U.S. joint field experiment, J. Geophys. Res.-Atmos., 115, D00K12, https://doi.org/10.1029/2009jd013263, 2010.
Ge, J. M., Su, J., Fu, Q., Ackerman, T. P., and Huang, J. P.: Dust aerosol forward scattering effects on ground-based aerosol optical depth retrievals, J. Quant. Spectrosc. Ra., 112, 310–319, https://doi.org/10.1016/j.jqsrt.2010.07.006, 2011.
Ge, J. M., Huang, J. P., Xu, C. P., Qi, Y. L., and Liu, H. Y.: Characteristics of Taklimakan dust emission and distribution: A satellite and reanalysis field perspective, J. Geophys. Res.-Atmos., 119, 11772–11783, https://doi.org/10.1002/2014jd022280, 2014.
Ginoux, P., Garbuzov, D., and Hsu, H. C.: Identification of anthropogenic and natural dust sources using Moderate Resolution Imaging Spectroradiometer (MODIS) Deep Blue level 2 data, J. Geophys. Res.-Atmos., 115, D05204, https://doi.org/10.1029/2009jd012398, 2010.
Goudie, A. S. and Middleton, N. J.: Saharan dust storms: Nature and consequences, Earth-Sci. Rev., 56, 179–204, https://doi.org/10.1016/S0012-8252(01)00067-8, 2001.
Hand, J. L. and Malm, W. C.: Review of aerosol mass scattering efficiencies from ground-based measurements since 1990, J. Geophys. Res.-Atmos., 112, D16203, https://doi.org/10.1029/2007jd008484, 2007.
Haywood, J. M. and Shine, K. P.: The Effect of Anthropogenic Sulfate and Soot Aerosol on the Clear-Sky Planetary Radiation Budget, Geophys. Res. Lett., 22, 603–606, https://doi.org/10.1029/95gl00075, 1995.
Holben, B. N., Eck, T. F., and Fraser, R. S.: Temporal and Spatial Variability of Aerosol Optical Depth in the Sahel Region in Relation to Vegetation Remote-Sensing, Int. J. Remote Sens., 12, 1147–1163, https://doi.org/10.1080/01431169108929719, 1991.
Holben, B. N., Tanre, D., Smirnov, A., Eck, T. F., Slutsker, I., Abuhassan, N., Newcomb, W. W., Schafer, J. S., Chatenet, B., Lavenu, F., Kaufman, Y. J., Castle, J. V., Setzer, A., Markham, B., Clark, D., Frouin, R., Halthore, R., Karneli, A., O'Neill, N. T., Pietras, C., Pinker, R. T., Voss, K., and Zibordi, G.: An emerging ground-based aerosol climatology: Aerosol optical depth from AERONET, J. Geophys. Res.-Atmos., 106, 12067–12097, https://doi.org/10.1029/2001jd900014, 2001.
Holben, B. N., Eck, T., Slutsker, I., Smirnov, A., Sinyuk, A., Schafer, J., Giles, D., and Dubovik, O.: AERONET Version 2.0 quality assurance criteria, in: Remote Sensing of the Atmosphere and Clouds, Proc. of SPIE, Goa, India, 13–17 November, 6408, https://doi.org/10.1117/12.706524, 2006.
Huang, J. P., Minnis, P., Chen, B., Huang, Z. W., Liu, Z. Y., Zhao, Q. Y., Yi, Y. H., and Ayers, J. K.: Long-range transport and vertical structure of Asian dust from CALIPSO and surface measurements during PACDEX, J. Geophys. Res.-Atmos., 113, D23212, https://doi.org/10.1029/2008jd010620, 2008.
Huang, J., Minnis, P., Yan, H., Yi, Y., Chen, B., Zhang, L., and Ayers, J. K.: Dust aerosol effect on semi-arid climate over Northwest China detected from A-Train satellite measurements, Atmos. Chem. Phys., 10, 6863–6872, https://doi.org/10.5194/acp-10-6863-2010, 2010.
Huang, J. P., Wang, T. H., Wang, W. C., Li, Z. Q., and Yan, H. R.: Climate effects of dust aerosols over East Asian arid and semiarid regions, J. Geophys. Res.-Atmos., 119, 11398–11416, https://doi.org/10.1002/2014jd021796, 2014.
Huang, J. P., Liu, J. J., Chen, B., and Nasiri, S. L.: Detection of anthropogenic dust using CALIPSO lidar measurements, Atmos. Chem. Phys., 15, 11653–11665, https://doi.org/10.5194/acp-15-11653-2015, 2015a.
Huang, J. P., Yu, H. P., Guan, X. D., Wang, G. Y., and Guo, R. X.: Accelerated dryland expansion under climate change, Nat. Clim. Change, 6, 166–172, https://doi.org/10.1038/nclimate2837, 2015b.
Jacob, D. J., Crawford, J. H., Kleb, M. M., Connors, V. S., Bendura, R. J., Raper, J. L., Sachse, G. W., Gille, J. C., Emmons, L., and Heald, C. L.: Transport and Chemical Evolution over the Pacific (TRACE-P) aircraft mission: Design, execution, and first results, J. Geophys. Res.-Atmos., 108, 1–19, https://doi.org/10.1029/2002jd003276, 2003.
Kim, W., Doh, S. J., and Yu, Y.: Anthropogenic contribution of magnetic particulates in urban roadside dust, Atmos. Environ., 43, 3137–3144, https://doi.org/10.1016/j.atmosenv.2009.02.056, 2009.
Laing, J. R., Jaffe, D. A., and Hee, J. R.: Physical and optical properties of aged biomass burning aerosol from wildfires in Siberia and the Western USA at the Mt. Bachelor Observatory, Atmos. Chem. Phys., 16, 15185–15197, https://doi.org/10.5194/acp-16-15185-2016, 2016.
Li, C., Tsay, S.-C., Fu, J. S., Dickerson, R. R., Ji, Q., Bell, S. W., Gao, Y., Zhang, W., Huang, J., Li, Z., and Chen, H.: Anthropogenic air pollution observed near dust source regions in northwestern China during springtime 2008, J. Geophys. Res.-Atmos., 115, D00K22, https://doi.org/10.1029/2009jd013659, 2010.
Li, G. J., Chen, J., Ji, J. F., Yang, J. D., and Conway, T. M.: Natural and anthropogenic sources of East Asian dust, Geology, 37, 727–730, https://doi.org/10.1130/g30031a.1, 2009.
Li, J., Wang, Z., Zhuang, G., Luo, G., Sun, Y., and Wang, Q.: Mixing of Asian mineral dust with anthropogenic pollutants over East Asia: a model case study of a super-duststorm in March 2010, Atmos. Chem. Phys., 12, 7591–7607, https://doi.org/10.5194/acp-12-7591-2012, 2012.
Li, R. and Min, Q. L.: Impacts of mineral dust on the vertical structure of precipitation, J. Geophys. Res.-Atmos., 115, D09203, https://doi.org/10.1029/2009jd011925, 2010.
Li, R., Dong, X., Guo, J. C., Fu, Y. F., Zhao, C., Wang, Y., and Min, Q. L.: The implications of dust ice nuclei effect on cloud top temperature in a complex mesoscale convective system, Sci. Rep., 7, 13826, https://doi.org/10.1038/s41598-017-12681-0, 2017.
Li, Z. Q., Lau, W. K. M., Ramanathan, V., Wu, G., Ding, Y., Manoj, M. G., Liu, J., Qian, Y., Li, J., Zhou, T., Fan, J., Rosenfeld, D., Ming, Y., Wang, Y., Huang, J., Wang, B., Xu, X., Lee, S. S., Cribb, M., Zhang, F., Yang, X., Zhao, C., Takemura, T., Wang, K., Xia, X., Yin, Y., Zhang, H., Guo, J., Zhai, P. M., Sugimoto, N., Babu, S. S., and Brasseur, G. P.: Aerosol and monsoon climate interactions over Asia, Rev. Geophys., 54, 866–929, https://doi.org/10.1002/2015rg000500, 2016.
Liu, L. X., Huang, X., Ding, A. J., and Fu, C. B.: Dust-induced radiative feedbacks in north China: A dust storm episode modeling study using WRF-Chem, Atmos. Environ., 129, 43–54, https://doi.org/10.1016/j.atmosenv.2016.01.019, 2016.
Liu, Y., Sato, Y., Jia, R., Xie, Y., Huang, J., and Nakajima, T.: Modeling study on the transport of summer dust and anthropogenic aerosols over the Tibetan Plateau, Atmos. Chem. Phys., 15, 12581–12594, https://doi.org/10.5194/acp-15-12581-2015, 2015.
Mahowald, N. M. and Luo, C.: A less dusty future?, Geophys. Res. Lett., 30, 1903, https://doi.org/10.1029/2003gl017880, 2003.
Mätzler, C.: MATLAB functions for Mie scattering and absorption, Res. Rep. 2002–08, Inst. Fur Angew. Phys., Bern, 2002.
McConnell, C. L., Formenti, P., Highwood, E. J., and Harrison, M. A. J.: Using aircraft measurements to determine the refractive index of Saharan dust during the DODO Experiments, Atmos. Chem. Phys., 10, 3081–3098, https://doi.org/10.5194/acp-10-3081-2010, 2010.
Mie, G.: Beiträge zur optic trüber Medien speziell kolloidaler Metallösungen, Ann. Phys., 25, 377–445, 1908.
Mishchenko, M. I., Lacis, A. A., Carlson, B. E., and Travis, L. D.: Nonsphericity of Dust-Like Tropospheric Aerosols – Implications for Aerosol Remote-Sensing and Climate Modeling, Geophys. Res. Lett., 22, 1077–1080, https://doi.org/10.1029/95gl00798, 1995.
Müller, T., Schladitz, A., Massling, A., Kaaden, N., Kandler, K., and Wiedensohler, A.: Spectral absorption coefficients and imaginary parts of refractive indices of Saharan dust during SAMUM-1, Tellus B, 61, 79–95, https://doi.org/10.1111/j.1600-0889.2008.00399.x, 2009.
Müller, T., Henzing, J. S., de Leeuw, G., Wiedensohler, A., Alastuey, A., Angelov, H., Bizjak, M., Collaud Coen, M., Engström, J. E., Gruening, C., Hillamo, R., Hoffer, A., Imre, K., Ivanow, P., Jennings, G., Sun, J. Y., Kalivitis, N., Karlsson, H., Komppula, M., Laj, P., Li, S.-M., Lunder, C., Marinoni, A., Martins dos Santos, S., Moerman, M., Nowak, A., Ogren, J. A., Petzold, A., Pichon, J. M., Rodriquez, S., Sharma, S., Sheridan, P. J., Teinilä, K., Tuch, T., Viana, M., Virkkula, A., Weingartner, E., Wilhelm, R., and Wang, Y. Q.: Characterization and intercomparison of aerosol absorption photometers: result of two intercomparison workshops, Atmos. Meas. Tech., 4, 245–268, https://doi.org/10.5194/amt-4-245-2011, 2011.
Nakajima, T., Sekiguchi, M., Takemura, T., Uno, I., Higurashi, A., Kim, D., Sohn, B. J., Oh, S. N., Nakajima, T. Y., Ohta, S., Okada, I., Takamura, T., and Kawamoto, K.: Significance of direct and indirect radiative forcings of aerosols in the East China Sea region, J. Geophys. Res.-Atmos., 108, 8658, https://doi.org/10.1029/2002jd003261, 2003.
NASA: MODIS Aerosol Product, available at: https://modis.gsfc.nasa.gov/data/dataprod/mod04.php, last access: April 2017.
Nie, W., Ding, A. J., Wang, T., Kerminen, V. M., George, C., Xue, L. K., Wang, W. X., Zhang, Q. Z., Petaja, T., Qi, X. M., Gao, X. M., Wang, X. F., Yang, X. Q., Fu, C. B., and Kulmala, M.: Polluted dust promotes new particle formation and growth, Sci. Rep., 4, 6634, https://doi.org/10.1038/srep06634, 2014.
Park, S. U., and Park, M. S.: Aerosol size distributions observed at Naiman in the Asian dust source region of Inner Mongolia, Atmos. Environ., 82, 17–23, https://doi.org/10.1016/j.atmosenv.2013.09.054, 2014.
Patashnick, H. and Rupprecht, E. G.: Continuous PM-10 Measurements Using the Tapered Element Oscillating Microbalance, J. Air Waste Manage., 41, 1079–1083, https://doi.org/10.1080/10473289.1991.10466903, 1991.
Petzold, A. and Schönlinner, M.: Multi-angle absorption photometry – a new method for the measurement of aerosol light absorption and atmospheric black carbon, J. Aerosol Sci., 35, 421–441, https://doi.org/10.1016/j.jaerosci.2003.09.005, 2004.
Petzold, A., Kramer, H., and Schonlinner, M.: Continuous measurement of atmospheric black carbon using a multi-angle absorption photometer, Environ. Sci. Pollut. R., 4, 78–82, 2002.
Prospero, J. M., Ginoux, P., Torres, O., Nicholson, S. E., and Gill, T. E.: Environmental characterization of global sources of atmospheric soil dust identified with the Nimbus 7 Total Ozone Mapping Spectrometer (TOMS) absorbing aerosol product, Rev. Geophys., 40, 1002, https://doi.org/10.1029/2000rg000095, 2002.
Pu, W., Wang, X., Zhang, X. Y., Ren, Y., Shi, J. S., Bi, J. R., and Zhang, B. D.: Size Distribution and Optical Properties of Particulate Matter (PM10) and Black Carbon (BC) during Dust Storms and Local Air Pollution Events across a Loess Plateau Site, Aerosol Air Qual. Res., 15, 2212–2224, https://doi.org/10.4209/aaqr.2015.02.0109, 2015.
Qian, W. H., Tang, X., and Quan, L. S.: Regional characteristics of dust storms in China, Atmos. Environ., 38, 4895–4907, https://doi.org/10.1016/j.atmosenv.2004.05.038, 2004.
Ramanathan, V., Crutzen, P. J., Kiehl, J. T., and Rosenfeld, D.: Atmosphere – Aerosols, climate, and the hydrological cycle, Science, 294, 2119–2124, https://doi.org/10.1126/science.1064034, 2001.
Ramanathan, V., Ramana, M. V., Roberts, G., Kim, D., Corrigan, C., Chung, C., and Winker, D.: Warming trends in Asia amplified by brown cloud solar absorption, Nature, 448, 575–578, https://doi.org/10.1038/nature06019, 2007.
Rosenfeld, D., Rudich, Y., and Lahav, R.: Desert dust suppressing precipitation: A possible desertification feedback loop, P. Natl. Acad. Sci., 98, 5975–5980, https://doi.org/10.1073/pnas.101122798, 2001.
Rosenfeld, D., Clavner, M., and Nirel, R.: Pollution and dust aerosols modulating tropical cyclones intensities, Atmos. Res., 102, 66–76, https://doi.org/10.1016/j.atmosres.2011.06.006, 2011.
Schwarz, J. P., Gao, R. S., Spackman, J. R., Watts, L. A., and Thomson, D. S.: Measurement of the Mixing State, Mass, and Optical Size of Individual Black Carbon Particles in Urban and Biomass Burning Emissions, Geophys. Res. Lett., 35, 13810–13814, https://doi.org/10.1029/2008gl033968, 2008.
Seinfeld, J. and Pandis, S.: Atmospheric chemistry and physics: from air pollution to climate change, Wiley, Inc., New York, 1998.
Shi, J. S., Zhao, M. G., Ge, J. M., Bi, J. R., Wang, X., and Chen, M.: The calibration of three-wavelength integration nephelometer, China Environ. Sci., 33, 1372–1378, 2013 (in Chinese).
Shi, J. S., Tian, P. F., Zhou, T., and Huang, Z. W.: Aerosol optical properties in spring in Agricultural area in Hexi Corridor, J. Arid Meteo., 33, 38–44, 2015 (in Chinese).
Sloane, C. S., Rood, M. J., and Rogers, C. F.: Measurements of Aerosol-Particle Size – Improved Precision by Simultaneous Use of Optical-Particle Counter and Nephelometer, Aerosol Sci. Tech., 14, 289–301, https://doi.org/10.1080/02786829108959491, 1991.
Spracklen, D. V. and Rap, A.: Natural aerosol-climate feedbacks suppressed by anthropogenic aerosol, Geophys. Res. Lett., 40, 5316–5319, https://doi.org/10.1002/2013gl057966, 2013.
Srivastava, K. and Bhardwaj, R.: Analysis and very short range forecast of cyclone “AILA” with radar data assimilation with rapid intermittent cycle using ARPS 3DVAR and cloud analysis techniques, Meteorol. Atmos. Phys., 124, 97–111, https://doi.org/10.1007/s00703-014-0307-7, 2014.
Tao, J., Zhang, L. M., Ho, K. F., Zhang, R. J., Lin, Z. J., Zhang, Z. S., Lin, M., Cao, J. J., Liu, S. X., and Wang, G. H.: Impact of PM2.5 chemical compositions on aerosol light scattering in Guangzhou – the largest megacity in South China, Atmos. Res., 135, 48–58, https://doi.org/10.1016/j.atmosres.2013.08.015, 2014.
Tao, J., Zhang, L. M., Gao, J., Wang, H., Chai, F. H., and Wang, S. L.: Aerosol chemical composition and light scattering during a winter season in Beijing, Atmos. Environ., 110, 36–44, https://doi.org/10.1016/j.atmosenv.2015.03.037, 2015.
Tao, J., Zhang, L., Cao, J., and Zhang, R.: A review of current knowledge concerning PM2.5 chemical composition, aerosol optical properties and their relationships across China, Atmos. Chem. Phys., 17, 9485–9518, https://doi.org/10.5194/acp-17-9485-2017, 2017.
Tegen, I. and Fung, I.: Contribution to the Atmospheric Mineral Aerosol Load from Land-Surface Modification, J. Geophys. Res.-Atmos., 100, 18707–18726, https://doi.org/10.1029/95jd02051, 1995.
Tegen, I., Harrison, S. P., Kohfeld, K. E., Engelstaedter, S., and Werner, M.: Emission of soil dust aerosol: Anthropogenic contribution and future changes, Geochim. Cosmochim. Ac., 66, A766, 2002.
Tegen, I., Werner, M., Harrison, S. P., and Kohfeld, K. E.: Relative importance of climate and land use in determining present and future global soil dust emission, Geophys. Res. Lett., 31, L05105, https://doi.org/10.1029/2003gl019216, 2004.
Thompson, L. G., Davis, M. E., Mosleythompson, E., and Liu, K. B.: Pre-Incan Agricultural Activity Recorded in Dust Layers in 2 Tropical Ice Cores, Nature, 336, 763–765, https://doi.org/10.1038/336763a0, 1988.
Wang, S. G., Wang, J. Y., Zhou, Z. J., and Shang, K. Z.: Regional characteristics of three kinds of dust storm events in China, Atmos. Environ., 39, 509–520, https://doi.org/10.1016/j.atmosenv.2004.09.033, 2005.
Wang, X., Huang, J., Ji, M., and Higuchi, K.: Variability of East Asia dust events and their long-term trend, Atmos. Environ., 42, 3156–3165, https://doi.org/10.1016/j.atmosenv.2007.07.046, 2008.
Wang, X., Huang, J. P., Zhang, R. D., Chen, B., and Bi, J. R.: Surface measurements of aerosol properties over northwest China during ARM China 2008 deployment, J. Geophys. Res.-Atmos., 115, D00K27, https://doi.org/10.1029/2009jd013467, 2010.
Wang, X., Pu, W., Shi, J., Bi, J., Zhou, T., Zhang, X., and Ren, Y.: A comparison of the physical and optical properties of anthropogenic air pollutants and mineral dust over Northwest China, J. Meteorol. Res., 29, 180–200, https://doi.org/10.1007/s13351-015-4092-0, 2015a.
Wang, X., Pu, W., Zhang, X., Ren, Y., and Huang, J.: Water-soluble ions and trace elements in surface snow and their potential source regions across northeastern China, Atmos. Environ., 114, 57–65, https://doi.org/10.1016/j.atmosenv.2015.05.012, 2015b.
Wu, X. et al.: Aerosol optical absorption coefficients at a rural site in Northwest China: great contribution of dust particles, in preparation, 2018.
Xin, J. Y., Wang, S. G., Wang, Y. S., Yuan, J. Y., Zhang, W. Y., and Sun, Y.: Optical properties and size distribution of dust aerosols over the Tengger Desert in Northern China, Atmos. Environ., 39, 5971–5978, https://doi.org/10.1016/j.atmosenv.2005.06.027, 2005.
Xin, J. Y., Du, W. P., Wang, Y. S., Gao, Q. X., Li, Z. Q., and Wang, M. X.: Aerosol Optical Properties Affected by a Strong Dust Storm over Central and Northern China, Adv. Atmos. Sci., 27, 562–574, https://doi.org/10.1007/s00376-009-9023-5, 2010.
Xin, J. Y., Wang, Y. S., Pan, Y. P., Ji, D. S., Liu, Z. R., Wen, T. X., Wang, Y. H., Li, X. R., Sun, Y., Sun, J., Wang, P. C., Wang, G. H., Wang, X. M., Cong, Z. Y., Song, T., Hu, B., Wang, L. L., Tang, G. Q., Gao, W. K., Guo, Y. H., Miao, H. Y., Tian, S. L., and Wang, L.: The Campaign on Atmospheric Aerosol Research Network of China Care-China, B. Am. Meteorol. Soc., 96, 1137–1155, https://doi.org/10.1175/BAMS-D-14-00039.1, 2015.
Xu, J., Bergin, M. H., Greenwald, R., Schauer, J. J., Shafer, M. M., Jaffrezo, J. L., and Aymoz, G.: Aerosol chemical, physical, and radiative characteristics near a desert source region of northwest China during ACE-Asia, J. Geophys. Res.-Atmos., 109, D19S03, https://doi.org/10.1029/2003jd004239, 2004
Yan, H.: Aerosol scattering properties in northern China, Atmos. Environ., 41, 6916–6922, https://doi.org/10.1016/j.atmosenv.2007.04.052, 2007.
Yang, M., Howell, S. G., Zhuang, J., and Huebert, B. J.: Attribution of aerosol light absorption to black carbon, brown carbon, and dust in China – interpretations of atmospheric measurements during EAST-AIRE, Atmos. Chem. Phys., 9, 2035–2050, https://doi.org/10.5194/acp-9-2035-2009, 2009.
Yang, X., Zhao, C. F., Guo, J. P., and Wang, Y.: Intensification of aerosol pollution associated with its feedback with surface solar radiation and winds in Beijing, J. Geophys. Res.-Atmos., 121, 4093–4099, https://doi.org/10.1002/2015jd024645, 2016a.
Yang, X., Zhao, C. F., Zhou, L. J., Wang, Y., and Liu, X. H.: Distinct impact of different types of aerosols on surface solar radiation in China, J. Geophys. Res.-Atmos., 121, 6459–6471, https://doi.org/10.1002/2016jd024938, 2016b.
Zhang, Q., Streets, D. G., Carmichael, G. R., He, K. B., Huo, H., Kannari, A., Klimont, Z., Park, I. S., Reddy, S., Fu, J. S., Chen, D., Duan, L., Lei, Y., Wang, L. T., and Yao, Z. L.: Asian emissions in 2006 for the NASA INTEX-B mission, Atmos. Chem. Phys., 9, 5131–5153, https://doi.org/10.5194/acp-9-5131-2009, 2009.
Zhang, X. Y., Arimoto, R., and An, Z. S.: Dust emission from Chinese desert sources linked to variations in atmospheric circulation, J. Geophys. Res.-Atmos., 102, 28041–28047, https://doi.org/10.1029/97jd02300, 1997.
Zhang, X. Y., Wang, Y. Q., Wang, D., Gong, S. L., Arimoto, R., Mao, L. J., and Li, J.: Characterization and sources of regional-scale transported carbonaceous and dust aerosols from different pathways in coastal and sandy land areas of China, J. Geophys. Res.-Atmos., 110, D15301, https://doi.org/10.1029/2004jd005457, 2005.
Zhang, X. Y., Wang, L., Wang, W. H., Cao, D. J., Wang, X., and Ye, D. X.: Long-term trend and spatiotemporal variations of haze over China by satellite observations from 1979 to 2013, Atmos. Environ., 119, 362–373, https://doi.org/10.1016/j.atmosenv.2015.08.053, 2015.
Zhao, C. F. and Garrett, T. J.: Effects of Arctic haze on surface cloud radiative forcing, Geophys. Res. Lett., 42, 557–564, https://doi.org/10.1002/2014gl062015, 2015.


