the Creative Commons Attribution 4.0 License.
the Creative Commons Attribution 4.0 License.
Springtime aerosol load as observed from ground-based and airborne lidars over northern Norway
Patrick Chazette
Jean-Christophe Raut
Julien Totems
To investigate the origin of springtime aerosols in the Arctic region we performed ground-based and airborne 355 nm Raman lidar observations in the north of Norway (Hammerfest). Two lidars were embedded (i) on an ultralight aircraft for vertical (nadir) or horizontal line-of-sight measurements and (ii) in an air-conditioned van on the ground for vertical (zenith) measurements. This field experiment was designed as part of the Pollution in the ARCtic System (PARCS) project of the French Arctic Initiative and took place from 13 to 26 May 2016. The consistency among lidar measurements is verified by comparing nadir, horizontal line of sight, and ground-based Raman lidar profiles. Dispersion of the order of 0.01 km−1 is obtained among lidar-derived aerosol extinction coefficients at 355 nm. The aerosol load measured in the first 3 km of the troposphere remains low throughout the campaign, with aerosol optical thickness (AOT) of 0.1 at 355 nm (∼0.05 at 550 nm). The main contributors to the evolution of the aerosol load at low altitude prove to be one of the flares of the nearby Melkøya gas processing facility, the oceanic source, and the transport of aerosols from industrial sites in Russia. Moreover, ground-based lidar measurements allowed us to identify three cases of long-range aerosol transport (between 3 and 8 km above the mean sea level). Using back trajectories computed with the Lagrangian model FLEXPART-WRF, these aerosol plumes are shown to be the result of the strong forest fires that occurred in the area of Fort McMurray, in Canada. They can at most double the AOT value over the Arctic area, with an anomaly of 0.1 on the AOT at 355 nm.
- Article
(20532 KB) - Full-text XML
- BibTeX
- EndNote
The pristine Arctic environment is very sensitive and can be easily disturbed by anthropogenic activities, with irreparable consequences. Anthropogenic aerosols play a major role in the evolution of the Arctic radiative balance, as pointed out by the IPCC (2014), and have to be better quantified. Moreover, the Arctic region is exposed to thin but persistent haze (Breider et al., 2014; Shaw, 1995), as well as episodic events of carbonaceous aerosol plumes in the free troposphere (Brock et al., 2011; Quinn et al., 2008; Warneke et al., 2010) since the industrial era. This environmental challenge posed by tropospheric aerosols in the Arctic has already been pointed out by Barrie (1986) and, even more recently, by authors such as Law et al. (2017) or Yang et al. (2014), who analysed the climatic impact and showed that aerosols induce a warming of about 0.6 K decade−1.
Following these observations, the French Arctic Initiative project Pollution in the ARCtic System (PARCS) was performed to improve our understanding of aerosols in the Arctic troposphere. A point of focus was the long-range transport of anthropogenic and biomass burning aerosols over the Arctic region. This innovative field campaign took place from 13 to 26 May 2016 in the region of Hammerfest (70∘39′45 N 23∘41′00 E, Norway), 90 km southwest of the North Cape, within the Arctic Circle. It involved ground-based and airborne Raman lidar observations. The mesoscale dynamic modelling was performed using the Weather Research and Forecasting (WRF) model (Skamarock et al., 2008).
The PARCS experiment follows several international initiatives such as the recent Arctic Climate Change, Economy and Society (ACCESS) project over northern Norway in July 2012 (Raut et al., 2017). ACCESS itself followed the international Polar Study using Aircraft, Remote Sensing, Surface Measurements and Models of Climate, Chemistry, Aerosols, and Transport (POLARCAT) in 2008 (Ancellet et al., 2014) and the Arctic Research of the Composition of the Troposphere from Aircraft and Satellites (ARCTAS) in 2008 (Jacob et al., 2010).
Obviously, the PARCS experiment is a snapshot of the aerosol situation in northern Norway. As in all field campaigns, the atmospheric environment is sampled over a short period of time and is not necessarily representative of the local and seasonal meteorological conditions. The PARCS experiment took place during large-scale weather conditions disturbed by the strong El Niño of 2015–2016 (Hu and Fedorov, 2017), which led to temperatures in the Arctic planetary boundary layer (PBL) 3 to 4 ∘C above the 10-year normal climatic conditions. Also associated with such exceptional atmospheric conditions, transport in the high troposphere favoured the presence of air masses from North America. Spring 2016 was marked by extreme wildfires in Canada's Alberta territory, close to Fort McMurray (Kochtubajda et al., 2017; Landis et al., 2018). The coupling between pyro-convection (Fromm et al., 2005; Peterson et al., 2015) and large-scale atmospheric transport may inject large quantities of aerosols, whose lifetime greatly exceeds a week in the absence of precipitation throughout their transport, into the upper troposphere (Ancellet et al., 2016). Part of these aerosol layers were sampled by a ground-based Raman lidar, which made it possible to describe both the vertical structure and the optical properties of the aerosol plumes (Chazette et al., 2014) as well as the history of their transport using the synergy among the Cloud-Aerosol Lidar with Orthogonal Polarization (CALIOP) (Winker et al., 2003), the Moderate Resolution Imaging Spectroradiometer (MODIS) (King et al., 1992) space-borne instruments, and mesoscale modelling. The observation of biomass fire aerosol transported at high altitude over long distances has already been reported by several authors for different regions of the Earth (Ancellet et al., 2016; Formenti et al., 2002; Forster et al., 2001; Paris et al., 2009; Quennehen et al., 2011; Sitnov and Mokhov, 2017). During the POLARCAT summer campaign in 2008, Schmale et al. (2011) and Thomas et al. (2013) characterized aerosol and gas pollution from fire plumes transported from North America to Greenland. Franklin et al. (2014) and Taylor et al. (2014) documented a case study of aerosol removal in a biomass burning plume over eastern Canada in 2011. More recently, the long-range transport of aerosols from Siberia has also already been evidenced (Marelle et al., 2015; Sitnov and Mokhov, 2017). During the ACCESS airborne campaign in summer 2012 (Roiger et al., 2015), extensive boreal forest fires resulted in significant aerosol transport to the Arctic (Raut et al., 2017). These plumes originating from Siberian wildfires are very common during late spring and summer, and they may be mixed with aerosols coming from highly polluting industrial sources such as oil and gas rigs or petroleum refineries. Vaughan et al. (2018) describe the transport of biomass burning aerosols over the United Kingdom originating from extensive and intense forest fires over Canada in spring 2016. It should be noted that all previous authors only reported isolated long-distance transport events and that this type of phenomenon is rare; the probability of observing one during the short duration of the PARCS campaign was low. The chosen period for PARCS associated with a strong El Niño certainly favoured long-range transport of aerosols and offered an opportunity to sample three different tropospheric plumes.
This paper focuses on the long-range-transported aerosols observed during the PARCS campaign as well as the evolution of the aerosol load in the low troposphere. The field experiment is presented in Sect. 2, in which ground-based and airborne measurements are described. The large-scale observations derived from space-borne instruments and mesoscale modelling are presented in Sect. 3. Section 4 is devoted to the description of the aerosol structures observed during the field campaign, with a spotlight on the low troposphere. Section 5 is dedicated to the identification of the origins of the high-altitude aerosol plumes. The data coherence is discussed in Sect. 6 and the conclusion is presented in Sect. 7.
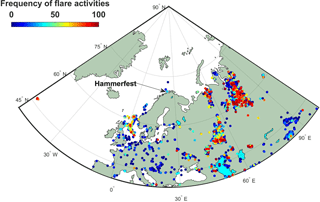
Figure 1Location of the ground-based measurement site, close to Hammerfest (Norway). The frequencies of the main flare activities for both oil and gas rigs are given following Elvidge et al. (2016) for 2016.
The aerosol load is investigated using observations gathered from 13 to 26 May 2016, during the PARCS field campaign held in northern Norway, over 70∘ N (Fig. 1). The ground-based van MAS (mobile atmospheric station; Raut and Chazette, 2009) and an ultralight aircraft (ULA) were mainly equipped with active remote-sensing instruments (Fig. 2): the Weather Atmospheric Lidar (WALI) and the Lidar for Automatic Atmospheric Survey Using Raman Scattering (LAASURS), respectively.
We selected an experimental site near Hammerfest, next to the Airport. The main reason for this is that the Melkøya gas processing facility, which is the northernmost coastal installation and uses the latest techniques of LNG (liquefied natural gas), has two potentially active flares that could significantly influence atmospheric aerosol concentrations: a high-pressure flare from processing and a low-pressure flare from loading and storing LNG. In addition, with the local and shipping activities, the region may be subject to the advection of air masses from the Murmansk area, which has a large concentration of oil and gas industries. We benefited from the help of the Avinor crew of Hammerfest Airport in order to have a suitable operating base and the necessary power supply. They also helped us navigate the ULA, freely lent their hangar at the airport, and offered staff support.
2.1 Ground-based measurements
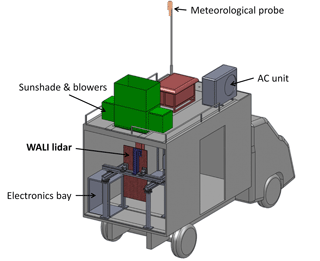
Figure 2 shows the MAS, located close to the Hammerfest Airport. A schematic representation of the MAS and its onboard instruments is given in Fig. 3. It was equipped with the 354.7 nm water vapour Raman lidar WALI (Chazette et al., 2014). These instruments carried out continuous measurements from 13 to 26 May 2016, with a final vertical resolution of 15 m and 1 min integration (∼1000 laser shots). The main characteristics of WALI are summarized in Table 1.
2.2 Airborne measurements
In order to sample the low troposphere around the ground-based lidar, the ULA and Tanarg 912 XS-embedded Raman lidar system LAASURS was used (Chazette and Totems, 2017). Lidar containment enabled operation for temperatures down to ∘C, but with a loss of nearly 40 % of the emitted energy. This has greatly limited the altitude explorations above 1 km above the mean sea level (a.m.s.l.) and we have essentially worked just above the PBL. The lidar and the ULA's flights close to the Melkøya platform are represented in Fig. 4.
Table 1Raman lidar WALI and LAASURS main characteristics. In the third column the corresponding characteristics of the space-borne CALIOP lidar are also presented.
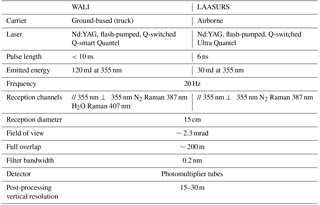
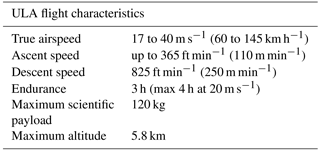
The aircraft, Tanarg 912 XS, was built by the company Air Création (http://www.aircreation.fr/, last access: 29 August 2018) and offers a maximum total payload of ∼250 kg (Table 2). Flight durations were between 1 and 2 h, depending on flight conditions, with a cruise speed of around 85–90 km h−1. The ULA is also equipped with (i) a Vaisala 300 meteorological probe for temperature, pressure and relative humidity and (ii) a Global Positioning System (GPS) and an attitude and heading reference system (AHRS), which are part of the MTi-G components by XSens. The lidar, whose characteristics are given in Table 1, is designed to fulfill eye-safety standards (EN 60825-1). The wide field of view (FOV) of ∼2.3 mrad allows a 90 % overlap of the transmission and reception paths beyond ∼200 m with the desired setting for the experiment. After correction of the overlap function, the data can be used from 150 m with a negligible error compared with the one due to signal noise. The acquisition was performed by averaging 400 laser shots leading to a temporal sampling close to 25 s.
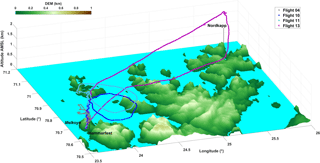
Figure 4Flight plans used for this study: flight 4 on 16 May, flights 10 and 11 on 20–21 May, and flight 13 on 22 May (see Table 3). The flight plans are drawn over the 30 arcsec digital elevation model (DEM) GTOPO30 (https://lta.cr.usgs.gov/GTOPO30, last access: 29 August 2018).
2.3 Strategy and flight plans
We performed a total of 14 flights during the field campaign. The majority of flights were performed near the airport, around the Hammerfest peninsula. Four flights were particularly interesting for aerosol layer detection (Table 3). Three flights were not successful because of technical difficulties and the other ones were performed in low-cloud conditions, with condensation at the ceiling altitude. Only one day out of three was not very cloudy over the period of measurements. The more exploitable flights were performed during nighttime. Note that during the field campaign, the sun did not go down under the horizon. Each flight included a slow spiral ascent or descent during which the lidar was aiming horizontally, and once at the ceiling altitude the lidar was rotated to aim at the nadir.
Flight 4 passed very close to the Melkøya platform and permitted the sampling of one active flare. Flights 10 and 11 were around the Hammerfest peninsula for two non-consecutive hours to check the representativeness of the site for aerosols trapped within the PBL. For flight 13, the ULA took off from Hammerfest Airport at 21:38 UTC (universal time count) and headed towards North Cape at the ceiling altitude of ∼1.8 km a.m.s.l. Before reaching North Cape, the ULA changed heading and flew parallel to the coastline before veering towards the airport, where it landed at 23:58 UTC.
2.4 Data processing for lidar measurements
Lidar data analyses are not presented in detail hereafter since the methods used have already been published (e.g. Chazette et al., 2016, and references therein). The aerosol extinction coefficient (AEC) and the backscatter-to-extinction ratio (BER, inverse of the lidar ratio (LR)) are derived following Chazette et al. (2012) and references therein. The calibration process to retrieve the particle depolarization ratio (PDR) is given in Chazette et al. (2012). The absolute uncertainties on the AEC are ∼0.01 km−1 and the ones on the PDR are ∼1 %–2 % for AEC > 0.03 km−1. For smaller AECs, the error on the PDR is too high and we do not compute it. An example on different aerosol types is given in Appendix A of Dieudonné et al. (2017). The absolute uncertainty on the BER (LR) is ∼0.004 sr−1 (∼10 sr) for a mean BER (LR) of 0.020 sr−1 (50 sr). It decreases when the BER decreases.
The inversion of nadir lidar profiles acquired from the ULA is more difficult due to the noise level. For this reason, we have limited altitude excursions between 1 and 2 km a.m.s.l. The horizontal measurements of the elastic channel are inverted to retrieve the AEC within an absolute uncertainty of 0.01 km−1 following Chazette and Totems (2017) and references therein. We consider a distance from the ULA between ∼0.3 and 1.5 km after correction of the overlap function for the calculations. The nadir measurements are inverted using the constraint brought by the horizontal laser shots and the BER derived from the ground-based lidar. We therefore assume that the aerosol typing does not change during the flight. Note that the N2 Raman channel of the airborne lidar is too noisy to be relevant, mainly due to the loss of emitted energy at low ambient temperature.
3.1 Space-borne observations
Active and passive space-borne measurements were used to follow the aerosol plume transport. The horizontal dispersion of the aerosol plume and its progression along the transport are highlighted with MODIS (King et al., 1992; Salmonson et al., 1989) onboard the polar-orbiting platforms Terra and Aqua. We used a combination of the aerosol optical thickness (AOT) at 550 nm derived from the two satellites. The level 2 products are provided with a spatial horizontal resolution of 10 km2×10 km2 (http://modis.gsfc.nasa.gov, last access: 29 August 2018). The uncertainty on the AOT is AOT over land and AOT over ocean (Chu et al., 2002). The vertical structures of the aerosol layers over their sources are derived from Cloud-Aerosol Lidar with Orthogonal Polarization (CALIOP) aboard Cloud-Aerosol Lidar and Infrared Pathfinder Satellite Observations (CALIPSO, http://www-calipso.larc.nasa.gov, last access: 29 August 2018; Winker et al., 2007). We have used the 4.10 version of CALIOP level 2 data. We mainly took into consideration the aerosol typing of Burton et al. (2015).
3.2 Modelling strategy
3.2.1 Weather model
The 3.5.1 version of the regional non-hydrostatic WRF model (Skamarock et al., 2008) has been used for weather simulations along the field campaign. The model was run from 7 to 28 May 2016, with a dynamical time step of 3 min on a polar stereographic grid almost encompassing the Northern Hemisphere (>7∘ N). The domain has 300×300 grid points with a horizontal resolution of 50 km and 50 vertical levels up to 50 hPa, considered as the top-of-atmosphere pressure. The initial and boundary meteorological conditions for this hemispheric domain are provided by the 6-hourly operational analyses of the ECMWF IFS (Integrated Forecasting System) NWP (numerical weather prediction) model (Dee et al., 2011) from the European Centre for Medium-range Weather Forecasts (ECMWF), with the support of the ESPRI (Ensemble de Services Pour la Recherche á l'IPSL, https://www.ipsl.fr/Organisation/Les-structures-federatives /ESPRI, last access: 29 August 2018) team. Nudging has been applied above the PBL to wind, temperature, and humidity fields, with an update time of 6 h. The parameterizations used are described in Raut et al. (2017) and Marelle et al. (2017). Briefly, the prognostic turbulent kinetic energy scheme of Mellor–Yamada–Janjić (MYJ) is used for the boundary layer, with the associated Janjić eta surface layer module (Janjić, 1994). Land surface processes are resolved using the Noah LSM (unified Noah land surface model; Chen and Dudhia, 2001). We have used the Morrison two-moment scheme (Morrison et al., 2009) to calculate cloud microphysical properties and grid-scale precipitation. Subgrid clouds are represented using the Kain–Fritsch with cumulus potential parameterization developed by Berg et al. (2013). The shortwave and longwave radiation calculations are performed using the RRTMG scheme (Rapid Radiative Transfer Model for Global applications; Iacono et al., 2008).
3.2.2 Back trajectories
The Lagrangian particle dispersion model FLEXPART-WRF (Brioude et al., 2013) derived from the FLEXPART model (Stohl et al., 2005) is run in this study to investigate the origin and transport pathways of air masses bringing aerosols to Hammerfest. Three backward simulations are performed on 15 May, 05:00 UTC; 20 May, 20:00 UTC; and 22 May, 21:00 UTC to provide insight into the representation of aerosol transport to Scandinavia. In each of them, a total of 10 000 particles are released at Hammerfest in a volume of 50 km × 50 km and 1 km (200 m) thick for 15 and 20 May (22 May) centred on the aerosol plumes detected aloft. The origin of each air parcel is then established using the meteorological fields simulated by WRF (Sect. 3.2.1). As transport durations are typically less than 9 days, this approach finally allows us to track the air mass origin over the source regions of interest. As a proxy to represent the source–receptor relationships, we use the PESs (potential emission sensitivities) that quantify the amount of time spent by the particles in every grid cell.
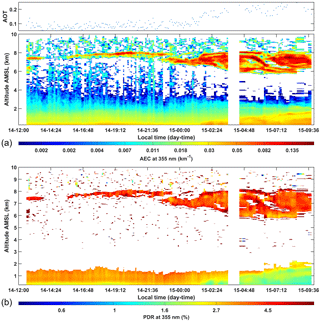
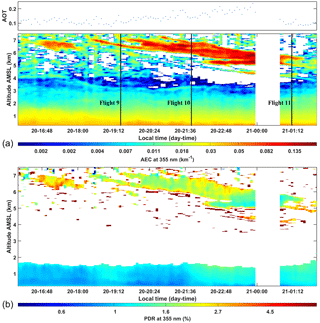
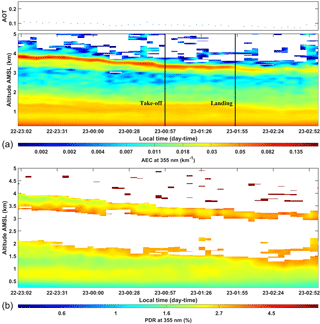
There are few clear-sky periods during the campaign, as is often the case over the studied area. The interesting periods are given in terms of AEC and PDR in Figs. 5–7 (14–15, 20–21, and 22–23 May 2016), in which outstanding high-altitude features are highlighted. The temporal evolutions of the AEC profile are given in local time (LT) corresponding to UTC+2.
4.1 Optical properties of aerosol layers derived from the ground-based lidar
The coupling between the elastic and the N2 Raman channels is used to derive the BER for the different aerosol layers. The molecular contribution is corrected using the hourly vertical profiles of temperature derived from WRF and a classical modelling of the Rayleigh scattering (Bodhaine et al., 1999). The troposphere has been divided into two altitude ranges, as the lower and upper layers are not necessarily composed of the same aerosol types. The first aerosol layer is located between the ground level and ∼2.5–3 km a.m.s.l. and the second one is above 3 km a.m.s.l. The retrieval of the BER for each layer and each measurement period is given in Figure 8. The correct estimate of the BER is obtained when the optical thickness derived from the elastic channel of the lidar is very close to that deduced from the N2 Raman channel (Chazette et al., 2017).
On 14–15 May, the mean BER is ∼0.018 sr−1 for the upper layer with a standard deviation of 0.002 sr−1, now noted sr−1 (LR sr), whereas BER is sr−1 (LR sr) in the lower troposphere (Fig. 8a). Due to the uncertainty linked to the overlap function, the sensitivity of the first 200 m, to which marine aerosols may significantly contribute, is less. Nevertheless, the higher value observed in the vicinity of the PBL is likely to be associated with a contribution of marine aerosols (BER ∼0.04 sr−1 or LR ∼25 sr; Flamant et al., 1998a). The bottom layer depolarizes very slightly the lidar signal, with PDR < 3 %, and even highlights a lower signature (∼1.5 %) after 02:30 LT. It may be due to a larger oceanic contribution, which leads to an increase in the AEC in the PBL (∼0.04 km−1). The upper layer has slightly higher PDR values, of the order of 5 %–6 %. Within this range of PDR, the particles cannot be dust-like aerosols. Nonetheless, they are likely to be pollution or biomass burning particles transported toward the measurement site. The total AOT, without the upper layer, is close to 0.08 at 355 nm and increases up to ∼0.2 in the presence of the higher aerosol plume (Fig. 5).
The BER is smaller, 0.012±0.002 sr−1 (LR sr) (Fig. 8b), for the upper layer on 20–21 May, a typical value expected for pollution and/or biomass burning aerosols. The PDR is also smaller with a mean value close to 1.5 %. The aerosols in the lower troposphere exhibit a larger BER of 0.037±0.003 sr−1 (LR sr), demonstrating a strong influence of the oceanic sources. They are also associated with a small PDR, ∼1 %. The AOT in the lower atmosphere is similar to the one on 14–15 May. The elevated aerosol plume presents an excess AOT close to 0.1 at its maximum (Fig. 6).
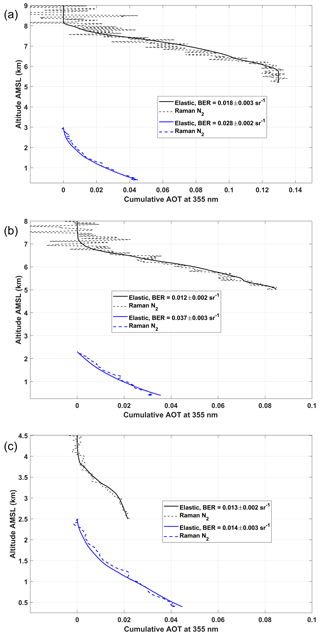
Figure 8Cumulative aerosol optical thickness (AOT) derived from both the N2 Raman (dashed line) and the elastic (continuous lines) channels for the upper (black lines) and the lower (blue line) aerosol layers at 355 nm: (a) 14–15 May, (b) 20–21 May, and (c) 22–23 May.
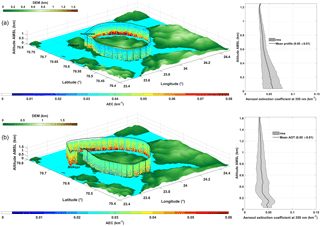
Figure 9Vertical profiles of the aerosol extinction coefficient (AEC) derived from the lidar onboard the ULA: (a) flight 10 and (b) flight 11. The mean AEC vertical profiles and their dispersions are given in the graphs on the right. As in Fig. 4, the flights are plotted over the digital elevation model (DEM) GTOPO30.
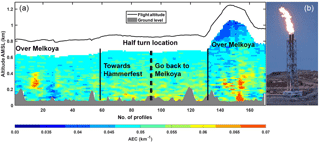
Figure 10(a) Vertical profile of the aerosol extinction coefficient (AEC) during flight 4 (16 May, 22:39–23:24 LT) dedicated to the sampling of the Melkøya flare at 355 nm. (b) Flare sampled by the airborne lidar over the Melkøya platform.
The third period of interest (22–23 May) shows a tiny plume in the middle troposphere, between 3 and 4 km a.m.s.l. (Fig. 7), with a very small AOT excess (∼0.03). The BER (Fig. 8c) and PDR are similar to the ones of 20–21 May, 0.013±0.002 sr−1 (LR sr) and ∼2 %, respectively. The layer underneath is less influenced by marine aerosol and shows a BER close to 0.014±0.003 sr−1 (LR sr), more characteristic of polluted particles. Nonetheless, the layer under 400 m a.m.s.l. is more difficult to sample by the lidar and may contain a significant contribution of marine aerosols, as suggested by the slight decrease in PDR (Fig. 7b).
4.2 Homogeneity of aerosol layers within the lower troposphere
The lidar-derived aerosol optical properties in the lower troposphere look like homogeneous structures that can be related to the specific situation of the ground-based site. Different sources of aerosols may influence the PBL, the main ones being marine aerosols and anthropogenic aerosols generated in the Hammerfest region (domestic combustion, industrial activity, shipping emissions). To verify the representativeness of the local measurements, we used lidar measurements from the ULA.
4.2.1 Marine contribution
The AECs retrieved for flights 10 and 11 are given in Fig. 9 with the mean vertical profiles between the ground level and the ceiling flight altitude in both cases; AOTs are low with a small variability of the order of 0.05±0.01. Higher AECs are observed in the northeastern part of the flights (red areas). Because we did not detect many ships in this area, those AEC enhancements are probably due to sea salts. They may be transported over the nearby coast as the result of the interactions between wind surface and sea (Blanchard and Woodcock, 1980; Flamant et al., 1998b). We note that local pollution is missing altogether.
4.2.2 Gas flaring contribution
The proximity of the gas rig from the Melkøya facility suggests the presence of an industrial source of aerosol and needed to be quantified. The lowest chimney (∼46 m, 70∘41′20 N, 23∘35′59 E) of the Melkøya site used for the low-pressure flare was regularly active during the field experiment and more especially on 16 May (flight 4). The flare (Fig. 10b) at the time of sampling was ∼20 m above the chimney, with a width of ∼5 m. On that day, flare smoke presented a blackish colour because some hard hydrocarbons (condensate) were present in flare gas. The flight pattern shown in Fig. 4 is elongated in Fig. 10 using the profile number for the sake of clarity. The locations of the ULA when it was close to the flare are highlighted (profile nos. ∼18 and ∼154) and correspond to the higher AEC of ∼0.07 km−1. For the second pass, the flare plume is detected from its emission source. The contribution of this flare emission to the AOT is low, ∼0.02 at 355 nm for a total AOT between the ground level and 1 km a.m.s.l. of ∼0.04. The calculation has been performed with a BER of ∼0.037 sr−1 (LR ∼27 sr) and may be underestimated by a factor of 2, as experimental means for a better constraint do not exist. The aerosol particles may age in different ways. These processes depend on the initial chemical composition, which will lead to the coagulation and/or the adsorption of gaseous molecules on the surface of the existing aerosols. In general, this process is quite fast and occurs when relaxing in the atmosphere, i.e. at the exit of the chimney. The particles thus formed may be more or less reactive and more or less hygroscopic. Their size distribution, as well as their complex refractive index, can change, especially in the presence of relative humidity greater than 50–60 (Randriamiarisoa et al., 2006). They can therefore become more scattered and generally less absorbent. The AOT may thus increase during aging in the atmosphere. We cannot provide more insight about this phenomenon because of the lack of in situ chemical analysis during the field experiment. Nevertheless, we note that taken individually, this phenomenon is a small contribution to the local pollution (representing half of the aerosol background in the first kilometre) and it is very localized in space.
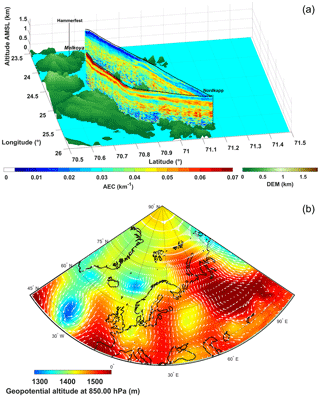
Figure 11(a) Vertical profiles of the aerosol extinction coefficient (AEC) derived from the lidar onboard the ULA for flight 13 on 22 May, 21:38–23:58 UTC. As in Fig. 4, the flights are plotted over the digital elevation model (DEM) GTOPO30. (b) Geopotential altitude for the pressure level of 850 hPa (∼1.6 km a.m.s.l.) at 00:00 UTC on 23 May 2016. The wind field at 850 hPa is also indicated in white arrows.
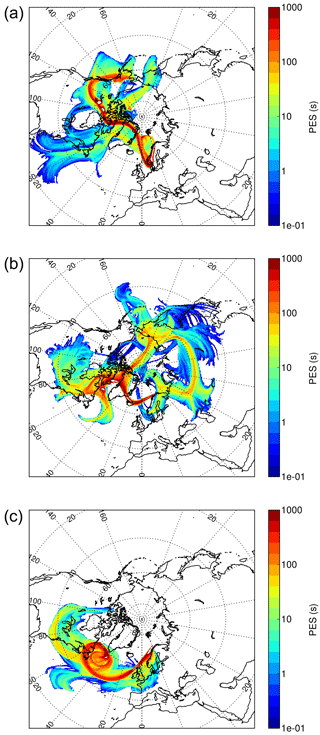
Figure 12The 9-day back trajectories for the upper aerosol plume observed over Hammerfest on (a) 14–15 May, (b) 20–21 May, and (c) 22–23 May 2016. The back trajectories are given in terms of potential emission sensitivity (PES).
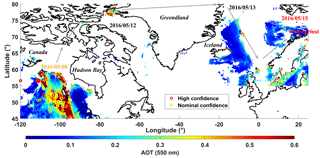
Figure 13MODIS-derived aerosol optical thickness (AOT) at 550 nm for three different days and locations. The dates are indicated in the figure. The thermal anomalies derived from the MODIS fire product are also given on 8 May 2016, corresponding to the origin of the studied aerosol plume. The route followed by the biomass burning plume is represented by grey arrows. It begins on 8 May and finishes on 15 May.
4.2.3 Northern contribution
During the duration of the experiment, we did not observe any specific contribution to the aerosol load in the lowest troposphere above the PBL. An exception was for flight 13 on 22 May, 21:38–23:58 UTC, which was the longest flight we performed. The vertical profiles of the derived AEC following this flight are plotted in Fig. 11a. In the first part of the flight, we note an increase in the AEC close to the ceiling altitude of ∼1.7 km a.m.s.l. with values of over 0.07 km−1. Similar values are measured throughout the flight above the PBL (in red in Fig. 11a). The AOT is ∼0.06 above the continent and decreases above the ocean (∼0.04). The means of constraint are also limited in this case because the signal-to-noise ratio for the N2 Raman channel was not high enough and a BER of 0.014 sr−1 (LR ∼71 sr), initially derived from the ground-based lidar, has been used. The measurements performed during the flight whilst aiming horizontally are also used as constraints. The aerosol layer has been identified as coming from the Murmansk region, Russia. The air mass moves along the coast from east to west, drawn by a low off the Norway coast along the Greenwich meridian. This low is clearly visible in the Fig. 11b and is responsible for the air mass curvature before its northward motion towards Hammerfest and the North Cape.
To investigate the origin of the three upper aerosol layers, 9-day back trajectories have been performed using FLEXPART-WRF and constrained by the meteorological fields simulated by WRF over the Arctic region. The results are given in terms of PES in Fig. 12. These simulations are compared, where possible, with the MODIS and CALIOP space observations to confirm the result.
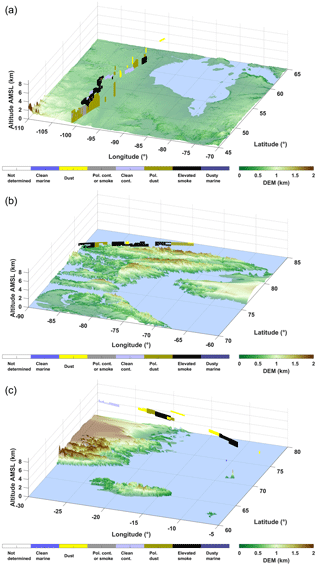
Figure 14CALIOP-derived aerosol typing for (a) Fort McMurray on 8 May (orbit 2016-05-08T08-56-27ZN), (b) the Baffin Sea on 12 May (orbit 2016-05-12T09-18-30ZD), and (c) the Greenland Sea on 13 May (orbit 2016-05-13T11-40-43ZD), corresponding to the plume identified by MODIS in Fig. 13.
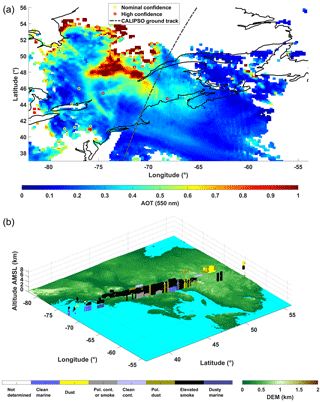
Figure 15(a) MODIS-derived aerosol optical thickness (AOT) at 550 nm and thermal anomalies on 8 May 2016; (b) CALIOP-derived aerosol typing (orbit 2016-05-12T06-53-10ZN). The CALIPSO ground track is indicated in (a).
5.1 Aerosol plume on 14–15 May
On 8–9 May, an aerosol plume was injected in the higher troposphere following the strong forest fires which occurred close to Fort McMurray (56.72∘ N, 111.38∘ W, northeastern Alberta, Canada). As shown in Fig. 13, the aerosol plume has been sampled by MODIS on 8 May, with an AOT larger than 0.4 at 550 nm. In the same figure, the thermal anomalies derived from MODIS are also given for both the nominal and the high confidence levels. The aerosol typing derived from CALIOP is plotted in Fig. 14a. It confirms the injection of biomass burning aerosols between 6 and 7 km a.m.s.l. The plume then moves northwest of Hudson Bay and reaches Baffin Sea on 12 May. It then crosses northern Greenland and goes on to cross the Greenland Sea on 13 May. A pronounced northerly flow finally brings the plume to Hammerfest, bypassing the low-pressure system located off Norway and responsible for the plume curvature. Elevated smoke aerosols are identified by CALIOP over the Baffin Sea and Greenland Sea as shown in Fig. 14b and c, respectively.
We observed a similar transport of biomass burning aerosol over the Mediterranean Sea, leading to a BER of 0.025 sr−1 (LR ∼40 sr) (Chazette et al., 2016) higher than the one retrieved here ( sr−1, LR sr). There is no reason for a typical BER value for biomass burning aerosols. Indeed, the BER is highly dependent on the chemical composition of aerosols via the complex refractive index but also on their size distribution. Furthermore, both size distribution and chemical composition of biomass burning aerosols depend on the type of combustion and the intensity of the fire. Moreover, aerosols age during transport. Hence, a wide range of BER values is likely for biomass burning aerosol after long-range transport (Amiridis et al., 2009).
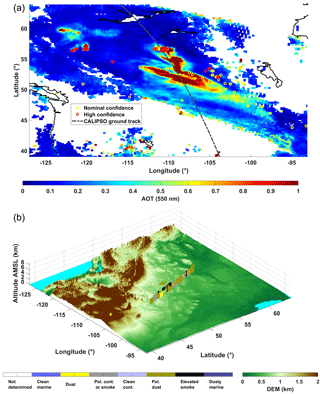
Figure 16(a) MODIS-derived aerosol optical thickness (AOT) at 550 nm and thermal anomalies on 15 May 2016; (b) CALIOP-derived aerosol typing (orbit 2016-05-15T19-42-56ZD). The CALIPSO ground track is indicated in (a).
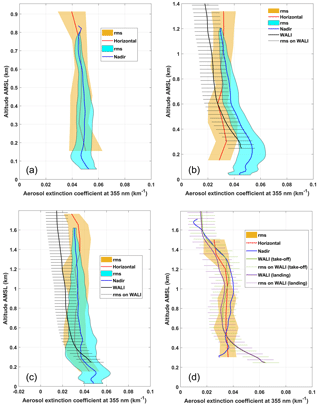
Figure 17Vertical profiles of the AEC derived from the airborne and ground-based lidars for times corresponding to (a) flight 4, (b) flights 10 and 11, and (d) flight 13.
5.2 Aerosol plume on 20–21 May
As for the previous aerosol plume, the origin seems to be from Canada. The back trajectories show potential contributions from Russia, but checking the space-borne observations corresponding with the potential plume location, we do not identify any forest fires or anthropogenic emissions. The Canadian origin could not be clearly established from MODIS observation due to strong cloud cover. A large plume (AOT > 0.8) is found over the St. Lawrence region on 12 May (Fig. 15a) and corresponds to the transport of air masses along the back trajectories. Continuing the back trajectories, the Fort McMurray area, where forest fires have persisted, also appears to be the main source. An orbit of CALIPSO passes over the eastern part of the plume on 12 May and shows that it is mainly composed of elevated smoke aerosols from Canada (Fig. 15b). The BER that has been found (0.012 sr−1, LR ∼73 sr) can also be attributed to biomass burning aerosols. However, given the possible values, it is not a criterion.
5.3 Aerosol plume on 22–23 May
The origin of this last aerosol plume is more easily identified to be Canada, also in the area of Fort McMurray, on 15 May. The aerosol plume emitted by the forest fires is well circumscribed by MODIS with AOTs greater than 1 (Fig. 16a). The locations of the fires are also indicated by the thermal anomaly. The CALIPSO orbit passes just above the plume and offers the possibility to characterize the aerosols as elevated smoke, polluted continental particles, or smoke and polluted dust (Fig. 16b). As for the aerosol plume on 20–21 May, the same remark can be made for the derived BER of 0.013 sr−1 (LR ∼77 sr).
6.1 Coherence on the vertical profiles
For higher altitude aerosol layers, we do not have any airborne observations to check the consistency of the results with the lidar embedded on the ULA. Nonetheless, we have that possibility for the lower troposphere. Figure 17 shows the comparison between different approaches to retrieve the AEC vertical profile within the first 2 km of the atmosphere. Horizontal and nadir line-of-sight measurements performed from the ULA are compared for the four flights considered. We consider the closer 10 nadir profiles from the location of the spiral ascent (or descent). In all the cases, the AEC profiles derived from the different approaches are all in agreement within 0.01 km−1 of uncertainty.
On 16 May, ground-based lidar data are not available due to low cloud cover. For the three other days, the 20 profiles closer in time to the airborne lidar profiles are considered. They are plotted with a solid line, together with their error bars in Fig. 17b–d. For flights 10 and 11 a slight underestimation is noted, but error bars overlap (within ∼0.01 km−1). The WALI-derived AEC profile is a better match with the ones derived from the airborne lidar for flight 13, except in the PBL where they highlight a larger AEC. Such a discrepancy may be due to the fact that measurements from the ULA were mainly preformed over the ocean (Fig. 11a). Note that the AEC profile derived from nadir measurement is not drawn with its RMS to lighten the figure, knowing that it is like that of other flights.
6.2 Coherence on the aerosol optical thickness
Lidar-derived AOTs are checked against a SOLAR Light® Microtops II manual sun photometer. The measurements were performed in clear-sky conditions during the three observation periods presented in Table 3. Measurements have not been continuous since they have been carried out alternatively with lidar observations. On 13 and 14 May, mean AOT at 355 nm of 0.059±0.005 is derived and matches very well the value retrieved from lidar measurement outside the upper aerosol plume. In the same conditions, we report AOTs of 0.084 ± 0.005 and 0.073 ± 0.005 on 19 and 20 May, respectively. Note that manual solar targeting induces an additional non-systematic bias, which leads to an absolute uncertainty assessed to be of the order of 0.03 when comparing with simultaneous measurements by an automated sun photometer before the field campaign.
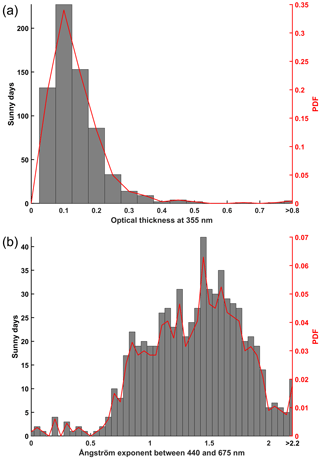
We note a low background AOT over Hammerfest, which is between 0.06 and 0.08 at 355 nm ( at 550 nm). Such a value appears to match the one derived from the available MODIS data leading to during the entire field campaign. To consider a longer time frame, we give the histograms of AOT and Ångström exponent from 2008 to 2016 for the closer AERONET station of Andenes (69∘ N 16∘ E, ∼320 km southwest of Hammerfest) in Fig. 18. The mean AOT at 355 nm is lower than 0.1 with a standard deviation of ∼0.5. The Ångström exponent is very variable, mainly between 0.5 and 2, due to long-range-transport aerosol (anthropogenic pollution, biomass burning, and Saharan dust) originating in central and eastern Europe (Rodríguez et al., 2012). Note that the Ångström exponent derived from the manual sun photometer is between 1.2 and 1.7, when considering the wavelengths of 380 and 500 nm.
This work sheds light on the abundance of aerosols in late spring over the European Arctic. During the PARCS field campaign, from 13 to 26 May 2016, we collected an original dataset of remote-sensing measurements performed with ground-based and airborne (ULA) lidars. We evidenced three cases of aerosol long-range transport over 2 weeks, originating from the Fort McMurray area, where strong forest fires occurred. They followed different pathways to reach northern Norway, but they significantly increased the AOT by a factor of up to ∼2. The AOT was enhanced from a background value of ∼0.08 (∼0.05), if not less, to ∼0.2 (0.12) at the wavelength of 355 nm (550 nm). This may imply a strong influence of long range transport of biomass burning aerosols on the radiative budget over the Arctic area.
In the lower troposphere, below 3 km a.m.s.l., the aerosol load is weak and corresponds to the previously observed background value. In Hammerfest, airborne lidar measurements have shown a strong homogeneity of the PBL. The main causes inducing a heterogeneity are (i) the marine aerosol production, which is a function of the surface wind speed, (ii) the advection of northern air masses from industrial sites in Russia (Murmansk region), and (iii) the contribution of the Melkøya facility flares. We noted a very local effect of the active low-pressure flare, with an enhancement close to 0.02 of the AOT at 355 nm. The effect on the environment therefore appears to be weak. Because this plant is rather isolated, extending the conclusions to larger oil and gas rigs like those identified in Fig. 1 is hardly possible and would be purely speculative.
From an experimental perspective, the coupling between ground-based and airborne lidar measurements proved to be essential for data analysis. The lidar systems are complementary and the coupled approach allows confirmation of the results. With ULA flights, however, we remain in the vicinity of the ground station and flights with larger carriers would be more suited to the regional scale. Nevertheless, one would lose in flexibility of execution and in repetitiveness of measurement, inevitably limited by the cost of the flights.
Data from the PARCS Hammerfest campaign can be downloaded from the https://www4.obs-mip.fr/parcs/database/ database upon request to the first author of the paper.
PC conceived, managed, and participated in the experiment, analysed the Raman lidar data, developed the algorithm, and wrote the paper; JCR conceived and performed the experiment, computed the back trajectories, and participated in the paper editing; JT performed the experiment and participated in the paper editing.
The authors declare that they have no conflict of interest.
This work was supported by the French Institut National de l'Univers (INSU) of the Centre National de la Recherche Scientifique (CNRS) via the French Arctic Initiative. The Commissariat á l'Energie Atomique et aux énergies alternatives (CEA) is acknowledged for its support. We thank Yoann Chazette, Nathalie Toussaint, and Sébastien Blanchon for their help during the field experiment. The ULA flights were performed by Franck Toussaint. The Avinor crew of Hammerfest Airport, represented by Hans-Petter Nergård, and the company Air Création company are acknowledged for their hospitality. Kathy Law is acknowledged for securing the funding of the Pollution in the ARCtic System campaign. Support for computer modelling was provided by Tatsuo Onishi, allowing access to the HPC resources of IDRIS under the allocation A001017141 made by GENCI and to the IPSL mesoscale computing centre (CICLAD: Calcul Intensif pour le Climat, l'Atmosphère et la Dynamique).
The authors acknowledge the MODIS science, processing and data support teams
for producing and providing MODIS data (at
https://modis.gsfc.nasa.gov/data/dataprod/) and the NASA Langley
Research Center Atmospheric Sciences Data Center for the data processing and
distribution of CALIPSO products (level 4.10, at
https://eosweb.larc.nasa.gov/HORDERBIN/HTML_Start.cgi). The authors
would like to thank the AERONET network for sun photometer products (at
https://aeronet.gsfc.nasa.gov/).
Edited
by: Farahnaz Khosrawi
Reviewed by: three anonymous referees
Amiridis, V., Balis, D. S., Giannakaki, E., Stohl, A., Kazadzis, S., Koukouli, M. E., and Zanis, P.: Optical characteristics of biomass burning aerosols over Southeastern Europe determined from UV-Raman lidar measurements, Atmos. Chem. Phys., 9, 2431–2440, https://doi.org/10.5194/acp-9-2431-2009, 2009.
Ancellet, G., Pelon, J., Blanchard, Y., Quennehen, B., Bazureau, A., Law, K. S., and Schwarzenboeck, A.: Transport of aerosol to the Arctic: analysis of CALIOP and French aircraft data during the spring 2008 POLARCAT campaign, Atmos. Chem. Phys., 14, 8235-8254, https://doi.org/10.5194/acp-14-8235-2014, 2014.
Ancellet, G., Pelon, J., Totems, J., Chazette, P., Bazureau, A., Sicard, M., Di Iorio, T., Dulac, F., and Mallet, M.: Long-range transport and mixing of aerosol sources during the 2013 North American biomass burning episode: analysis of multiple lidar observations in the western Mediterranean basin, Atmos. Chem. Phys., 16, 4725–4742, https://doi.org/10.5194/acp-16-4725-2016, 2016.
Barrie, L. A.: Arctic air pollution: An overview of current knowledge, Atmos. Environ., 20, 643–663, https://doi.org/10.1016/0004-6981(86)90180-0, 1986.
Berg, L. K., Gustafson, W. I., Kassianov, E. I., and Deng, L.: Evaluation of a Modified Scheme for Shallow Convection: Implementation of CuP and Case Studies, Mon. Weather Rev., 141, 134–147, https://doi.org/10.1175/MWR-D-12-00136.1, 2013.
Blanchard, D. C. and Woodcock, A. H.: The production, concentration, and vertical distribution of the sea-salt aerosols, Ann. NY Acad. Sci., 338, 330–347, https://doi.org/10.1111/j.1749-6632.1980.tb17130.x, 1980.
Bodhaine, B. A., Wood, N. B., Dutton, E. G., and Slusser, J. R.: On Rayleigh optical depth calculations, J. Atmos. Ocean. Tech., 16, 1854–1861, https://doi.org/10.1175/1520-0426(1999)016<1854:ORODC>2.0.CO;2, 1999.
Breider, T. J., Mickley, L. J., Jacob, D. J., Wang, Q., Fisher, J. A., Chang, R. Y. W., and Alexander, B.: Annual distributions and sources of Arctic aerosol components, aerosol optical depth, and aerosol absorption, J. Geophys. Res., 119, 4107–4124, https://doi.org/10.1002/2013JD020996, 2014.
Brioude, J., Arnold, D., Stohl, A., Cassiani, M., Morton, D., Seibert, P., Angevine, W., Evan, S., Dingwell, A., Fast, J. D., Easter, R. C., Pisso, I., Burkhart, J., and Wotawa, G.: The Lagrangian particle dispersion model FLEXPART-WRF version 3.1, Geosci. Model Dev., 6, 1889–1904, https://doi.org/10.5194/gmd-6-1889-2013, 2013.
Brock, C. A., Cozic, J., Bahreini, R., Froyd, K. D., Middlebrook, A. M., McComiskey, A., Brioude, J., Cooper, O. R., Stohl, A., Aikin, K. C., de Gouw, J. A., Fahey, D. W., Ferrare, R. A., Gao, R.-S., Gore, W., Holloway, J. S., Hübler, G., Jefferson, A., Lack, D. A., Lance, S., Moore, R. H., Murphy, D. M., Nenes, A., Novelli, P. C., Nowak, J. B., Ogren, J. A., Peischl, J., Pierce, R. B., Pilewskie, P., Quinn, P. K., Ryerson, T. B., Schmidt, K. S., Schwarz, J. P., Sodemann, H., Spackman, J. R., Stark, H., Thomson, D. S., Thornberry, T., Veres, P., Watts, L. A., Warneke, C., and Wollny, A. G.: Characteristics, sources, and transport of aerosols measured in spring 2008 during the aerosol, radiation, and cloud processes affecting Arctic Climate (ARCPAC) Project, Atmos. Chem. Phys., 11, 2423–2453, https://doi.org/10.5194/acp-11-2423-2011, 2011.
Burton, S. P., Hair, J. W., Kahnert, M., Ferrare, R. A., Hostetler, C. A., Cook, A. L., Harper, D. B., Berkoff, T. A., Seaman, S. T., Collins, J. E., Fenn, M. A., and Rogers, R. R.: Observations of the spectral dependence of linear particle depolarization ratio of aerosols using NASA Langley airborne High Spectral Resolution Lidar, Atmos. Chem. Phys., 15, 13453–13473, https://doi.org/10.5194/acp-15-13453-2015, 2015.
Chazette, P. and Totems, J.: Mini N2-Raman Lidar onboard ultra-light aircraft for aerosol measurements: Demonstration and extrapolation, Remote Sens., 9, 1226, https://doi.org/10.3390/rs9121226, 2017.
Chazette, P., Dabas, A., Sanak, J., Lardier, M., and Royer, P.: French airborne lidar measurements for Eyjafjallajökull ash plume survey, Atmos. Chem. Phys., 12, 7059–7072, https://doi.org/10.5194/acp-12-7059-2012, 2012.
Chazette, P., Marnas, F., and Totems, J.: The mobile Water vapor Aerosol Raman LIdar and its implication in the framework of the HyMeX and ChArMEx programs: application to a dust transport process, Atmos. Meas. Tech., 7, 1629–1647, https://doi.org/10.5194/amt-7-1629-2014, 2014.
Chazette, P., Totems, J., Ancellet, G., Pelon, J., and Sicard, M.: Temporal consistency of lidar observations during aerosol transport events in the framework of the ChArMEx/ADRIMED campaign at Minorca in June 2013, Atmos. Chem. Phys., 16, 2863–2875, https://doi.org/10.5194/acp-16-2863-2016, 2016.
Chazette, P., Totems, J., and Shang, X.: Atmospheric aerosol variability above the Paris Area during the 2015 heat wave –Comparison with the 2003 and 2006 heat waves, Atmos. Environ., 170, 216–233, https://doi.org/10.1016/j.atmosenv.2017.09.055, 2017.
Chen, F. and Dudhia, J.: Coupling an Advanced Land Surface – Hydrology Model with the Penn State – NCAR MM5 Modeling System – Part I: Model Implementation and Sensitivity, Mon. Weather Rev., 569–585, https://doi.org/10.1175/1520-0493(2001)129<0569:caalsh>2.0.co;2, 2001.
Chu, D. A., Kaufman, Y. J., Ichoku, C., Remer, L. A., Tanré, D., and Holben, B. N.: Validation of MODIS aerosol optical depth retrieval over land, Geophys. Res. Lett., 29, 8007, https://doi.org/10.1029/2001GL013205, 2002.
Dee, D. P., Uppala, S. M., Simmons, A. J., Berrisford, P., Poli, P., Kobayashi, S., Andrae, U., Balmaseda, M. A., Balsamo, G., Bauer, P., Bechtold, P., Beljaars, A. C. M., van de Berg, I., Biblot, J., Bormann, N., Delsol, C., Dragani, R., Fuentes, M., Greer, A. J., Haimberger, L., Healy, S. B., Hersbach, H., Holm, E. V., Isaksen, L., Kallberg, P., Kohler, M., Matricardi, M., McNally, A. P., Mong-Sanz, B. M., Morcette, J.-J., Park, B.-K., Peubey, C., de Rosnay, P., Tavolato, C., Thepaut, J. N., and Vitart, F.: The ERA-Interim reanalysis: Configuration and performance of the data assimilation system, Q. J. Roy. Meteorol. Soc., 137, 553–597, https://doi.org/10.1002/qj.828, 2011.
Dieudonné, E., Chazette, P., Marnas, F., Totems, J., and Shang, X.: Raman Lidar Observations of Aerosol Optical Properties in 11 Cities from France to Siberia, Remote Sens., 9, 978, https://doi.org/10.3390/rs9100978, 2017.
Elvidge, C. D., Zhizhin, M., Baugh, K., Hsu, F. C., and Ghosh, T.: Methods for global survey of natural gas flaring from visible infrared imaging radiometer suite data, Energies, 9, 14, https://doi.org/10.3390/en9010014, 2016.
Flamant, C., Pelon, J., Chazette, P., and Trouillet, V.: Marine aerosol vertical distribution retrieval using airborne backscatter lidar measurements, J. Aerosol Sci., 29, 330–347, https://doi.org/10.1111/j.1749-6632.1980.tb17130.x, 1998a.
Flamant, C., Trouillet, V., Chazette, P., and Pelon, J.: Wind speed dependence of atmospheric boundary layer optical properties and ocean surface reflectance as observed by airborne backscatter lidar, J. Geophys. Res.-Oceans, 103, 25137–25158, https://doi.org/10.1029/98JC02284, 1998b.
Formenti, P., Boucher, O., Reiner, T., Sprung, D., Andreae, M. O., Wendisch, M., Wex, H., Kindred, D., Tzortziou, M., Vasaras, A., and Zerefos, C.: STAAARTE-MED 1998 summer airborne measurements over the Aegean Sea 2. Aerosol scattering and absorption, and radiative calculations, J. Geophys. Res., 107, 4551, https://doi.org/10.1029/2001JD001536, 2002.
Forster, C., Wandinger, U., Wotawa, G., James, P., Mattis, I., Althausen, D., Simmonds, P., O'Doherty, S., Jennings, S. G., Kleefeld, C., Schneider, J., Trickl, T., Kreipl, S., Jäger, H., and Stohl, A.: Transport of boreal forest fire emissions from Canada to Europe, J. Geophys. Res., 106, 22887, https://doi.org/10.1029/2001JD900115, 2001.
Franklin, J. E., Drummond, J. R., Griffin, D., Pierce, J. R., Waugh, D. L., Palmer, P. I., Parrington, M., Lee, J. D., Lewis, A. C., Rickard, A. R., Taylor, J. W., Allan, J. D., Coe, H., Walker, K. A., Chisholm, L., Duck, T. J., Hopper, J. T., Blanchard, Y., Gibson, M. D., Curry, K. R., Sakamoto, K. M., Lesins, G., Dan, L., Kliever, J., and Saha, A.: A case study of aerosol scavenging in a biomass burning plume over eastern Canada during the 2011 BORTAS field experiment, Atmos. Chem. Phys., 14, 8449–8460, https://doi.org/10.5194/acp-14-8449-2014, 2014.
Fromm, M., Bevilacqua, R., Servranckx, R., Rosen, J., Thayer, J. P., Herman, J., and Larko, D.: Pyro-cumulonimbus injection of smoke to the stratosphere: Observations and impact of a super blowup in northwestern Canada on 3–4 August 1998, J. Geophys. Res., 110, D08205, https://doi.org/10.1029/2004JD005350, 2005.
Hu, S. and Fedorov, A. V.: The extreme El Niño of 2015–2016 and the end of global warming hiatus, Geophys. Res. Lett., 44, 3816–3824, https://doi.org/10.1002/2017GL072908, 2017.
Iacono, M. J., Delamere, J. S., Mlawer, E. J., Shephard, M. W., Clough, S. A., and Collins, W. D.: Radiative forcing by long-lived greenhouse gases: Calculations with the AER radiative transfer models, J. Geophys. Res.-Atmos., 113, 1–8, https://doi.org/10.1029/2008JD009944, 2008.
IPCC: Climate Change 2014: Impacts, Adaptation, and Vulnerability. Part A: Global and Sectoral Aspects, Contribution of Working Group II to the Fifth Assessment Report of the Intergovernmental Panel on Climate Change, edited by: Field, C. B., Barros, V. R., Dokken, D. J., Mach, K. J., Mastrandresa, M. D., Bilir, T. E., Chatterjee, M., Ebi, K. L., Estrada, Y. O., Genova, R. C., Girma, B., Kissel, E. S., Levy, A. N., MacCracken, S., Mastrandrea, P. R., and White, L. L., Cambridge University Press, Cambridge, UK, New York, NY, 2014.
Jacob, D. J., Crawford, J. H., Maring, H., Clarke, A. D., Dibb, J. E., Emmons, L. K., Ferrare, R. A., Hostetler, C. A., Russell, P. B., Singh, H. B., Thompson, A. M., Shaw, G. E., McCauley, E., Pederson, J. R., and Fisher, J. A.: The Arctic Research of the Composition of the Troposphere from Aircraft and Satellites (ARCTAS) mission: design, execution, and first results, Atmos. Chem. Phys., 10, 5191–5212, https://doi.org/10.5194/acp-10-5191-2010, 2010.
Janjić, Z. I.: The Step-Mountain Eta Coordinate Model: Further Developments of the Convection, Viscous Sublayer, and Turbulence Closure Schemes, Mon. Weather Rev., 122, 927–945, https://doi.org/10.1175/1520-0493(1994)122<0927:TSMECM>2.0.CO;2, 1994.
King, M. D., Kaufman, Y. J., Menzel, W. P. and Tanré, D.: Remote Sensing of Cloud, Aerosol, and Water Vapor Properties from the Moderate Resolution Imaging Spectrometer (MODIS), IEEE Trans. Geosci. Remote Sens., 30, 2–27, https://doi.org/10.1109/36.124212, 1992.
Kochtubajda, C., Brimelow, J., Flannigan, M., Morrow, B., and Greenhough, M. D.: The extreme 2016 wildfire in fort McMurrray, B. Am. Meteorol. Soc., 98, S176–S177, 2017.
Landis, M. S., Edgerton, E. S., White, E. M., Wentworth, G. R., Sullivan, A. P., and Dillner, A. M.: The impact of the 2016 Fort McMurray Horse River Wildfire on ambient air pollution levels in the Athabasca Oil Sands Region, Alberta, Canada, Sci. Total Environ., 618, 1665–1676, https://doi.org/10.1016/j.scitotenv.2017.10.008, 2018.
Law, K. S., Roiger, A., Thomas, J. L., Marelle, L., Raut, J. C., Dalsøren, S., Fuglestvedt, J., Tuccella, P., Weinzierl, B., and Schlager, H.: Local Arctic air pollution: Sources and impacts, Ambio, 46, 453–463, https://doi.org/10.1007/s13280-017-0962-2, 2017.
Marelle, L., Raut, J.-C., Thomas, J. L., Law, K. S., Quennehen, B., Ancellet, G., Pelon, J., Schwarzenboeck, A., and Fast, J. D.: Transport of anthropogenic and biomass burning aerosols from Europe to the Arctic during spring 2008, Atmos. Chem. Phys., 15, 3831–3850, https://doi.org/10.5194/acp-15-3831-2015, 2015.
Marelle, L., Raut, J.-C., Law, K. S., Berg, L. K., Fast, J. D., Easter, R. C., Shrivastava, M., and Thomas, J. L.: Improvements to the WRF-Chem 3.5.1 model for quasi-hemispheric simulations of aerosols and ozone in the Arctic, Geosci. Model Dev., 10, 3661–3677, https://doi.org/10.5194/gmd-10-3661-2017, 2017.
Morrison, H., Thompson, G., and Tatarskii, V.: Impact of Cloud Microphysics on the Development of Trailing Stratiform Precipitation in a Simulated Squall Line: Comparison of One- and Two-Moment Schemes, Mon. Weather Rev., 137, 991–1007, https://doi.org/10.1175/2008MWR2556.1, 2009.
Paris, J.-D., Stohl, A., Nédélec, P., Arshinov, M. Yu., Panchenko, M. V., Shmargunov, V. P., Law, K. S., Belan, B. D., and Ciais, P.: Wildfire smoke in the Siberian Arctic in summer: source characterization and plume evolution from airborne measurements, Atmos. Chem. Phys., 9, 9315–9327, https://doi.org/10.5194/acp-9-9315-2009, 2009.
Peterson, D. A., Hyer, E. J., Campbell, J. R., Fromm, M. D., Hair, J. W., Butler, C. F., and Fenn, M. A.: The 2013 Rim Fire: Implications for predicting extreme fire spread, pyroconvection, smoke emissions, B. Am. Meteorol. Soc., 96, 229–247, https://doi.org/10.1175/BAMS-D-14-00060.1, 2015.
Quennehen, B., Schwarzenboeck, A., Schmale, J., Schneider, J., Sodemann, H., Stohl, A., Ancellet, G., Crumeyrolle, S., and Law, K. S.: Physical and chemical properties of pollution aerosol particles transported from North America to Greenland as measured during the POLARCAT summer campaign, Atmos. Chem. Phys., 11, 10947–10963, https://doi.org/10.5194/acp-11-10947-2011, 2011.
Quinn, P. K., Bates, T. S., Baum, E., Doubleday, N., Fiore, A. M., Flanner, M., Fridlind, A., Garrett, T. J., Koch, D., Menon, S., Shindell, D., Stohl, A., and Warren, S. G.: Short-lived pollutants in the Arctic: their climate impact and possible mitigation strategies, Atmos. Chem. Phys., 8, 1723–1735, https://doi.org/10.5194/acp-8-1723-2008, 2008.
Randriamiarisoa, H., Chazette, P., Couvert, P., Sanak, J., and Mégie, G.: Relative humidity impact on aerosol parameters in a Paris suburban area, Atmos. Chem. Phys., 6, 1389–1407, https://doi.org/10.5194/acp-6-1389-2006, 2006.
Raut, J.-C. and Chazette, P.: Assessment of vertically-resolved PM10 from mobile lidar observations, Atmos. Chem. Phys., 9, 8617–8638, https://doi.org/10.5194/acp-9-8617-2009, 2009.
Raut, J.-C., Marelle, L., Fast, J. D., Thomas, J. L., Weinzierl, B., Law, K. S., Berg, L. K., Roiger, A., Easter, R. C., Heimerl, K., Onishi, T., Delanoë, J., and Schlager, H.: Cross–polar transport and scavenging of Siberian aerosols containing black carbon during the 2012 ACCESS summer campaign, Atmos. Chem. Phys., 17, 10969–10995, https://doi.org/10.5194/acp-17-10969-2017, 2017.
Rodríguez, E., Toledano, C., Cachorro, V. E., Ortiz, P., Stebel, K., Berjón, A., Blindheim, S., Gausa, M., and de Frutos, A. M.: Aerosol characterization at the sub-Arctic site Andenes (69∘ N, 16∘ E), by the analysis of columnar optical properties, Q. J. Roy. Meteorol. Soc., 138, 471–482, https://doi.org/10.1002/qj.921, 2012.
Roiger, A., Thomas, J. L., Schlager, H., Law, K. S., Kim, J., Schäfler, A., Weinzierl, B., Dahlkötter, F., Risch, I. K., Marelle, L., Minikin, A., Raut, J. C., Reiter, A., Rose, M., Scheibe, M., Stock, P., Baumann, R., Bouarar, I., Lerbaux, C. C., George, M., Onishi, T., and Flemming, A. J.: Quantifying emerging local anthropogenic emissions in the arctic region: The access aircraft campaign experiment, B. Am. Meteorol. Soc., 96, 441–460, https://doi.org/10.1175/BAMS-D-13-00169.1, 2015.
Salmonson, V. V., Barnes, W. L. L., Maymon, P. W. P. W. P. W., Montgomery, H. E. H. E., Ostrow, H., Salomonson, V. V, Barnes, W. L. L., Maymon, P. W. P. W. P. W., Montgomery, H. E. H. E., and Ostrow, H.: MODIS: Advanced Facility Instrument for Studies of the Earth as a System, IEEE T. Geosci. Remote Sens., 27, 145–153, https://doi.org/10.1109/36.20292, 1989.
Schmale, J., Schneider, J., Ancellet, G., Quennehen, B., Stohl, A., Sodemann, H., Burkhart, J. F., Hamburger, T., Arnold, S. R., Schwarzenboeck, A., Borrmann, S., and Law, K. S.: Source identification and airborne chemical characterisation of aerosol pollution from long-range transport over Greenland during POLARCAT summer campaign 2008, Atmos. Chem. Phys., 11, 10097–10123, https://doi.org/10.5194/acp-11-10097-2011, 2011.
Shaw, G. E.: The Arctic Haze Phenomenon, B. Am. Meteorol. Soc., 76, 2403–2413, https://doi.org/10.1175/1520-0477(1995)076<2403:TAHP>2.0.CO;2, 1995.
Sitnov, S. A. and Mokhov, I. I.: Anomalous transboundary transport of the products of biomass burning from North American wildfires to Northern Eurasia, Dokl. Earth Sci., 475, 832–835, https://doi.org/10.1134/S1028334X17070261, 2017.
Skamarock, W., Klemp, J., Dudhia, J., Gill, D., Barker, D., Wang, W., Huang, X., and Duda, M.: A Description of the Advanced Research WRF Version 3, NCAR Technical Note NCAR/TN-475+STR, https://doi.org/10.5065/D68S4MVH, 2008.
Stohl, A., Forster, C., Frank, A., Seibert, P., and Wotawa, G.: Technical note: The Lagrangian particle dispersion model FLEXPART version 6.2, Atmos. Chem. Phys., 5, 2461–2474, https://doi.org/10.5194/acp-5-2461-2005, 2005.
Taylor, J. W., Allan, J. D., Allen, G., Coe, H., Williams, P. I., Flynn, M. J., Le Breton, M., Muller, J. B. A., Percival, C. J., Oram, D., Forster, G., Lee, J. D., Rickard, A. R., Parrington, M., and Palmer, P. I.: Size-dependent wet removal of black carbon in Canadian biomass burning plumes, Atmos. Chem. Phys., 14, 13755–13771, https://doi.org/10.5194/acp-14-13755-2014, 2014.
Thomas, J. L., Raut, J.-C., Law, K. S., Marelle, L., Ancellet, G., Ravetta, F., Fast, J. D., Pfister, G., Emmons, L. K., Diskin, G. S., Weinheimer, A., Roiger, A., and Schlager, H.: Pollution transport from North America to Greenland during summer 2008, Atmos. Chem. Phys., 13, 3825–3848, https://doi.org/10.5194/acp-13-3825-2013, 2013.
Vaughan, G., Draude, A. P., Ricketts, H. M. A., Schultz, D. M., Adam, M., Sugier, J., and Wareing, D. P.: Transport of Canadian forest fire smoke over the UK as observed by lidar, Atmos. Chem. Phys., 18, 11375–11388, https://doi.org/10.5194/acp-18-11375-2018, 2018.
Warneke, C., Froyd, K. D., Brioude, J., Bahreini, R., Brock, C. A., Cozic, J., De Gouw, J. A., Fahey, D. W., Ferrare, R., Holloway, J. S., Middlebrook, A. M., Miller, L., Montzka, S., Schwarz, J. P., Sodemann, H., Spackman, J. R., and Stohl, A.: An important contribution to springtime Arctic aerosol from biomass burning in Russia, Geophys. Res. Lett., 37, L01801, https://doi.org/10.1029/2009GL041816, 2010.
Winker, D. M., Pelon, J., Mccormick, M. P., Pierre, U., and Jussieu, P.: The CALIPSO mission?: Spaceborne lidar for observation of aerosols and clouds, Proc. SPIE, 4893, 1–11, https://doi.org/10.1117/12.466539, 2003.
Winker, D. M., Hunt, W. H., and McGill, M. J.: Initial performance assessment of CALIOP, Geophys. Res. Lett., 34, L19803, https://doi.org/10.1029/2007GL030135, 2007.
Yang, Q., Bitz, C. M., and Doherty, S. J.: Offsetting effects of aerosols on Arctic and global climate in the late 20th century, Atmos. Chem. Phys., 14, 3969–3975, https://doi.org/10.5194/acp-14-3969-2014, 2014.


