the Creative Commons Attribution 4.0 License.
the Creative Commons Attribution 4.0 License.
Source regions contributing to excess reactive nitrogen deposition in the Greater Yellowstone Area (GYA) of the United States
Rui Zhang
Tammy M. Thompson
Michael G. Barna
Jennifer L. Hand
Jill A. McMurray
Michael D. Bell
William C. Malm
Bret A. Schichtel
Research has shown that excess reactive nitrogen (Nr) deposition in the Greater Yellowstone Area (GYA) of the United States has passed critical load (CL) thresholds and is adversely affecting sensitive ecosystems in this area. To better understand the sources causing excess Nr deposition, the Comprehensive Air Quality Model with Extensions (CAMx), using Western Air Quality Study (WAQS) emission and meteorology inputs, was used to simulate Nr deposition in the GYA. CAMx's Particulate Source Apportionment Technology (PSAT) was employed to estimate contributions from agriculture (AG), oil and gas (OG), fire (Fire), and other (Other) source sectors from 27 regions, including the model boundary conditions (BCs) to the simulated Nr for 2011. The BCs were outside the conterminous United States and thought to represent international anthropogenic and natural contributions. Emissions from the AG and Other source sectors are predominantly from reduced N and oxidized N compounds, respectively. The model evaluation revealed a systematic underestimation in ammonia (NH3) concentrations by 65 % and overestimation in nitric acid concentrations by 108 %. The measured inorganic N wet deposition at National Trends Network sites in the GYA was overestimated by 31 %–49 %, due at least partially to an overestimation of precipitation. These uncertainties appear to result in an overestimation of distant source regions including California and BCs and an underestimation of closer agricultural source regions including the Snake River valley. Due to these large uncertainties, the relative contributions from the modeled sources and their general patterns are the most reliable results. Source apportionment results showed that the AG sector was the single largest contributor to the GYA total Nr deposition, contributing 34 % on an annual basis. A total of 74 % of the AG contributions originated from the Idaho Snake River valley, with Wyoming, California, and northern Utah contributing another 7 %, 5 %, and 4 %, respectively. Contributions from the OG sector were small at about 1 % over the GYA, except in the southern Wind River Mountain Range during winter where they accounted for more than 10 %, with 46 % of these contributions coming from OG activities in Wyoming. Wild and prescribed fires contributed 18 % of the total Nr deposition, with fires within the GYA having the highest impact. The Other source category was the largest winter contributor (44 %) with high contributions from California, Wyoming, and northern Utah.
- Article
(3328 KB) - Full-text XML
-
Supplement
(2719 KB) - BibTeX
- EndNote
The Greater Yellowstone Area (GYA) (see Fig. 1) of the United States, with Yellowstone National Park (YNP) and Grand Teton National Park (GTNP) at its core, is one of the largest remaining intact ecosystems in the northern temperate zone and features diverse wildlife, alpine lakes, forests, and geologic wonders (Keiter and Boyce, 1994; NPS, 2017). Increasing concentrations of reactive nitrogen (Nr) compounds in air, rain, and snowpack samples over the GYA have been reported in the past 30 years and linked to Nr emissions from human activities (Clow et al., 2003; Blett et al., 2011; IMPROVE, 2011; Sullivan et al., 2011; USGS, 2014; NADP, 2016; Nanus et al., 2017; also, see Fig. S1). The inorganic wet Nr deposition rates measured at high-elevation National Trends Network (NTN) sites within the GYA in 2010 were 2.5–3.5 kg N ha−1 yr−1, compared with 1.5–2.5 kg N ha−1 yr−1 in 2000 (NADP, 2016). This is relevant to the long-term conservation of the area because as Nr deposition levels increase, they can cross critical load (CL) thresholds, at which negative effects to sensitive ecosystem components can occur (Porter et al., 2005; Pardo et al., 2011). Additional concerns posed by enhanced Nr deposition include lake acidification, loss of lichen biodiversity, and eutrophication (Baron, 2006; Blett et al., 2011; NADP, 2016). While ecosystem changes due to excess Nr deposition over Class I areas including the GYA have been documented (e.g., Baron et al., 2011; Saros et al., 2011; Sullivan et al., 2011; Spaulding et al., 2015; Nanus et al., 2017), the origins, chemical composition, and spatial and temporal changes in the deposition over this region are not as well understood.
Total Nr is a mix of oxidized and reduced inorganic nitrogen (N) and organic N compounds that are chemically and biologically active in the Earth's biosphere and atmosphere and deposited through wet and dry processes. These compounds arise from a variety of sources, with inorganic oxidized N primarily emitted as nitrogen oxides (NOx) from fossil fuel combustion, with approximately 25 % from power plants, 50 % from automobiles, and 10 % from other mobile sources, based on annual county-level estimations (EPA, 2015a). Atmospheric reactions of NOx result in nitric acid (HNO3), particulate nitrate (PNO3), and other compounds. Reduced N arises primarily from ammonia (NH3) gas emissions from agricultural activities, which can react with acidic aerosols to form ammonium () compounds (Galloway et al., 2004). Mobile sources are also an important source of NH3 and can be the primary emitter in urban areas (Sun et al., 2014, 2017). Emissions from this sector have large uncertainties and a recent study suggests that on-road NH3 emissions in the 2011 National Emissions Inventory (NEI) were underestimated by a factor of 2.9 (Fenn et al., 2018). There are hundreds of organic N compounds, including reduced (e.g., amines) and oxidized forms (e.g., alkyl nitrates). Sources of organic N are less well known, but increasing evidence suggests that biomass burning and agriculture (AG) are significant contributors, as are atmospheric reactions of NOx with volatile organic compounds (Cape et al., 2011; Reay et al., 2012). With the steady decline of NOx emissions in the United States during past decades as a result of the implementation of the Clean Air Act, the importance of reduced N to the total N deposition budget has increased (Li et al., 2016). Specific to the GYA, local anthropogenic emissions are small, but upwind sources, including agricultural activities in the Snake River valley and northern Utah, wildfires throughout the western United States, energy development in the Upper Green River basin, and anthropogenic activities at urban centers such as Salt Lake City, are larger and likely to be significant contributors to regional N emissions (Prenni et al., 2014).
To better understand the levels and composition of the Nr compounds deposited in the GYA and to help guide strategies to reduce N deposition, the National Park Service (NPS) initiated the Grand Teton Reactive Nitrogen Deposition Study (GrandTReNDS), which included spatially and temporally detailed measurements of N compounds during April to September 2011 (Benedict et al., 2013a; Prenni et al., 2014). It was found that during summer months at the high-elevation sites (e.g., Grand Targhee; see Fig. 2), 62 % of the N deposition was from reduced N and about equally split between dry and wet deposition, and oxidized N only accounted for 27 % of the N deposition budget, with the remaining N in the form of wet-deposited, organic N. Study findings indicate a significant west-to-east gradient in atmospheric NH3 concentrations, with higher concentrations west of the Teton mountain range. Concurrently measured concentrations of HNO3, PM2.5 (particulate matter with an aerodynamic diameter of less than 2.5 µm) nitrate, and showed relatively small west-to-east gradients inside GTNP (Benedict et al., 2013a; Prenni et al., 2014).
The origins of Nr transported to the GYA and other remote locations in the western United States have been examined in past modeling studies. Back trajectory analyses have shown that air mass transport to GTNP is predominantly from the west through the Snake River valley and from the southwest through northern Utah (Prenni et al., 2014). Zhang et al. (2012) applied the global chemical transport model (CTM) GEOS-Chem (Bey et al., 2001) using zero-out sensitivity simulations and found that in 2006 natural sources, including lightning and wildfires, contributed more than 10 % of the total Nr deposition over the Teton area. Lee et al. (2016) used the adjoint version of GEOS-Chem to quantify the sources of Nr deposition in eight selected federal Class I areas in 2010 and found a nonnegligible footprint (>20 %) of Nr deposition in the western United States, including GTNP and Rocky Mountain National Park (RMNP), attributed to long-range transport from sources in California, especially during summertime. Mobile NOx and livestock NH3 were also found to be major sources of Nr deposition in GTNP. Similar modeling studies focusing on RMNP also suggested the important contributions of distant sources including those from California and other counties and the fact that the contributions from sources of reduced Nr were larger than those from sources of oxidized Nr (Thompson et al., 2015; Malm et al., 2016).
In this work, we add to the growing body of Nr modeling source apportionment studies by conducting a detailed analysis using the Particulate Source Apportionment Technology (PSAT) module within the CAMx (Comprehensive Air Quality Model with extensions) (ENVIRON, 2014) CTM to quantify the seasonal contributions from different source regions and source sectors to Nr throughout the GYA. Compared with previous Nr deposition simulation studies in United States, this work uses tagged reactive tracers to attribute the contributions from four designated emission sectors and 27 designated emission regions to Nr deposition in the GYA with a much higher horizontal grid resolution (12 km) and an up-to-date emission inventory instead of using a zero-out approach (e.g., Zhang et al., 2012) or an adjoint model (e.g., Lee et al., 2016). The model simulation of Nr and its constituents were first evaluated against routine measured data as well as the unique data measured during the GrandTReNDS campaign period (Benedict et al., 2013a; Prenni et al., 2014). Nr deposition from CAMx simulations was also compared with total deposition maps (TDEPs), which were developed for deposition trend analysis and ecological impact assessment (Schwede and Lear, 2014). The detailed source apportionment results are presented here, focusing on seasonal variations and the relative importance to CL exceedance in sensitive ecosystems within the GYA. The discussion of identified model bias and uncertainties in the interpretation of source apportionment results, including the model lateral boundary conditions, the impact of model precipitation to wet deposition simulation, and the impact of ammonium dry deposition velocity on dry deposition are also presented.
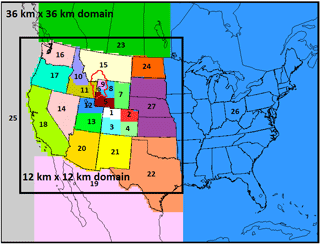
Figure 1Source region partition for CAMx PSAT simulation in this study. The 27 tagged regions are (1) NW Colorado; (2) NE Colorado; (3) SE Colorado; (4) SW Colorado; (5) Upper Green River, Wyoming; (6) Jackson, Wyoming; (7) eastern Wyoming; (8) western Wyoming; (9) Yellowstone; (10) northern Idaho; (11) Snake River valley, Idaho; (12) northern Utah; (13) southern Utah; (14) Nevada; (15) Montana; (16) Washington; (17) Oregon; (18) California; (19) Mexico; (20) New Mexico; (21) Arizona; (22) Texas & Oklahoma; (23) Canada; (24) North Dakota; (25) the Pacific; (26) the far east US; and (27) South Dakota, Kansas, and Nebraska.
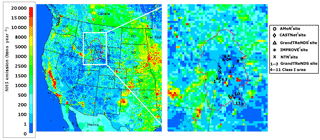
Figure 2Annual NH3 emission for the 12 km inner modeling domain at focused tagged regions (see Table S2 and Fig. 1 for the details of the 27 source region partition) as well as locations of the monitoring sites at different networks (a Ammonia Monitoring Network; b Clean Air Status and Trends Network; c Grand Teton Reactive Nitrogen Deposition Study; d Interagency Monitoring of Protected Visual Environments; e National Trends Network) used in the model performance evaluation of CAMx nitrogen species concentration and dry–wet deposition in the GYA (the black boundary line). The numbers in the figure are locations for the three sampling sites during GrandTReNDS and the eight Class I areas within the area: (1) Driggs, (2) Grand Targhee, (3) NOAA climate station, (4) Grand Teton National Park, (5) John D. Rockfeller Jr. Memorial Parkway, (6) Yellowstone National Park, (7) Teton Wilderness, (8) Washakie Wilderness, (9) North Absaroka Wilderness, (10) Fitzpatrick Wilderness, and (11) Bridger Wilderness.
Modeling simulations for 2011 were conducted using the CAMx version 6.10 (ENVIRON, 2014) with two nested grids. The outer domain (36 km) covered the contiguous United States (CONUS), as well as portions of Canada and Mexico, while the inner domain (12 km) encompassed the western United States and focused on states within the Western Regional Air Partnership (WRAP) (see Fig. 1).
The hourly meteorological inputs for 2011 were generated by the Weather Research and Forecasting (WRF) model (WRF-ARW, version 3.5.1) (Skamarock et al., 2008) and were obtained from the Intermountain West Data Warehouse (IWDW) (http://views.cira.colostate.edu/tsdw/, last access: 30 August 2018). This meteorological simulation performed in comparison to other recent prognostic model applications used in air quality planning (UNC-Chapel Hill and ENVIRON, 2014a).
The emission inventory used by CAMx was primarily derived from the 2011 NEI version 2 (NEI2011v2) (EPA, 2015b) with the Sparse Matrix Operator Kernel Emissions (SMOKE) processing system version 3.0 (Houyoux et al., 2002) for anthropogenic emissions, the Model of Emissions of Gases and Aerosols from Nature (MEGAN) version 2.10 (Guenther et al., 2012) for biogenic emissions, and the WRAP Windblown Dust Model (WRAP-WBD) to estimate wind-driven dust emissions (UNC-Chapel Hill and ENVIRON, 2014b). Emissions from the oil and gas (OG) sector were further updated by the IWDW to represent the best-available inventory for OG activity in the western United States at the time of modeling (UNC-Chapel Hill and ENVIRON, 2014b). The emissions for fire activities (Fire) include agricultural fires, prescribed fires, and wildfires and were generated by the Particulate Matter Deterministic and Empirical Tagging and Assessment of Impacts on Levels (PMDETAIL) study (Moore et al., 2012). PMDETAIL developed 2011 fire emissions using satellite data, ground detection, and burn scar and estimated the plume rise, depending on fire size and type. The hourly, nonsurface fire emissions were allocated to the proper CAMx vertical layers based on the model-predicted planetary boundary layer (PBL) height and the spanning of the plume top and bottom above the ground (Mavko and Morris, 2013).
The boundary conditions for the 36 km domain were estimated from a 2011 global model run using the Model for Ozone and Related chemical Tracers (MOZART) version 4.6 (Emmons et al., 2010). The simulation year of 2011 was preceded by 15 days of spin-up time to minimize the effects of initial conditions. A more-detailed description of the WRF–SMOKE–CAMx modeling platform applied in this study is summarized in Table S1 in the Supplement as well as the 2011 Three-State Air Quality Study (3SAQS) (UNC-Chapel Hill and ENVIRON, 2014b).
For the source apportionment estimates, 27 source regions (Fig. 1), as well as the lateral boundary conditions (BCs), were “tagged” in the CAMx PSAT simulation. In addition, the emissions for each region were further subdivided into four source sectors: (1) AG, (2) OG, (3) Fire, including wildfires and prescribed fires, and (4) the remaining sources labeled as Other. The Other source sector primarily comes from mobile and large point sources, with smaller contributions from natural sources such as lightning. Table S2 provides the annual NH3 and NOx emissions used in this modeling study with a breakdown by tagged source regions and source sectors. Figure 2 provides the annual emissions of NH3 in the inner 12 km domain as well as the monitoring sites or receptor areas used for the model evaluation and analysis. For NH3 emissions, the AG sector contributed 84.1 % of the total emissions within the 12 km domain, while the OG, Fire, and Other sectors contributed 0.1 %, 4.5 %, and 11.4 %, respectively (Table S2). In the Snake River valley, the AG sector emissions dominate the emission budget. For NOx emissions, the contribution rankings from the four tagged emission sources are Other (83.8 %), OG (12.8 %), Fire (3.2 %), and AG (0 %). The regions were selected to highlight important source sector contributions to Nr deposition in the GYA. For example, the state of Wyoming was partitioned into five regions (YNP, Jackson, Upper Green River, eastern Wyoming, and western Wyoming) to differentiate the possible source impacts from urban activity in Jackson from energy development in southwestern Wyoming (Blett et al., 2011; NPS, 2017). Significant agricultural operations in the Snake River valley in Idaho, northern Utah, and northeastern Colorado were tagged due to their high ammonia emissions (see Fig. 2) associated with fertilizer application and confined animal feeding operations (Fenn et al., 2003; Clarisse et al., 2009; Prenni et al., 2014). Lastly, wildfires are episodic events (http://wrapfets.org/map.cfm, last access: 30 August 2018) that can have large intermittent contributions to Nr deposition, but they can mask important contributions from other sources that are significant in nonfire years.
Table 1CAMx model performance for nitrogen species concentrations as well as nitrogen dry–wet depositions evaluated at sites in the AMoN, CASTNet, IMPROVE, and NTN networks as well as the three sites during the GrandTReNDS campaign over the GYA region (see Fig. 1 for site locations) in 2011.
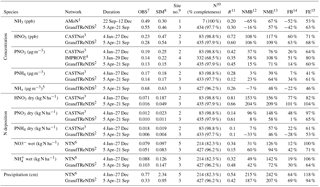
1 AMoN samples are collected for 2 weeks. 2 CASTNet samples are collected for 1 week. 3 GrandTReNDS samples are collected daily. 4 IMPROVE 24 h samples are collected every 3 days. 5 NHx= NH3+PNH4. 6 NTN samples are collected for 1 week. 7 Average observation. 8 Average simulation. 9 Number of sites. 10 Number of samples; the values in the parentheses are the percentage of valid samples used for model performance evaluation. 11 Pearson's correlation coefficient. 12 Normalized mean bias. 13 Normalized mean error. 14 Fractional bias. 15 fractional errors.
CAMx–PSAT treats nitrogen-containing compounds as one of seven species: gaseous NH3; particulate ammonium (PNH4); reactive gaseous nitrogen (RGN), which includes primary emissions of NOx, nitrous acid (HONO), nitrate radical (NO3), and dinitrogen pentoxide (N2O5); gaseous nitric acid (HNO3); gaseous peroxy nitrogen (TPN), including peroxyacetyl nitrate (PAN) and peroxynitric acid (PNA); gas-phase organic nitrate (NTR); and particulate nitrate (PNO3). PSAT maintains the source-group identity (i.e., source region and source sector) by apportioning the secondary species to the precursor emissions (ENVIRON, 2014). In the source apportionment comparison results, we report the reduced Nr deposition as the sum of NH3 and PNH4 and the oxidized Nr deposition as the sum of RGN, HNO3, PNO3, TPN, and NTR in units of kg N ha−1.
Acceptable model performance of the regional air quality modeling system is a prerequisite for a credible source apportionment interpretation (Boylan and Russell, 2006; EPA, 2014; Emery et al., 2017). In this work, the CAMx simulation was extensively evaluated against routine monitoring data as well as data collected in the GrandTReNDS special field study (Benedict et al., 2013a; Prenni et al., 2014) and against the nitrogen deposition estimates from the National Atmospheric Deposition Program (NADP, http://nadp.slh.wisc.edu/, last access: 30 August 2018) TDEP hybrid modeling results (Schwede and Lear, 2014). Performance metrics recommended by the EPA's modeling guidance for ozone, PM2.5, and regional haze attainment demonstrations (Yu et al., 2006; EPA, 2014) were used (see Table 1).
The variables and routine monitoring networks used in the model evaluation were NH3 concentrations from the Ammonia Monitoring Network (AMoN) (http://nadp.sws.uiuc.edu/AMoN/, last access: 30 August 2018); nitric acid (HNO3), PNO3, and PNH4 concentrations as well as estimated dry deposition fluxes from the Clean Air Status and Trends Network (CASTNet) (https://www.epa.gov/castnet, last access: 30 August 2018); PNO3 and PNH4 concentrations from the Chemical Speciation Network (CSN) (https://www3.epa.gov/ttnamti1/speciepg.html, last access: 30 August 2018); PNO3 concentrations from the Interagency Monitoring of Protected Visual Environments (IMPROVE) network; and wet-deposited inorganic oxidized () and reduced () nitrogen and associated precipitation rates from the NADP NTN sites. Each network had a unique sampling frequency and duration (Table 1). The hourly CAMx outputs were aggregated to match the timescales of the measured data. All measurement data flagged as questionable, either due to mal-operation or to insufficient samples to calculate representative values, were excluded from the analysis. Table 1 reports the percentage of valid measurements used for statistical analysis during evaluation time. For most of the N species, the percentage of valid samples is more than 80 %. In general, the CASTNet, IMPROVE, AMoN, and NADP networks sample in rural areas, while the data from the CSN network primarily represent the air quality in urban and suburban settings. Although organic N species were also measured in the GrandTReNDS campaign, we focus on the inorganic N budget comparison, given the large uncertainties for organic N prediction (Jickells et al., 2013) and its incomplete treatment in the model's chemical mechanism. For example, the modeling system does not account for primary emissions of organic N compounds but does include the formation of organic N from the alkylperoxy radical and secondary alkoxy radical (ENVIRON, 2014).
3.1 Evaluation against data in the GYA
The 3SAQS study performed photochemical grid modeling using the same modeling platform and input files as this study (UNC-Chapel Hill and ENVIRON, 2014b) and evaluated the model performance for the western United States. A subset of these results is presented in the Supplement for reference. Model performance statistics for the N species within the GYA area at AMoN, CASTNet, IMPROVE, and NTN network sites (Fig. 1) at different periods in 2011 are presented in Table 1. The biases at the GYA sites are similar to those throughout the west (Table S1) in that the CAMx simulation significantly overestimated HNO3 with a normalized mean bias (NMB) of 108 % and significantly underestimated NH3 concentrations with a NMB %. While the model had skill in reproducing the daily variation in HNO3, with a correlation coefficient of r=0.71, it had little skill for NH3, with r=0.2. The overestimation of HNO3 has also been reported in other regional-scale modeling simulations over the United States (e.g., Baker and Scheff, 2007; Foley et al., 2010; Thompson et al., 2015) with the carbon bond mechanism used in this study. The possible reason for the overestimation of HNO3 may be due to the uncertainty for the N2O5 uptake coefficient setting for heterogeneous reactions (Foley et al., 2010). The poor NH3 results may be related to the high uncertainty in the NH3 emission inventory (Clarisse et al., 2009) and important missing physical mechanisms in the model, including the lack of bidirectional NH3 deposition (Zhang et al., 2010; Bash et al., 2013; Zhu et al., 2015). The GYA area is located downwind of the major agriculture sources in the Snake River valley and northern Utah (Table S2). The incorporation of the bidirectional NH3 flux mechanism in the model should increase ambient NH3 concentrations in the GYA and thus decrease the large model underestimation of NH3 concentrations.
For PNO3 and PNH4 simulations in the GYA, CAMx overestimated both species, with better performance for PNH4 than PNO3 (3 % vs. 37 %, respectively, in terms of NMB) and better agreement for PNO3 at CASTNet sites vs. IMPROVE sites (37 % vs. 58 % for NMB, respectively). The errors and biases in the dry deposition fluxes compared to CASTNet values follow the same patterns as in the ambient concentrations, but it should be noted that CASTNet and CAMx use different algorithms to estimate dry deposition velocities, and these model-to-model discrepancies will manifest themselves in the performance evaluations.
Wet deposition measurements from the five NTN sites with sufficient data were available from within the GYA (Fig. S2). Comparisons to CAMx showed that the model captured the general trends in these data with r∼0.32–0.34 but were somewhat biased, with a NMB = 31 % for and NMB = 49 % for . The precipitation simulations were consistently 100 %–200 % higher than the rain gauge measurements at the NTN sites, showing that WRF overestimated the frequency and intensity of precipitation events over the GYA in 2011 (Table 1). However, note that 2011 was a large snowpack year; by May, much of the GYA had 100 %–180 % of the normal snow weather equivalent (USGS, 2014). Precipitation measurements tend to be low during high-snow events.
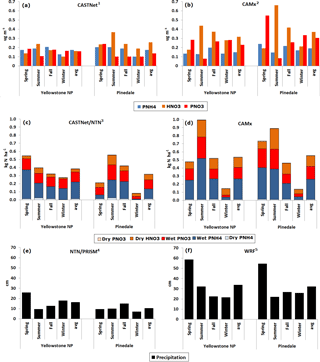
Figure 3Model performance for (a, b) seasonal average Nr concentration, (c, d) seasonal accumulated Nr deposition budget, and (e, f) seasonal accumulated precipitation amount at collocated location sites (YNP and Pinedale) over the GYA in 2011. 1 Clean Air Status and Trends Network. 2 Comprehensive Air Quality Model with extensions. 3 National Trends Network. 4 Parameter-elevation Regressions on Independent Slopes Model. 5 Weather Research and Forecasting model.
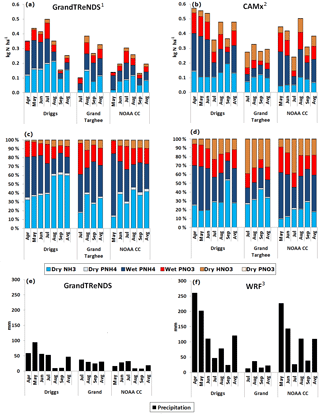
Figure 4Inorganic nitrogen deposition budgets as an absolute (a) and as a percentage (c) as well as precipitation (e), measured at the three core sites during the GrandTReNDS study period (April to September in 2011) with corresponding CAMx simulations (b, d, e). 1 Grand Teton Reactive Nitrogen Deposition Study. 2 Comprehensive Air Quality Model with extensions. 3 Weather Research and Forecasting model.
The seasonal, simulated ambient concentrations and deposition rates are compared against measured CASTNet and NADP data at the YNP and Pinedale monitoring sites in Fig. 3. Seasons refer to winter (December, January, February, DJF), spring (MAM), summer (JJA), and fall (SON). The significant overestimation of HNO3 is evident in all seasons. Also evident is the poor simulation of the seasonality in Nr deposition, primarily due to the poor reproduction of wet deposition, which is at least partly due to the large errors in the simulated precipitation.
Table S3 provides a comparison of regional CTM performance evaluations against measured N-containing species over the United States from peer-reviewed studies in recent years (e.g., Simon et al., 2012; Bash et al., 2013; Zhang et al., 2013; Yu et al., 2014; Thompson et al., 2015; Li et al., 2017). The model performance results in this study are comparable to these past studies, including the overestimation of HNO3 and underestimation of NH3. Resolution of these biases requires additional research and these biases need to be taken into account when interpreting the source attribution of Nr deposition within the GYA.
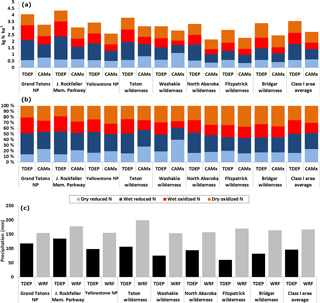
Figure 5Annual nitrogen deposition budgets as an absolute (a) and as a percentage (b) as well as annual precipitation amounts (c) from the NADP Total Deposition Map (TDEP) and corresponding CAMx (Comprehensive Air Quality Model with extensions) and WRF (Weather Research and Forecasting model) simulation results in 2011 at eight Class I areas across the GYA (the receptor sites on the x axis are arranged from west to east in the GYA; see Fig. 2). The reported CAMx dry and wet Nr deposition values at the eight Class I areas are the average of the simulation values at corresponding grid cells for each area.
3.2 Evaluation against GrandTReNDS data
The GrandTReNDS campaign provides a unique opportunity to evaluate the capability of CAMx to simulate the Nr compounds and deposition budget. Detailed measurements, including NH3, were made at three sites that crossed GTNP from west to east: Driggs, in the foothills just west of GTNP (43.74∘ N, −111.87∘ W, elevation 1947 m); Grand Targhee, an upper-elevation site on the western edge of GTNP (43.78∘ N, −110.94∘ W, elevation 2722 m); and the National Oceanic and Atmospheric Administration (NOAA) climate station site on the eastern edge of GTNP (43.66∘ N, −110.71∘ W, elevation 1978 m) (also see Fig. 2). Figure 4 presents the monthly deposition budgets for these three sites during the sampling periods, and Table 1 provides the model performance statistics for the N species concentration and deposition. As shown, the simulation does a poor job of reproducing the total Nr deposition rates both in the month-to-month variation and across the sites. The difference in the dry NH3 deposition monthly variation between measurements and simulation is mainly due to the difference in associated dry deposition velocity used for calculation. However, consistent with the observations, the simulation shows that wet deposition is larger than dry deposition and that the contribution from reduced N deposition was larger than from the oxidized N deposition at all three sites, although the observed range of 70 %–80 % reduced N was more than the 55 %–68 % simulated in CAMx. The primary cause of this bias was the overestimation in the HNO3 dry deposition rates, which were 2–3 times larger than those derived from the measured data. This is consistent with the systematic overestimation of HNO3 concentrations (NMB = 106 % in Table 1). Other biases also exist, including an underestimation in the NH3 dry deposition, which was somewhat balanced by an overestimation in the wet deposition (NMB = 60 %). The underestimation of NH3 concentration still existed (NMB = −16 %), and one of the possible reasons may be due to the overestimation of HNO3 in the model pushing excessive partitioning of NH3 into the particle phase, which can be shown by the better model performance for NHx (NHx = NH3 + PNH4) simulation (NMB %) without splitting the gas-particle partition bias.
An additional challenge that affected model performance was the difficulty in estimating precipitation rates. This is shown in Fig. 4, in which the simulated precipitation rates do not reproduce the month-to-month variation and generally were highly overestimated. For example, on average the simulated precipitation at Driggs was more than double the measured precipitation, and it was more than a factor of 4 higher at the NOAA climate station site.
3.3 Evaluation against NADP TDEP
TDEP maps (Schwede and Lear, 2014) are widely used in the land management community to assess total Nr deposition throughout the United States and estimate the critical load exceedances in sensitive ecosystems (Saros et al., 2011; Nanus et al., 2017). TDEP employs a hybrid approach to integrate measurements from multiple networks, including CASTNet and NTN, with Community Multiscale Air Quality (CMAQ) modeling (Byun and Schere, 2006) results for deposition velocities and unmeasured species' dry deposition, as well as PRISM (Parameter-elevation Regressions on Independent Slopes Model) (Daly et al., 1994) high-resolution precipitation estimates for mapping total deposition in the United States (Schwede and Lear, 2014). Both the CAMx simulation in this study and the TDEP results are derived from model simulations and subject to similar errors in emissions and physical and chemical processes. However, with the incorporation of measured wet Nr deposition and N concentration data into the TDEP results, they are expected to be less biased than the deposition results from a purely CAMx simulation.
The TDEP total Nr deposition and the CAMx 2011 simulation in this work exhibited similar spatial and temporal patterns across the western United States; for example, both sets of results show high Nr deposition in the Snake River valley, northern Utah, and across the Wyoming state border area near GTNP, with values >5 kg N ha−1 yr−1. Within the GYA (Fig. S3), the CAMx simulation had higher dry Nr deposition, which was more spatially heterogeneous than the corresponding TDEP results, with significantly higher Nr deposition in the agricultural lands to the west of the GYA and hot spots due to wildfires that are not evident in the TDEP results. Both sets of results showed higher Nr wet deposition at the higher-elevation sites in the interior of the GYA, which was associated with higher precipitation rates. However, the TDEP Nr wet deposition was generally higher throughout the GYA, with an annual average Nr wet deposition rate of 2.0 N ha−1 yr−1 vs. 1.3 N ha−1 yr−1 from CAMx. Precipitation maps generated by WRF and PRISM across the GYA had similar spatial patterns, with hot spots located in high-elevation mountain ranges, though the WRF annual precipitation rates were on average 73 % higher than the PRISM estimates.
The annual Nr deposition budget and the annual precipitation rate from TDEP and the CAMx simulations for eight Class I areas over the GYA are compared in Fig. 5. The reported CAMx dry and wet Nr deposition values in Fig. 5 are the averages of the simulation values at corresponding grid cells for each area. Generally, results from the CAMx model agreed well with TDEP results in terms of replicating spatial gradients and ratios of oxidized vs. reduced N deposition. The TDEP 2011 annual Nr deposition at the GYA receptor sites was in the range of 2.8–5.4 kg N ha−1 yr−1, while the corresponding values for CAMx were 2.2–4.3 kg N ha−1 yr−1. Both results showed the west-to-east gradient (Prenni et al., 2014) with higher Nr deposition at the western side of the GYA and relatively low values in the Fitzpatrick Wilderness. Also, both models showed the importance of reduced Nr in the GYA, with a nearly 50 % or higher contribution to the total Nr deposition budget. However, the two models differed on the ratio of dry vs. wet Nr deposition, with CAMx simulating a higher fraction from dry Nr deposition than TDEP.
The seasonal modeled Nr deposition budgets averaged over the GYA are presented in Fig. 6. As shown, the total Nr deposition rates peaked in the summer (1.12 kg N ha−1 season−1) with somewhat lower rates in the spring (0.91 kg N ha−1 season−1) and fall (0.81 kg N ha−1 season−1) and with winter rates (0.29 kg N ha−1 season−1) being about a factor of 3 smaller than in the other seasons. These patterns are similar to the measured and modeled data presented in Fig. 3. In total, the annual model Nr deposition was 3.13 kg N ha−1 yr−1, with wet deposition accounting for only ∼40 %. Reduced N compounds were the largest contributor, except in winter, which is consistent with past studies (Li et al., 2017). Contributions from organic N compounds are not measured in routine monitoring programs. Together they accounted for <10 % of the Nr deposition, suggesting a small but significant contribution. This is also less than has been measured in field studies conducted at GTNP (Benedict et al., 2013a; Prenni et al., 2014) and in RMNP (Benedict et al., 2013b), where the GrandTReNDS study showed on average a 8 %–18 % contribution from organic N to total Nr deposition budgets during the whole campaign period and up to 39 % in June at the NOAA Climate Station site (Fig. 7 in Benedict et al., 2013a).
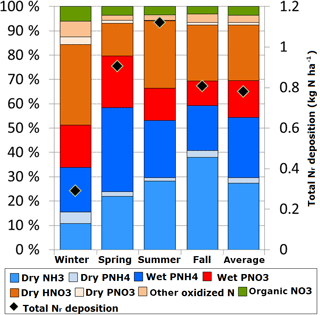
Figure 6Seasonal CAMx simulated Nr deposition budgets averaged over the GYA in 2011. The left axis is the relative contribution of different Nr species to seasonal Nr deposition while the right axis corresponds to the black diamonds for seasonal total Nr deposition as an absolute (kg N ha−1).
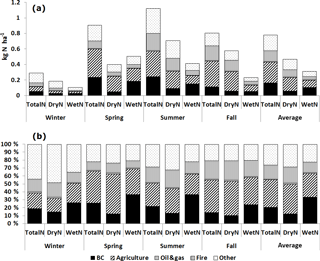
Figure 7Contributions of source sectors to the mean total Nr deposition, dry Nr deposition, and wet Nr deposition over the GYA in different seasons in 2011. (a) The source sector contributions as an absolute and (b) the corresponding contributions as a percentage.
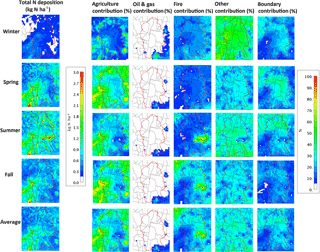
Figure 8Seasonal patterns of different source sectors' (agriculture, oil and gas activities, fires, others (e.g., anthropogenic, biogenic, lightning, and boundary conditions)) contributions to total Nr deposition over the GYA in 2011. The first column is the total seasonal Nr deposition patterns in kg N ha−1 while the following five columns are the seasonal patterns of relative contributions from different source sectors.
The relative contributions from the four modeled source sectors (AG, OG, Fire, and Other) and the BCs averaged over the GYA are presented in Fig. 7, while Fig. 8 presents the seasonal and spatial patterns of their contributions over the GYA. As shown in Table S2, the AG source sector was composed of almost all reduced N compounds (>99 %), while the Other source sector was primarily composed (97 %) of oxidized N compounds, with about 88 % originating from anthropogenic combustion emissions, including point and mobile sources, and the remainder originating from the natural emissions from soil and lightning. Contributions from the Fire and the BCs sectors were more evenly split between reduced and oxidized N contributions.
Reduced N from the AG source sector was the largest contributor in the spring (40 %) and fall (41 %) seasons, while oxidized N from the Other source sector was the largest contributor in summer (29 %) and winter (44 %) (Fig. 7). In terms of geographic impact (Fig. 8), AG emissions contributed as much as 80 % of the total Nr deposition in the western portion of the GYA during the spring and fall, which was associated with the outflow from the Snake River valley. In the model, NH3 from regional agriculture activities was treated as being from surface area sources (i.e., emitted into the first model layer, which is approximately 24 m thick). These low-level emissions can be quickly deposited to the surface unless there is sufficient vertical mixing to inject the NH3 into the upper levels of the atmosphere (Ferm, 1998; Fenn et al., 2003) or if it reacted with acidic gases and aerosols. Consequently, it is likely that a higher fraction of the modeled NH3 emissions from the AG sector will be deposited in the lower-elevation periphery of the GYA near the agricultural lands and not impact the more distant mountainous interior (Fig. 2). The incorporation of the bidirectional NH3 flux could extend the NH3 emission footprint (Bash et al., 2013; Zhu et al., 2015).
The OG source sector contributed only about 1 % of the total Nr deposition over the GYA, with contributions of 10 % or more occurring during winter in the southeastern corner of the GYA where nearby OG activity in the Jonah Field and Pinedale Anticline was taking place. Wildfires are episodic and their locations and magnitudes vary significantly from year to year (Westerling and Swetnam, 2003; Parisien et al., 2012). In 2011, fire events contributed on average 18 % of the total Nr deposition in the GYA. Most of the wildfire happened in summer and fall, while agriculture and prescribed burning occurred in winter and spring. Near the fire activities, the contribution to Nr deposition could be more than 90 %, as seen in Fig. 8. The footprint of fire emission impacts depends on the simulated injection height of the fire plumes. The emissions from fires that occurred within the GYA during the summer and fall likely remained within the mixed layer and had less of a chance to be transported far downwind to impact more distant areas (Fig. S4). The Other source sector had relatively uniform contributions throughout the GYA, indicative of contributions from regional sources. The Other sector accounted for 26 % of the annual Nr deposition, with its largest absolute contributions in the summer, but had the highest relative contribution in the winter at 44 % when AG contributions were at their lowest. Finally, the BCs had high contributions, often over 20 %, with the highest contributions occurring in the northern part of the GYA and at higher-elevation sites.
The seasonal contributions from the modeled source regions and sectors to the average total Nr deposition over the GYA are summarized in Fig. 9. As shown, the Snake River valley in Idaho was the largest contributor (in all seasons), with annual mean contributions of 38 % and a maximum contribution of 43 % in fall. Most (74 %) of the Nr from this region was from the AG source sector and was composed of reduced N (Table S4). The next four largest contributors, on average, were the BCs (21 %), western Wyoming (8 %), California (7 %), and northern Utah (6 %). The impact of emissions from Wyoming on the GYA during summer and fall (14 % and 16 %, respectively) was more pronounced than winter and spring (5 % and 7 %, respectively). The contributions of long-range transport from California and the BCs were higher during spring and winter.
Seasonal source apportionment results of the average dry and wet Nr deposition over the GYA are shown in Figs. 7 and 9. Compared to the results for total Nr deposition, the dry Nr deposition had higher contributions from closer sources, such as the Snake River valley (46 % for dry vs. 38 % for total), with emissions primarily from AG sources. Similarly, contributions to dry Nr deposition from Wyoming were 15 % compared to 12 % for total Nr deposition and ranked as the second-largest contributor. The contributions from distant source regions decreased. For example, the BCs decreased from 21 % for total Nr deposition to 12 % for dry Nr deposition.
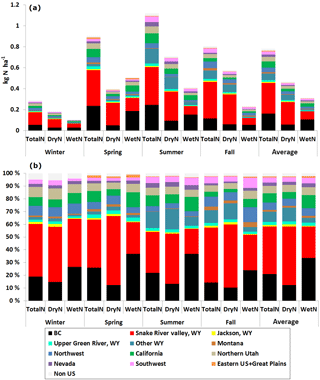
Figure 9Contributions of source regions to the mean total Nr deposition, dry Nr deposition, and wet Nr deposition over the GYA in different seasons in 2011. (a) The source region contributions as an absolute and (b) the corresponding contributions as a percentage.
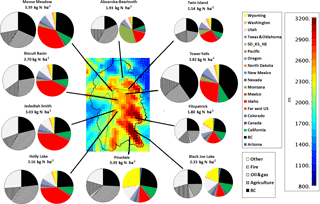
Figure 10Contributions of different source sectors as well as boundary conditions for total Nr deposition in 2011 at 10 points of interest for critical load exceedance (see Table 2 for site locations and ecosystem impacts). The black-and-white pies are the contributions by source sector while the color pies are the contributions by source region. The color contour for the GYA boundary is the terrain heights with the legend at at the right.
Table 2Total reactive nitrogen (Nr) deposition and critical loads for receptor points in the Greater Yellowstone Area in Wyoming.
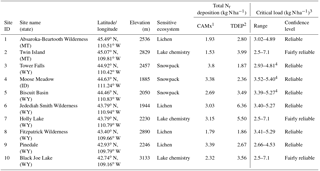
1 Comprehensive Air Quality Model with extensions. 2 NADP total deposition maps. 3 The range of critical loads (CLs) for different effects on the selected sensitive ecosystem receptor is from US CLAD (Critical Loads for Sulfur and Nitrogen Access Database), version 2.5 (Lynch et al., 2015). The level of confidence is based on the work of Pardo et al. (2011). The lower ends of the range were used in this study as a measured CL. 4 The CL values were for lichen response at sites with snowpack as a sensitive ecosystem.
The opposite pattern is seen for wet Nr deposition, where the contributions from the distant source regions increased relative to the neighboring ones. The annual contributions from the BCs increased to 34 % and peaked in spring and summer at 37 %, associated with higher precipitation amounts than the other two seasons. Annual contributions from sources in California (10 %) and Utah (8 %) surpassed Wyoming (7 %). Furthermore, the seasonal variation for wet Nr deposition was different from dry and total Nr deposition, with the highest deposition rates occurring in spring as opposed to summer.
The GYA has been the focus of several ecological assessments of the response of ecosystems to changing Nr deposition levels (Spaulding et al., 2015; Nanus et al., 2017). Figure 10 presents the source attribution results for 10 sites within the GYA where either ecosystem response studies or deposition monitoring has been conducted for lichen diversity, alpine lake chemistry, and snowpack analysis. In Table 2, the CL values are provided as a range of lower-end and upper-end estimates of the annual total inorganic Nr deposition values (Lynch et al., 2015) with confidence levels (Pardo et al., 2011). The simulated Nr deposition exceeded the lower CL values at three of the 10 sites, specifically, Holly Lake, Pinedale, and Tower Falls. Comparatively, the 2011 TDEP Nr deposition results exceeded the CL at 6 out of 10 sites (Black Joe Lake, Biscuit Basin, Holly Lake, Jedediah Smith Wilderness, Pinedale, and Twin Island). As shown in Fig. 10, the sites that exceeded the CL tend to be in high-alpine locations, with four of these sites on the western slope of the mountains, which are downwind of the Snake River valley. These results are consistent with another modeling study to access CL exceedances in Class I areas using GEOS-Chem (Ellis et al., 2013; Lee et al., 2016). In addition, in one study (Nanus et al., 2017) over 30 % of the GYA was estimated to potentially exceed lower Nr deposition CL thresholds, with the greatest impacts in sensitive high-elevation basins, including areas within national parks and wildernesses.
In terms of emission sectors and source regions contributing to the total annual Nr deposition at CL exceedance sites, emission sources from the Snake River valley were the largest contributors (27 %–32 %), and AG emissions were the largest source of this subset. The next three largest contributors were transport from the BCs (23 %–25 %) and emissions from northern Utah (8 %–15 %) and California (7 %–8 %). Wyoming emissions associated with the OG and Fire emission sectors contributed around 3 %–5 % and 14 %–23 %, respectively, of the Nr budget for receptor sites at the southeastern corner of the GYA.
It is evident from the results in Sect. 4 that the attribution of total Nr deposition to source regions and sectors is sensitive to NH3 dry deposition rates, the relative contributions of dry and wet deposition, and the concentrations of N compounds from the BCs. However, the model evaluation revealed a significant underestimation of NH3 concentrations and overestimation of HNO3 concentrations and precipitation rates; thus, these modeling errors could bias the source attribution results. To better understand the potential effects of these biases, sensitivity analyses of the source attributions to changes in NH3 dry deposition rates and average precipitation rates as well as potential biases in the BCs were evaluated.
To test the sensitivity of the apportionment to NH3 dry deposition rates, the deposition velocities were reduced by increasing the NH3 resistance scaling factor by 10 %, following the methodology used in Thompson et al. (2015). The Zhang et al. (2003) dry deposition scheme was used in the CAMx simulations (Table S1), and this resistance scaling factor is designed to address the rapid removal of “sticky” compounds such as HNO3 and NH3 and can yield a nonlinear response in the estimated dry deposition velocity. July and August 2011 were simulated using the modified deposition velocity, and these results will be referred to as “DV_0.1”. The 10 % change in the resistance factor slowed the NH3 deposition velocity from 2.5–4 to 1–1.5 cm s−1 over the GYA, resulting in values more comparable to those used in the GrandTReNDS study (Benedict et al., 2013a; Prenni et al., 2014). The simulated NH3 concentrations for the DV_0.1 case increased throughout the GYA compared to the base case. This resulted in better agreement with NH3 measurements at the Grand Targhee and NOAA climate station sites but poorer agreement at the Driggs monitoring site (Fig. S5). The slower dry deposition velocities result in a longer NH3 lifetime, allowing it to travel farther from nearby source regions, e.g., the Snake River valley, into the GYA and cause a more homogeneous concentration pattern throughout the GYA (Fig. S6). As shown in Fig. 11, the slower deposition velocities also somewhat altered the source attribution results. The contribution from the AG emission sector increased with the DV_0.1 simulation to 23 % compared to 19 % in the base case, with a smaller decrease in the contributions from the Other and the Fire sectors. This change was due to small increases in the contributions from the Snake River valley and northern Utah and decreases from Wyoming. Overall, decreasing the NH3 dry deposition rate by about a factor of 2 had only a small impact on the Nr deposition budget and source apportionment results in the GYA. It is important to note that, although this was a significant reduction in the simulated dry deposition velocity for NH3, it still represents a relatively rapid removal rate compared to other species, and NH3 is quickly lost from the atmosphere in either case. It is known that NH3 deposition in many environments is a bidirectional as opposed to a unidirectional process, and modeling the NH3 flux as a bidirectional process may further decrease the bias for ambient NHx concentration simulations (Bash et al., 2013; Wen et al., 2014; Whaley et al., 2018). The key process in air quality models to represent the re-emission of NH3 from soil and plants to the atmosphere is the estimation of the available soil NHx pool and the parameterization of compensation points for the conditions to re-emit NH3 (Zhang et al., 2010; Whaley et al., 2018). In the CMAQ model, the bidirectional NH3 deposition was realized by coupling with the United States Department of Agriculture's (USDA) Environmental Policy Integrated Climate (EPIC) agroecosystem model to provide the fertilization timing, rate, and composition (Bash et al., 2013). There is no similar parameterization available in the current CAMx model. Furthermore, the CAMx source apportionment tools cannot properly account for the origin of NH3 concentrations at a receptor that has been deposited and then re-emitted.
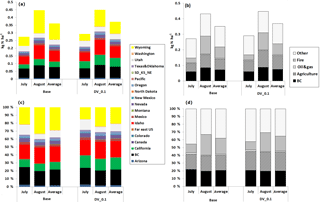
Figure 11The sensitivity of NH3 dry deposition velocity (a, b “base” case; c, d “DV_0.1” case with NH3 dry deposition velocity slowing down) to source apportionment results over the GYA during July–August 2011. Panels (a) and (c) show the contributions by source region as an absolute and as a percentage while (b) and (d) show the contributions by source sector.
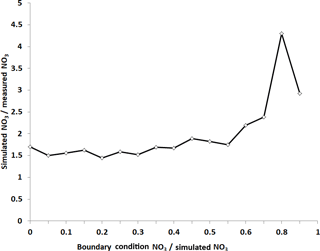
Figure 12Ratio of simulated vs. measured particulate nitrate (PNO3) concentrations against the boundary contributions to simulated PNO3 at IMPROVE sites over a 12 km domain.
The CAMx simulation overestimated the wet Nr deposition at measured sites, which was likely associated with an overestimation in the precipitation rates from WRF, especially at high-elevation sites. This precipitation rate bias was large, with the annual precipitation over the GYA more than 73 % higher than the PRISM estimates. We used the Noah land-surface model and Kain–Fritsch scheme cumulus parametrization in the WRF simulations (Table S1), and those physical module configurations were reported to have the tendency to overestimate precipitation (Warrach-Sagi et al., 2013). To evaluate the impact of the overestimation in precipitation on the source attribution results, the seasonal wet deposition rates were scaled to the measured precipitation rates at all NADP NTN and GrandTReNDS monitoring sites, following the procedures by Appel et al. (2011). This was equivalent to scaling the modeled wet deposition rates by the ratio of the measured to modeled precipitation rates. This approach assumes that the concentrations of Nr in the precipitation were the same in the model and measured data, which was not the case. After the precipitation adjustment, the correlation between the simulated and measured Nr wet deposition improved (Fig. S7). Within the GYA, however, the scaled Nr wet deposition underestimated the measured N deposition by about a factor of 2 and significantly underestimated the ratio of wet to dry deposition. Consequently, scaled wet deposition results were not used in this assessment. The overestimation of HNO3 concentrations in the GYA is another reason for the wet Nr deposition overestimation. However, its impact on source apportionment results was not conducted here due to unclear reasons for the model bias (emission, chemistry, meteorology, deposition scheme) and limited computational resources.
The BC used in this work was derived from a MOZART global model simulation. An alternative set of BCs from the GEOS-Chem global model was also evaluated. Both sets of BCs resulted in high contributions to the total Nr deposition in the GYA, with the GEOS-Chem results having a slightly higher average contribution of 23 % compared to 21 % for MOZART (Figure S8). However, the GEOS-Chem BCs resulted in higher relative contributions of oxidized N to the total Nr deposition rate compared to the MOZART BCs (51 % and 45 %, respectively). The poor correspondence in the oxidized to reduced Nr split is reflective of the large uncertainties in the BC contributions to the Nr deposition and suggests that more evaluation of the global model results is warranted.
To examine the potential bias in the BC contributions, the simulated PNO3 concentrations were compared to measurements from the IMPROVE monitoring program over the western United States for 2011. This comparison is shown in Fig. 12, in which the ratio of the simulated to measured PNO3, i.e., an estimate of the bias, is plotted against the relative fraction of the contribution of the BCs to the simulated PNO3. The data were first segregated by the fractional contribution of the BCs and then averaged together. As shown, for the MOZART BCs, the bias increased with larger relative contributions from the BCs, and when the BC fraction was 60 %, the bias was more than a factor of 2. This suggests that at least the particulate nitrate concentrations from the BCs are overestimated and possibly other Nr compounds from the BCs as well. In a CMAQ simulation using BCs derived from a GEOS-Chem simulation, Baker et al. (2015) also found that the contributions from the BCs to PNO3 were overestimated when compared to IMPROVE data.
The CAMx model and its PSAT source apportionment tool were used to examine and quantify the contributions of four different source sectors and 27 source regions and the boundary conditions (BCs) to the 2011 total inorganic Nr deposition within the GYA. The source sectors were agriculture (AG), oil and gas activities (OG), wild and prescribed fires (Fire), and remaining contributions labeled as Other. The Other sector was primarily composed of oxidized N originating from anthropogenic combustion sources, including mobile and point sources, and the AG sector was almost entirely composed of reduced N compounds. Fire and the BCs were a mix of reduced and oxidized N compounds. This assessment focused on only the inorganic N fraction. There is measured evidence that organic N (Benedict et al., 2013a; Prenni et al., 2014) is a significant contributor to Nr deposition, and the inability to assess its origin in the current CTM is an important uncertainty in this work. Nevertheless, this Nr source apportionment work is the first thorough analysis of the origin of inorganic Nr in the GYA using a regional air quality modeling platform. The detailed source sector and source region configurations in PSAT enabled quantitative, though uncertain, estimates of their relative importance. This information is needed by stakeholders and regulators to understand the causes of excess Nr deposition in the GYA, monitor changes in Nr deposition, and develop possible future mitigation strategies.
Overall, the model simulation had a reasonable capacity to reproduce the measured seasonal and annual total Nr deposition levels throughout the GYA. However, the model simulation underestimated the measured NH3 concentrations by 65 % on average and overestimated the measured HNO3 by 108 %. Therefore the model tended to overestimate the contributions from oxidized N compounds and underestimate those from reduced N compounds to total Nr deposition. In addition, both reduced and oxidized Nr wet depositions were overestimated by 20 %–30 %, which was due, at least partially, to the simulated precipitation frequency and magnitude being too high in the model. These biases suggest that the modeled contributions from the AG emission sector were underestimated, while those from the Other sector's activities were overestimated.
The simulated annual total Nr deposition over the GYA in 2011 was 3.13 kg N ha−1 yr−1 and exceeded the CL estimates for lichen and lake chemistry primarily at high-elevation sites on the western slope and southern portion of the GYA. This finding is consistent with other studies using global models. Ellis et al. (2013) used the GEOS-Chem model to estimate the Nr deposition to Class I areas for 2006 and showed that the simulated total Nr deposition at GTNP (2.9 kg N ha−1 yr−1) and YNP (2.6 kg N ha−1 yr−1) exceeded the low end of CL for lichens (2.5 kg N ha−1 yr−1).
Emissions from the AG sector within the modeling domain were the largest contributor to the GYA total Nr deposition budget at 34 % year−1. The contributions from the Other sector were also large at 26 %. The OG emission sector generally had a small contribution, except at the southern edge of the GYA, where it could contribute over 10 % of the total Nr deposition during winter months, with almost half of the OG contributions originating from emissions in the neighboring Jonah Field in western Wyoming. The Fire emission sector also had a significant contribution of 18 % over the year. This was due to regional contributions from fires throughout the west and large contributions (>90 %) in areas within the GYA where several wildfires occurred (Fig. 8). The large impact from fires within the GYA is notable since the episodic nature of fire will result in differing year-to-year contributions from this uncontrollable sector.
The largest impact from the AG emission sector originated from sources relatively close to the GYA, and the Snake River valley accounted for 74 % of the annual agricultural contribution. The agricultural contribution from Wyoming was 7 %, and more-distant source regions in northern Utah, California, and the northwestern United States each accounted for 4 %–5 % of the agricultural contribution. Nearly half (45 %) of the Nr deposition from the OG emission sector originated within Wyoming, especially the Upper Green River (27 %). The largest impact from the Fire emission sector originated from the Snake River valley (33 %) and within the GYA (25 %). The Other emission sector was more evenly distributed among near and distant regions, with the Snake River valley 23 %, Wyoming 17 %, and northern Utah, California, and the northwestern United States accounting for 14 %–16 % of the Nr deposition.
Long-range transport of N species from the BCs, which primarily originated from international sources, contributed 21 % of the total Nr deposition within the GYA during 2011 and had the largest absolute contribution during the summer. Several studies have shown the importance of international source contributions to particulates and N deposition within the continental United States (Park et al., 2004; Brewer and Moore, 2009; Zhang et al., 2012; Fann et al., 2013; Baker et al., 2015; Thompson et al., 2015). However, the BCs contribution in this work is on the high end of the reported values. For example, in a similar modeling study by Thompson et al. (2015), the estimated contribution of BCs to Nr deposition in Rocky Mountain National Park in 2009 was 13 %. Zhang et al. (2012) used the GEOS-Chem model to evaluate N deposition in the United States during 2006–2008 and showed that foreign anthropogenic contributions were generally <10 % but could rise up to 30 % near the Canadian and Mexican borders. In addition, our evaluations of the BCs suggest that the contribution of the BCs to ambient PNO3 and possibly other Nr compounds was overestimated (Fig. 12), clearly suggesting that more research is needed on the role of distant emission sources in impacting N deposition in remote areas, as well as further investigations into model biases.
The observed precipitation in 2011 was ∼30 %–50 % higher than the historical average (NOAA, 2012), with the largest bias occurring at the eastern sites in the GYA (Fig. S9). This suggests that dry deposition of NH3 may be a more important contributor to total Nr deposition during spring than that observed during GrandTReNDS. Also, considering that the wet deposition in the GYA tended to be overestimated and the precipitation amount in 2011 was anomalously high, the source regions identified as having a higher weighting on the annual wet Nr deposition budget (e.g., California) may not have such a significant impact as the current PSAT results suggested.
As discussed, source apportionment assessments of Nr and its deposition to remote, ecologically sensitive areas such as the GYA have large uncertainties. Many of these uncertainties are known to the air quality modeling community, including the challenges of simulating precipitation in complex terrain, adequately characterizing NH3 emissions from agricultural operations, the occurrence of wildfires, and the difficulty in simulating the NH3 bidirectional flux and the deposition flux of the other Nr compounds. Contributions from long-range transport of international emissions can also play a significant role in deposition in remote locations in the western United States. Further refinement in all of these areas is required to better understand and estimate the relative contributions of emission sources to excess N deposition within the GYA. Nevertheless, the modeling assessment showed that reduced N contributed more than 50 % of the total Nr deposition over the GYA, with >90 % of the NH3 emissions originating from agriculture sources. In addition, the Snake River valley in Idaho accounted for 74 % of the agricultural contribution to the total Nr deposition. Significant contributions from more distant sources, e.g., California and international sources, to both oxidized and reduced Nr deposition illustrate the regional nature of the Nr deposition problem. Emissions of oxidized N compounds are projected to continue to decrease, while emissions of ammonia are projected to remain relatively constant or increase (Li et al., 2016). This will further increase the importance of the AG sector. However, exceedances of CL are still relatively small, and it is possible that decreased oxidized N deposition could reduce the Nr deposition sufficiently to bring total Nr deposition below the CL in some GYA ecosystems.
Model data have been made available through the Mountain Scholar repository service. The nitrogen deposition source apportionment results over the Greater Yellowstone Area can be accessed at https://hdl.handle.net/10217/191136 (Zhang et al., 2018). Contact the corresponding author for any additional data requests.
The supplement related to this article is available online at: https://doi.org/10.5194/acp-18-12991-2018-supplement.
RZ, TMT conducted the source apportionment simulations. RZ, TMT, MGB, JLH, BAS performed results analysis and interpretation. RZ, MGB, JLH, BAS prepared the manuscript. MDB contributed the critical load excess assessment. JAM and WCM were involved in the discussion of model uncertainties and edited the drafts of the paper.
The authors declare that they have no conflict of interest.
This work was funded by the National Park Service Air Resources Division
under cooperative agreement P17AC00773. The assumptions, findings,
conclusions, judgments, and views presented herein are those of the authors
and should not be interpreted as necessarily representing the National Park
Service policies. The Interagency Monitoring of Protected Visual Environments
(IMPROVE) is a collaborative association of state, tribal, and federal
agencies and international partners. The U.S. Environmental Protection
Agency is the primary funding source, with contracting and research support
from the National Park Service. The Air Quality Group at the University of
California, Davis, is the central analytical laboratory, with ion analysis
provided by the Research Triangle Institute and carbon analysis provided by
the Desert Research Institute. We acknowledge the Total Deposition (TDEP)
Science Committee of the National Atmospheric Deposition Program (NADP) for
their role in making the TDEP data and maps available.
Edited by: Leiming Zhang
Reviewed by: two
anonymous referees
Appel, K. W., Foley, K. M., Bash, J. O., Pinder, R. W., Dennis, R. L., Allen, D. J., and Pickering, K.: A multi-resolution assessment of the Community Multiscale Air Quality (CMAQ) model v4.7 wet deposition estimates for 2002–2006, Geosci. Model Dev., 4, 357–371, https://doi.org/10.5194/gmd-4-357-2011, 2011.
Baker, K. and Scheff, P.: Photochemical model performance for PM2.5 sulfate, nitrate, ammonium, and precursor species SO2, HNO3, and NH3 at background monitor locations in the central and eastern United States, Atmos. Environ., 41, 6185–6195, 2007.
Baker, K. R., Emery, C., Dolwick, P., and Yarwood, G.: Photochemical grid model estimates of lateral boundary contributions to ozone and particulate matter across the continental United States, Atmos. Environ., 123, 49–62, 2015.
Baron, J. S.: Hindcasting nitrogen deposition to determine an ecological critical load, Ecol. Appl., 16, 433–439, 2006.
Baron, J. S., Driscoll, C. T., Stoddard, J. L., and Richer, E. E.: Empirical critical loads of atmospheric nitrogen deposition for nutrient enrichment and acidification of sensitive US lakes, BioScience, 61, 602–613, 2011.
Bash, J. O., Cooter, E. J., Dennis, R. L., Walker, J. T., and Pleim, J. E.: Evaluation of a regional air-quality model with bidirectional NH3 exchange coupled to an agroecosystem model, Biogeosciences, 10, 1635–1645, https://doi.org/10.5194/bg-10-1635-2013, 2013.
Benedict, K. B., Chen, X., Sullivan, A. P., Li, Y., Day, D., Prenni, A. J., Levin, E. J. T., Kreidenweis, S. M., Malm, W. C., Schichtel, B. A., and Collett, J. L.: Atmospheric concentrations and deposition of reactive nitrogen in Grand Teton National Park, J. Geophys. Res., 118, 11874–11887, https://doi.org/10.1002/2013JD020394, 2013a.
Benedict, K. B., Day, D., Schwandner, F. M., Kreidenweis, S. M., Schichtel, B., Malm, W. C., and Collett Jr., J. L.: Observations of atmospheric reactive nitrogen species in Rocky Mountain National Park and across northern Colorado, Atmos. Environ., 64, 66–76, 2013b.
Bey, I., Jacob, D. J., Yantosca, R. M., Logan, J. A., Field, B., Fiore, A. M., Li, Q., Liu, H., Mickley, L. J., and Schultz, M.: Global modeling of tropospheric chemistry with assimilated meteorology: Model description and evaluation, J. Geophys. Res., 106, 23073–23096, 2001.
Blett, T., Grenon, J., and Svalberg, T.: Greater Yellowstone area critical loads science workshop final report, prepared by National Park Service Air Resources Division and Bridger-Teton National Forest, available at: https://www.nature.nps.gov/air/pubs/pdf/GYE-CL_Workshop_Report-Final_04-2011.pdf (last access: 21 February 2018), 2011.
Boylan, J. W. and Russell, A. G.: PM and light extinction model performance metrics, goals, and criteria for three-dimensional air quality models, Atmos. Environ., 40, 4946–4959, 2006.
Brewer, P. and Moore, T.: Source contributions to visibility impairment in the southeastern and western United States, J. Air Waste Manag. Assoc., 59, 1070–1081, https://doi.org/10.3155/1047-3289.59.9.1070, 2009.
Byun, D. and Schere, K. L.: Review of the governing equations, computational algorithms, and other components of the Models-3 Community Multiscale Air Quality (CMAQ) modeling system, Appl. Mech. Rev., 59, 51–77, 2006.
Cape, J. N., Cornell, S. E., Jickells, T. D., and Nemitz, E.: Organic nitrogen in the atmosphere – Where does it come from? A review of sources and methods, Atmos. Res., 102, 30–48, 2011.
Clarisse, L., Clerbaux, C., Dentener, F., Hurtmans, D., and Coheur, P. F.: Global ammonia distribution derived from infrared satellite observations, Nature Geosci., 2, 479–483, 2009.
Clow, D. W., Sickman, J. O., Striegel, R. G., Krabbenhoft, D. P., Elliott, J. G., Dornblaser, M., Roth, D. A., and Campbell D. H.: Changes in the chemistry of lakes and precipitation in high-elevation national parks in the western United States, 1985–1999, Water Resour. Res., 39, 1171, https://doi.org/10.1029/2002WR001533, 2003.
Daly, C., Neilson, R. P., and Phillips, D. L.: A statistical-topographic model for mapping climatological precipitation over mountainous terrain, J. Appl. Meteor., 33, 140–158, 1994.
Ellis, R. A., Jacob, D. J., Sulprizio, M. P., Zhang, L., Holmes, C. D., Schichtel, B. A., Blett, T., Porter, E., Pardo, L. H., and Lynch, J. A.: Present and future nitrogen deposition to national parks in the United States: critical load exceedances, Atmos. Chem. Phys., 13, 9083–9095, https://doi.org/10.5194/acp-13-9083-2013, 2013.
Emery, C., Liu, Z., Russell, A. G., Odman, M. T., Yarwood, G., and Kumar, N.: Recommendations on statistics and benchmarks to assess photochemical model performance, J. Air Waste Manag. Assoc., 67, 582–598, 2017.
Emmons, L. K., Walters, S., Hess, P. G., Lamarque, J.-F., Pfister, G. G., Fillmore, D., Granier, C., Guenther, A., Kinnison, D., Laepple, T., Orlando, J., Tie, X., Tyndall, G., Wiedinmyer, C., Baughcum, S. L., and Kloster, S.: Description and evaluation of the Model for Ozone and Related chemical Tracers, version 4 (MOZART-4), Geosci. Model Dev., 3, 43–67, https://doi.org/10.5194/gmd-3-43-2010, 2010.
ENVIRON (ENVIRON International Corporation): CAMx version 6.10 User's Guide, available at: http://www.camx.com/files/camxusersguide_v6-10.pdf (last access: 21 March 2017), 2014.
EPA (Environmental Protection Agency): Modeling Guidance s for demonstrating attainment of air quality goals for ozone, PM2.5, and regional haze, available at: https://www3.epa.gov/scram001/guidance/guide/Draft_O3-PM-RH_Modeling_Guidance-2014.pdf (last access: 21 February 2018), 2014.
EPA (Environmental Protection Agency): Preparation of emissions inventories for version 6.2, 2011 emission modeling platform, available at: http://vibe.cira.colostate.edu/wiki/Attachments/Modeling/3SAQS_2011_WRF_MPE_v05Mar2015.pdf (last access: 21 February 2018), 2015a.
EPA (Environmental Protection Agency): 2011 National Emission Inventory, Technical Support Document, version 2, Research Triangle Park, NC, available at: https://www.epa.gov/sites/production/files/2015-10/documents/nei2011v2_tsd_14aug2015.pdf (last access: 21 February 2018), 2015b.
Fann, N., Fulcher, C. M., and Baker, K.: The recent and future health burden of air pollution apportioned across US sectors, Environ. Sci. Tech., 47, 3580–3589, 2013.
Fenn, M. E., Baron, J. S., Allen, E. B., Rueth, H. M., Nydick, K. R., Geiser, L., Bowman, W. D., Sickman, J. O., Meixner, T., Johnson, D. W., and Neitlich, P.: Ecological effects of nitrogen deposition in the western United States, BioScience, 53, 404–420, 2003.
Fenn, M. E., Bytnerowicz, A., Schilling, S. L., Vallano, D. M., Zavaleta, E. S., Weiss, S. B., Morozumi, C., Geiser, L. H., and Hanks, K.: On-road emissions of ammonia: An underappreciated source of atmospheric nitrogen deposition, Sci. Total Environ., 625, 909–919, 2018.
Ferm, M.: Atmospheric ammonia and ammonium transport in Europe and critical loads: a review, Nutr. Cycl. Agroecosys., 51, 5–17, 1998.
Foley, K. M., Roselle, S. J., Appel, K. W., Bhave, P. V., Pleim, J. E., Otte, T. L., Mathur, R., Sarwar, G., Young, J. O., Gilliam, R. C., Nolte, C. G., Kelly, J. T., Gilliland, A. B., and Bash, J. O.: Incremental testing of the Community Multiscale Air Quality (CMAQ) modeling system version 4.7, Geosci. Model Dev., 3, 205–226, https://doi.org/10.5194/gmd-3-205-2010, 2010.
Galloway, J. N., Dentener, F. J., Capone, D. G., Boyer, E. W., Howarth, R. W., Seitzinger, S. P., Asner, G. P., Cleveland, C. C., Green, P. A., Holland, E. A., and Karl, D. M.: Nitrogen cycles: past, present, and future, Biogeochemistry, 70, 153–226, 2004.
Guenther, A. B., Jiang, X., Heald, C. L., Sakulyanontvittaya, T., Duhl, T., Emmons, L. K., and Wang, X.: The Model of Emissions of Gases and Aerosols from Nature version 2.1 (MEGAN2.1): an extended and updated framework for modeling biogenic emissions, Geosci. Model Dev., 5, 1471–1492, https://doi.org/10.5194/gmd-5-1471-2012, 2012.
Houyoux, M., Vukovich, J., and Brandmeyer, J. E.: Sparse Matrix Operator Kernel Emissions Modeling System-SMOKE User Manual, MCNC-2002, Environmental Modeling Center, Research Triangle Park, North Carolina, 2002.
IMPROVE: IMPROVE data, Interagency Monitoring of Protected Visual Environments (IMPROVE), available at: http://vista.cira.colostate.edu/Improve/improve-data/ (last access: 21 March 2017), 2011.
Jickells, T., Baker, A. R., Cape, J. N., Cornell, S. E., and Nemitz, E.: The cycling of organic nitrogen through the atmosphere, Philos. Trans. R. Soc. Lond. B Biol. Sci., 368, 20130115, https://doi.org/10.1098/rstb.2013.011, 2013.
Keiter, R. B. and Boyce, M. S.: The Greater Yellowstone Ecosystem: redefining America's wilderness heritage, Yale University Press, New Haven, CT, 428 pp., 1994.
Lee, H.-M., Paulot, F., Henze, D. K., Travis, K., Jacob, D. J., Pardo, L. H., and Schichtel, B. A.: Sources of nitrogen deposition in Federal Class I areas in the US, Atmos. Chem. Phys., 16, 525–540, https://doi.org/10.5194/acp-16-525-2016, 2016.
Li, Y., Schichtel, B. A., Walker, J. T., Schwede, D. B., Chen, X., Lehmann, C. M. B., Puchalski, M. A., Gay, D. A., and Collet Jr., J. L.: Increasing importance of deposition of reduced nitrogen in the United States, Proc. Natl. Acad. Sci. USA, 113, 5874–5879, 2016.
Li, Y., Thompson, T. M., Van Damme, M., Chen, X., Benedict, K. B., Shao, Y., Day, D., Boris, A., Sullivan, A. P., Ham, J., Whitburn, S., Clarisse, L., Coheur, P.-F., and Collett Jr., J. L.: Temporal and spatial variability of ammonia in urban and agricultural regions of northern Colorado, United States, Atmos. Chem. Phys., 17, 6197–6213, https://doi.org/10.5194/acp-17-6197-2017, 2017.
Lynch J., Pardo, L., and Huber C.: Detailed documentation of the CLAD U.S. Critical Loads of Sulfur and Nitrogen Access Database, version 2.5, available at: http://nadp.sws.uiuc.edu/committees/clad/db/ (last access: 21 February 2018), 2015.
Malm, W. C., Rodriguez, M. A., Schichtel, B. A., Gebhart, K. A., Thompson, T. M., Barna, M. G., Benedict, K. B., Carrico, C. M., and Collett Jr., J. L.: A hybrid modeling approach to estimating reactive nitrogen deposition in Rocky Mountain National Park, Atmos. Environ., 126, 258–273, 2016.
Mavko, M. and Morris, R.: DEASCO3 project updates to the fire plume rise methodology to model smoke dispersions, available at: http://wraptools.org/pdf/DEASCO3_Plume_Rise_Memo_20131210.pdf (last access: 21 February 2018), 2013.
Moore, C. T., Randall, D., Mavko, M., Morris, R., Koo, B., Fitch, M., George, M., Barna, M., Vimont, J., Anderson, B., and Acheson, A.: Deterministic and empirical assessment of smoke's contribution to ozone (DEASCO3), final report, Joint Fire Science, Program Project no. 11-1-6-6, available at: https://www.firescience.gov/projects/11-1-6-6/project/11-1-6-6_final_report.pdf (last access: 21 February 2018), 2012.
Nanus, L., McMurray, J. A., Clow, D. W., Saros, J. E., Blett, T., and Gurdak, J. J.: Spatial variation of atmospheric nitrogen deposition and critical loads for aquatic ecosystems in the Greater Yellowstone Area, Environ. Pollut., 223, 644–656, 2017.
NADP (National Atmospheric Deposition Program): Total Deposition 2015 Annual Map Summary. NADP Data Report 2016-02, Illinois State Water Survey, the University of Illinois at Urbana-Champaign, IL, availabe at: http://nadp.sws.uiuc.edu/committees/tdep/reports/TDEPreport15_Final.pdf (last access: 21 February 2018), 2016.
NOAA (National Oceanic and Atmospheric Administration): National Centers for Environmental Information, State of the Climate, Global Climate Report for Annual 2011, available at: https://www.ncdc.noaa.gov/sotc/global/201113 (last access: 1 September 2017), 2012.
NPS (National Park Service): Greater Yellowstone Ecosystem, https://www.nps.gov/yell/learn/upload/RI_2017_Ch3-GYE.pdf (last access: 21 February 2018), 2017.
Pardo, L. H., Fenn, M. E., Goodale, C. L., Geiser, L. H., Driscoll, C. T., Allen, E. B., Baron, J. S., Bobbink, R., Bowman, W. D., Clark, C. M., and Emmett, B.: Effects of nitrogen deposition and empirical nitrogen critical loads for ecoregions of the United States, Ecol. Appl., 21, 3049–3082, 2011.
Parisien, M. A., Snetsinger, S., Greenberg, J. A., Nelson, C. R., Schoennagel, T., Dobrowski, S. Z., and Moritz, M. A.: Spatial variability in wildfire probability across the western United States, Int. J. Wildland Fire, 21, 313–327, 2012.
Park, R. J., Jacob, D. J., Field, B. D., Yantosca, R. M., and Chin, M.: Natural and transboundary pollution influences on sulfate-nitrate-ammonium aerosols in the United States: Implications for policy, J. Geophy. Res., 109, D15204, https://doi.org/10.1029/2003JD004473, 2004.
Porter E., Blett T., Potter D. U., and Huber C.: Protecting resources on federal lands: implications of critical loads for atmospheric deposition of nitrogen and sulfur, BioScience, 55, 603–612, 2005.
Prenni, A. J., Levin, E. J. T., Benedict, K. B., Sullivan, A. P., Schurman, M. I., Gebhart, K. A., Day, D. E., Carrico, C. M., Malm, W. C., Schichtel, B. A., and Collett, J. L.: Gas-phase reactive nitrogen near Grand Teton National Park: Impacts of transport, anthropogenic emissions, and biomass burning, Atmos. Environ., 89, 749–756, 2014.
Reay, D. S., Davidson, E. A., Smith, K. A., Smith, P., Melillo, J. M., Dentener, F., and Crutzen, P. J.: Global agriculture and nitrous oxide emissions, Nat. Clim. Change, 2, 410–416, 2012.
Saros, J. E., Clow, D. W., Blett, T., and Wolfe, A. P.: Critical nitrogen deposition in high elevation lakes of the western US inferred from paleolimnological records, Water Air Soil Poll., 216, 193–202, 2011.
Schwede, D. B. and Lear, G. G.: A novel hybrid approach for estimating total deposition in the United States, Atmos. Environ., 92, 207–220, 2014.
Simon, H., Baker, K. R., and Phillips, S.: Compilation and interpretation of photochemical model performance statistics published between 2006 and 2012, Atmos. Environ., 61, 124–139, 2012.
Skamarock, W. C., Klemp, J. B., Dudhia, J., Gill, D. O., Barker, D. M., Duda, M. G., Huang, X., Wang, W., and Powers, J. G.: A description of the Advanced Research WRF Version 3, National Center for Atmospheric Research, Boulder, CO, NCAR/TN-475+STR, 2008.
Spaulding, S. A., Out, M. K., Wolfe, A. P., and Baron, J. S.: Paleolimnological records of nitrogen deposition in shallow high-elevation lakes of Grand Teton National Park, Wyoming, USA, Arct. Antarct. Alp. Res., 47, 703–717, 2015.
Sullivan, T. J., McDonnell, T. C., McPherson, G. T., Mackey, S. D., and Moore, D.: Evaluation of the Sensitivity of Inventory and Monitoring National Parks to Nutrient Enrichment Effects from Atmospheric Nitrogen Deposition, National Resource Report, NPS/NRPC/ARD/NRR-2011/308, 2011.
Sun, K., Tao, L., Miller, D. J., Khan, M. A., and Zondlo, M. A.: On-road ammonia emissions characterized by mobile, open-path measurements, Environ. Sci. Tech., 48, 3943–3950, 2014.
Sun, K., Tao, L., Miller, D. J., Pan, D., Golston, L. M., Zondlo, M. A., Griffin, R. J., Wallace, H. W., Leong, Y. J., Yang, M. M., and Zhang, Y.: Vehicle emissions as an important urban ammonia source in the United States and China, Environ. Sci. Tech., 51, 2472–2481, 2017.
Thompson, T. M., Rodriguez, M. A., Barna, M. G., Gebhart, K. A., Hand, J. L., Day, D. E., Malm, W. C., Benedict, K. B., Collett, J. L., and Schichtel, B. A.: Rocky Mountain National Park reduced nitrogen source apportionment, J. Geophys. Res., 120, 4370–4384, 2015.
UNC (University of North Carolina)-Chapel Hill and ENVIRON (ENVIRON International Corporation): Three-State Air Quality Modeling Study (3SAQS) – Weather Research Forecast 2011 Meteorological Model Application/Evaluation, available at: http://vibe.cira.colostate.edu/wiki/Attachments/Modeling/3SAQS_2011_WRF_MPE_v8_draft_Aug04_2014.pdf (last access: 21 February 2018), 2014a.
UNC (University of North Carolina)-Chapel Hill and ENVIRON (ENVIRON International Corporation): Three-State Air Quality Modeling Study (3SAQS) – Final modeling protocol: 2011 emissions & air quality modeling platform, available at: http://vibe.cira.colostate.edu/wiki/Attachments/Modeling/3SAQS_2011_WRF_MPE_v8_draft_Aug04_2014.pdf (last access: 21 February 2018), 2014b.
USGS (U.S. Geological Survey): Rocky Mountain Regional Snowpack Chemistry, Chemical Concentration Data, available at: https://co.water.usgs.gov/projects/RM_snowpack/ (last access: 21 February 2018), 2014.
Yu, S., Eder, B., Dennis, R., Chu, S.-H., and Schwartz, S. E.: New unbiased symmetric metrics for evaluation of air quality models, Atmos. Sci. Lett., 7, 26–34, 2006.
Yu, S., Mathur, R., Pleim, J., Wong, D., Gilliam, R., Alapaty, K., Zhao, C., and Liu, X.: Aerosol indirect effect on the grid-scale clouds in the two-way coupled WRF–CMAQ: model description, development, evaluation and regional analysis, Atmos. Chem. Phys., 14, 11247–11285, https://doi.org/10.5194/acp-14-11247-2014, 2014.
Warrach-Sagi, K., Schwitalla, T., Wulfmeyer, V., and Bauer, H. S.: Evaluation of a climate simulation in Europe based on the WRF–NOAH model system: precipitation in Germany, Clim. Dynam., 41, 755–774, 2013.
Wen, D., Zhang, L., Lin, J. C., Vet, R., and Moran, M. D.: An evaluation of ambient ammonia concentrations over southern Ontario simulated with different dry deposition schemes within STILT-Chem v0.8, Geosci. Model Dev., 7, 1037–1050, https://doi.org/10.5194/gmd-7-1037-2014, 2014.
Westerling, A. L. and Swetnam, T. W.: Interannual to decadal drought and wildfire in the western United States, EOS T. Am. Geophys., 84, 545–555, 2003.
Whaley, C. H., Makar, P. A., Shephard, M. W., Zhang, L., Zhang, J., Zheng, Q., Akingunola, A., Wentworth, G. R., Murphy, J. G., Kharol, S. K., and Cady-Pereira, K. E.: Contributions of natural and anthropogenic sources to ambient ammonia in the Athabasca Oil Sands and north-western Canada, Atmos. Chem. Phys., 18, 2011–2034, https://doi.org/10.5194/acp-18-2011-2018, 2018.
Zhang, L., Brook, J. R., and Vet, R.: A revised parameterization for gaseous dry deposition in air-quality models, Atmos. Chem. Phys., 3, 2067–2082, https://doi.org/10.5194/acp-3-2067-2003, 2003.
Zhang, L., Wright, L. P., and Asman, W. A. H.: Bi-directional air-surface exchange of atmospheric ammonia: A review of measurements and a development of a big leaf model for applications in regional scale air quality models, J. Geophys. Res., 115, D20310, https://doi.org/10.1029/2009JD013589, 2010.
Zhang, L., Jacob, D. J., Knipping, E. M., Kumar, N., Munger, J. W., Carouge, C. C., van Donkelaar, A., Wang, Y. X., and Chen, D.: Nitrogen deposition to the United States: distribution, sources, and processes, Atmos. Chem. Phys., 12, 4539–4554, https://doi.org/10.5194/acp-12-4539-2012, 2012.
Zhang, R., Thompson, T. M., Barna, M. G., Hand, J. L., McMurray, J. A., Bell, M. D., Malm, W. C., and Schichtel, B. A.: Model data associated with manuscript: “Source regions contributing to excess reactive nitrogen deposition in the Greater Yellowstone Area (GYA) of the United States”, https://hdl.handle.net/10217/191136, last access: 5 September 2018.
Zhang, Y., Olsen, K. M., and Wang, K.: Fine scale modeling of agricultural air quality over the southeastern United States using two air quality models, Part I. Application and evaluation, Aerosol Air Qual. Res., 13, 1231–1252, 2013.
Zhu, L., Henze, D. K., Bash, J. O., Cady-Pereira, K. E., Shephard, M. W., Luo, M., and Capps, S. L.: Sources and impacts of atmospheric NH3: Current understanding and frontiers for modeling, measurements, and remote sensing in North America, Curr. Pollut. Rep., 1, 95–116, 2015.
- Abstract
- Introduction
- Modeling system for Nr source apportionment
- Evaluation of CAMx-simulated Nr concentration and deposition rates
- Source apportionment of Nr deposition over the GYA in 2011
- The influence of model bias on source apportionment results
- Summary and discussion
- Data availability
- Author contributions
- Competing interests
- Acknowledgements
- References
- Supplement


