the Creative Commons Attribution 4.0 License.
the Creative Commons Attribution 4.0 License.
Modeling study of impacts on surface ozone of regional transport and emissions reductions over North China Plain in summer 2015
Xiao Han
Lingyun Zhu
Shulan Wang
Xiaoyan Meng
Jun Hu
Tropospheric ozone (O3) has replaced PM2.5 or PM10 as the primary pollutant in the North China Plain (NCP) during summer in recent years. A comprehensive understanding of O3 production in response to the reduction of precursor emissions over the NCP is urgently demanded for effective control policy design. In this study, the air quality modeling system RAMS-CMAQ (Regional Atmospheric Modeling System–Community Multiscale Air Quality), coupled with the ISAM (Integrated Source Apportionment Method) module is applied to investigate the O3 regional transport and source contribution features during a heavy O3 pollution episode in June 2015 over the NCP. The results show that emissions sources in Shandong and Hebei were the major contributors to O3 production in the NCP. Not only the highest local contribution of O3 mass burden but also more than 30 % contribution of O3 mass burdens in Beijing and Tianjin came from the emissions sources in these two provinces, respectively. Conversely, the urban areas and most O3-polluted regions of the NCP were mainly dominated by conditions sensitive to volatile organic compounds, while “both control” and NOx-sensitive conditions dominated the suburban and remote areas, respectively. Then, based on the sensitivity tests, the effects of several hypothetical scenarios of emissions control on reducing the O3 pollution were compared and discussed. The results indicated that the emissions control of industry and residential sectors was the most efficient method if the emissions reduction percentage was higher than 40 %. However, when the emissions reduction percentage dropped below 30 %, the power plant sector could make significant contributions to the decrease in O3. The control strategies should be promptly adjusted based on the emissions reduction, and the modeling system can provide valuable information for precisely choosing the emissions sector combination to achieve better efficiency.
- Article
(2822 KB) - Full-text XML
- BibTeX
- EndNote
In addition to the downward injection of stratospheric ozone (O3), tropospheric O3 is formed via a suite of photochemical reactions involving nitrogen oxides (NOx), volatile organic compounds (VOCs), and sunlight. O3 plays an important role in controlling the chemical composition and climate of the troposphere and harms vegetation and human health, especially in industrialized regions (Kleinman et al., 2002). In recent years, the emissions of O3 precursors, NOx and VOCs, have increased substantially due to economic growth, rapid population expansion, and urbanization in the North China Plain (NCP). During the summer, PM2.5 and PM10 are replaced by O3 as the primary pollution type in major urban areas (China Environmental Status Bulletin, 2015).
Numerous studies have investigated the spatial and temporal distribution characteristics of O3 in the NCP. Lin et al. (2008) analyzed 3-year observation data for the O3 mixing ratio at a remote Global Atmosphere Watch site near Beijing and showed the seasonal variation features of the O3 background value for the NCP. Tang et al. (2012) gathered 2-year observation data of the O3 mixing ratio for 22 sites (located in urban, rural, and coastal areas) during a field campaign in the NCP and coupled the data with the meteorological parameters from the Weather Research and Forecasting model. The spatial and temporal variations in O3 were thoroughly analyzed, and the O3–NOx–VOC sensitivity was initially investigated in this study. Ran et al. (2012) and Dufour et al. (2010) compared the O3 seasonal variation features in megacities between the NCP and southern China. Conversely, several studies have applied the chemistry transport model system to reproduce the three-dimensional O3 continuous distribution characteristic and discussed the sensitivity of O3 to precursor emissions (Wang et al., 2012; Nie et al., 2014).
Because of the strong emissions of air pollutants, widespread haze clouds caused by serious air pollution have occurred frequently over the NCP (Tao et al., 2012; Wang et al., 2013; Li et al., 2016; Zhou et al., 2017). Aiming to solve this problem, the government has executed strict emissions control strategies in recent years (Gao et al., 2016), which have yielded an initial effect. As reported by the China Environmental Status Bulletin, the mass loadings of sulfur dioxide (SO2), NO2, PM2.5, and PM10 steadily fell from 2013 to 2015. However, O3 has become the only pollutant whose mass burden has continued to increase in the 74 experimental cities of China, and the mass concentration is expected to continue increasing (Deng et al., 2011). Therefore, there is an urgent need to prevent environmental and health hazards in the NCP resulting from surface O3.
As a secondary pollutant, although the basic features of surface O3 in the NCP are well known from measurement or modeling studies, understanding the chemical links between O3 and its two main precursors, NOx and VOC, is important for designing effective pollution reduction strategies (Castell et al., 2009). The chemical transport model is an indispensable method for resolving the above issue, as it can quantify the main physical and chemical mechanisms of pollutant formation and transport. Liu et al. (2010) used two process analysis modules (integrated process rates and integrated reaction rates) embedded in CMAQ to capture the dynamical and photochemical processes of O3 formation in 2008 over China. As a result, the influence and contribution of each important process can be distinguished and quantified. Tang et al. (2017) also used the integrated process rate module for measurement data from a set of observation stations to evaluate the sensitivity of O3 production in June 2008 over the NCP. Xing et al. (2011) developed a statistical response surface method that aimed at investigating ozone sensitivities to NOx and VOC emissions changes and coupled it with CMAQ to analyze O3 sensitivities to NOx and VOC emissions changes in 2005 over eastern China. The overall impacts from individual sources, including regional NOx and VOC emissions sources, have been evaluated using this modeling system. Li et al. (2008) applied a tagged tracer method to the framework of NAQPMS to identify the transport contributions from various O3 production regions to total O3 levels in 2008 over central eastern China. This method can be used to eliminate the errors caused by nonlinearities in the transport and fast photochemistry of O3 and its precursors.
In general, the substantial features of O3 formation sensitivity and the contributions of regional-scale transport have been discussed in these studies. However, more work needs to be done to achieve a comprehensive understanding of O3 behavior over the NCP, especially the source contribution approaches of recent years. In this study, an air quality modeling system called RAMS-CMAQ (Regional Atmospheric Modeling System–Community Multiscale Air Quality) that is coupled with the ISAM (Integrated Source Apportionment Method) module is applied to estimate the regional contributions of O3 among major regions of the NCP and to quantify the relative amount of O3 originating from specific VOC and NOx emissions sources. A unique method that can distinguish the O3–NOx–VOC sensitivity features is also used to identify the precursor sensitivity regions and verify the results of the ISAM. In addition, the brute-force method is applied to investigate the effect of reducing anthropogenic emissions on the O3 mass burden. Therefore, the precursor control type and contribution from specific geographic areas and emissions sectors can be obtained, and some valuable information can be provided for control strategies in the NCP.
CMAQ (version 5.0.2), released in April 2014 by the U.S. EPA (https://www.airqualitymodeling.org/index.php?title=CMAQ_version_5.0.2_(April_2014_release)_Technical_Documentation&oldid=587, last access: 23 October 2015), was applied over the NCP for 2-month simulations in January and June 2015. Several updates and revisions, such as the chemical process corresponding to NH3 and SO2 and the secondary aerosol formation of SOA (secondary organic aerosol) and nitrate, have been added in this version. The updated and expanded version of the Carbon Bond Mechanism (CB05) (Sarwar et al., 2008) and the sixth-generation modal CMAQ aerosol model (AERO6) were applied to simulate the gas-phase chemistry mechanisms and formation and the dynamic processes of aerosols, respectively. The ISORROPIA model (version 1.7) was used to describe the thermodynamic equilibrium of gas–particle transformation (Nenes et al., 1999). The highly versatile RAMS numerical code (Cotton et al., 2003), which can simulate the boundary layer and the underlying surface well, is utilized to provide the meteorological fields for CMAQ. The mechanisms of SOA formation and online dust emissions were modified for improving the simulation ability in China (Han et al., 2012; J. Li et al., 2017), and the information of underlying surface in China was also updated (Chen et al., 2018).
The anthropogenic emissions of major pollution species (NOx, SO2, VOCs, black carbon, organic carbon, primary PM2.5, and PM10) were obtained from the monthly-based emissions inventory, with horizontal resolution and four categories (industry, power, transport, and residential), which were developed to support the Model Intercomparison Study Asia (M. Li et al., 2017). The original version of this emissions inventory was developed for Asia as a contribution to the TRACE-P (Transport and Chemical Evolution over the Pacific) mission and ACE-Asia (Asian Pacific Regional Aerosol Characterization Experiment) (Streets et al., 2003). Additionally, the NOx and NH3 emissions from soil and natural hydrocarbon emissions were obtained from the Global Emissions Inventory Activity global monthly inventory (Benkovitz et al., 1996). The Global Fire Emissions Database, version 3 (FGEDv3.0; van der Werf et al., 2010), was applied to provide the biomass burning emissions from wildfires, savanna burning, and slash-and-burn agriculture. The VOCs and nitrogen oxides from flight exhaust, lighting, paint, fossil fuel, and other sectors were obtained from the Regional Emission Inventory in Asia (REAS, version 2, Kurokawa et al., 2013) and the emissions database for global atmospheric research (Olivier et al., 1994), respectively.
The ISAM module was used to track O3 from different geographic regions and source types. This source apportionment tool was developed from the TSSA (tagged species source apportionment; Wang et al., 2009) in an early version of the CMAQ model. Compared with the previous version, the ISAM improved the approach for the advection of tagged tracers and the tracking of precursor reactions and increased the flexibility of the application by minimizing the amount of data preparation (Kwok et al., 2013). An updated piecewise parabolic algorithm was applied to reasonably estimate the major dynamics processes, including advection transport, vertical diffusion, and dry deposition. For the nonlinear gas-phase chemical interactions, which are important for O3 formation, a hybrid approach that employs the direct sensitivity methods as linear equations using lower and upper triangular matrices, which is known as LU decomposition (Yang et al., 1997), was applied for description. In addition, the ISAM uses two tracers for individual nitrogen and VOC species to represent the O3 chemical formation regime attributed to either NOx or VOC emissions sources. As described by Kwok et al. (2015), the total concentration of O3 in each model grid cell is equal to the sum of O3 tracers that were produced in either VOC- or NOx-sensitive conditions:
where O3Vtag and O3Ntag are the VOC-sensitive and NOx-sensitive O3 (VS and NS, respectively) attributed to each tag source, respectively. Therefore, the contribution from VOCs or NOx can be tracked individually, and the precursor control types in each grid can be deduced. Detailed information regarding the ISAM can be found in Kwok et al. (2013).

Figure 1The model domain of this study, and the geographic locations of Beijing, Tianjin, Tangshan, Hebei, Shijiazhuang, Shanxi, Shandong, Jinan, and Henan.
The simulation has two layer grids. The coarse domain covers East Asia (Fig. 1, D1), with a horizontal grid spacing of 64 km and a total area of 6654 km × 5440 km, and an inner domain (Fig. 1, D2) with a 16 km × 16 km resolution is two-way nested with the outer one. The inner domain covers the major regions of the NCP, including the megacity of Beijing, Tianjin, the capital city of Shijiazhuang Province, Jinan, the industrial town of Tangshan, and Hebei, Shandong, and Shanxi provinces. The simulation used 15 vertical levels, of which nearly half were concentrated in the lowest 2 km, to improve the simulation of the atmospheric boundary layer. Numerous previous studies have demonstrated that this modeling system performs well in simulating the pollutant mass concentrations (Zhang et al., 2006; Han et al., 2014, 2016).
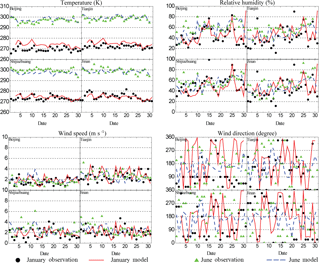
The meteorological parameters, such as the temperature and wind field, are important impact factors of ozone formation and transport. Therefore, the daily average temperature, relative humidity, wind speed, and maximum wind direction in January and June 2015 were compared with the surface observation data (released by the Chinese National Meteorological Center: http://data.cma.cn/, last access: 12 August 2018) for Beijing, Tianjin, Shijiazhuang, and Jinan. The comparison results are shown in Fig. 2. The modeled temperature and relative humidity are shown to generally coincide with the observations at all four of these stations, except that some of the extreme high or low values appeared abruptly. The modeled wind speed, which could reproduce the higher value in Tianjin and Jinan and lower value in Beijing and Shijiazhuang, also followed the magnitude of observations well. However, a direct comparison between observed and modeled data is difficult, especially for the wind direction. In addition to the obvious impact of surrounding surface at each measurement station, the time resolutions between observation (10 min mean) and model output (1 h) were also different. Nevertheless, the north wind in winter and south wind in summer were generally captured by the simulation results for all stations.
Table 1Statistical summary of the comparisons of the hourly NO2 comparison between simulation and observation.
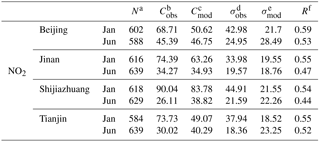
a Number of samples. b Total mean of observation. c Total mean of simulation. d Standard deviation of observation. e Standard deviation of simulation. f Correlation coefficient between daily observation and simulation.
Table 2Statistical summary of the comparisons of the hourly O3 comparison between simulation and observation.
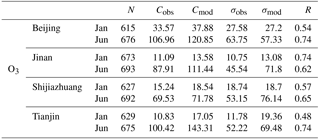
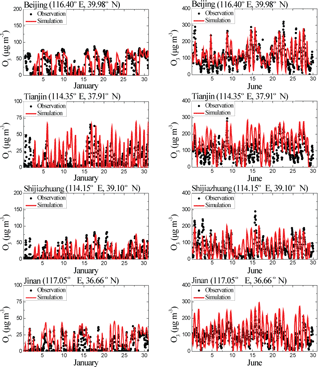
The modeled mass concentrations of O3 and one of its precursors (NO2) were compared with the hourly observation data from the Ministry of Environmental Protection of China; the results are shown in Figs. 3 and 4. The statistical parameters mean, standard deviation, and correlation coefficient between the observations and simulations are listed in Tables 1 and 2. The nitrogen oxide and tropospheric ozone were two kinds of typical trace gases with high chemical activity and relatively short lifetimes. The diurnal change in Figs. 3 and 4 is obvious, and the distinctive values of the mass concentrations among different seasons can also be found. The simulation results also reproduced these important features, especially the evident diurnal variation in O3, at these four stations. The mass concentration of O3 in summer was generally higher than that in winter because of the strong photochemistry during the daytime in summer. Conversely, the metrics listed in Tables 1 and 2 were used to evaluate the model performance, following the study of Yu et al. (2006). Most of the correlation coefficients were higher than 0.5 for NO2 and 0.6 for O3, which indicates that the model performed well in reproducing the observation trend. The simulation results were able to capture most of the pollution episodes during these two months. In addition, the standard deviations between the observation and simulation of NO2 and O3 were also similar in most cases. Most of the mean NO2 concentrations of the simulation were generally similar with those of the observation in June, but about 25 µg m−3 lower at Tianjin in January. As shown in Fig. 3, the model missed some of the high values of observation that appeared during the first half of January. The largest deviation of the modeled O3, for which the mean mass burden was obviously higher than that of the observation and the correlation coefficient was just 0.48, also appeared at Tianjin in January. Yu et al. (2010) reported similar results and noted that the model might not resolve the titration by NO in an urban area under a low O3 mass burden background well by applying both the CB05 and SAPRC-99 mechanisms. Nevertheless, the comparison generally showed that the model could basically reproduce the meteorological field and mass concentration of and trends in O3 and its precursor NO2 during different seasons over the NCP.
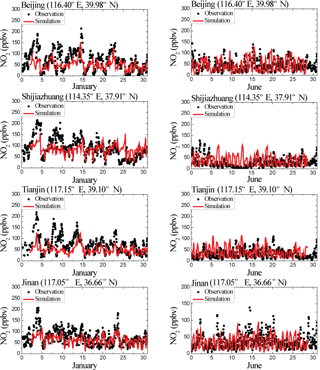
Figure 3Observed (black circles) and modeled (red solid lines) hourly mass concentrations (µg m−3) of NO2 at Beijing, Shijiazhuang, Tianjin, and Jinan in January and June 2015.
The surface spatial distributions of the monthly average values of the modeled NOx, VOCs, and maximum daily 8 h average O3 mass concentration (8 h-O3) for January and June 2015 are shown in Fig. 5. The monthly average wind field is also shown. The diffusion condition is shown to have been weak due to the obviously smaller wind speed over Beijing, Tianjin, Hebei, Shandong, and northern Henan in both January and June. In addition to the strong emissions, the weak diffusion condition should be the main reason for the high mass burden of NOx and VOCs in these regions. In addition, the maximum values were mainly concentrated in the urban areas of the NCP during these two months, including the following five major pollution cities: Beijing, Tianjin, Shijiazhuang, Jinan, and Tangshan. However, the distribution patterns between O3 and the precursors were significantly different, which indicates that the formation and transport processes of O3 should be complex in the NCP. Unlike the seasonal variation in NOx and VOCs, the mass burden of O3 in summer was obviously higher than that in winter because of the stronger photochemical activity. The 8 h-O3 mass concentration, which exceeded the Grade II standard (160 µg m−3), was widespread throughout southern Beijing, Hebei, and almost all of Tianjin and Shandong, with values reaching 180–200 µg m−3 in the tri-province area of Hebei, Shandong, and Henan in June. The serious O3 pollution was mainly concentrated in the northwest part of Shandong Province.
Table 3The regional transport contributions of O3 mass concentration in Beijing, Tianjin, Hebei, Shandong, and Shanxi as well as boundary conditions (BCON), initial conditions (ICON), and other sources (nature sources).

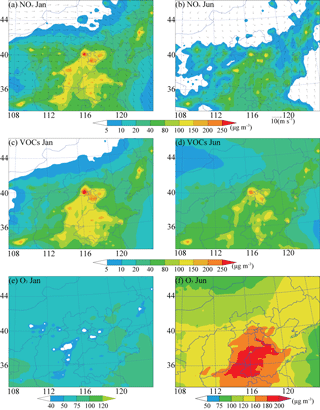
Figure 5The surface spatial distributions of monthly average NOx (a–b) and VOCs (c–d), and maximum daily 8 h-O3 (e–f) in January and June 2015.
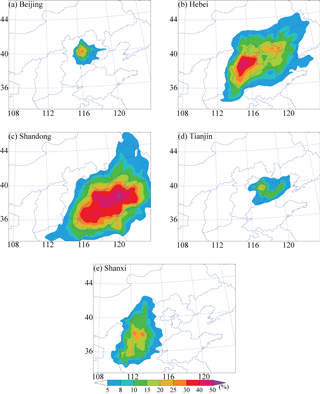
The contribution of O3 from the major NCP regions, including Beijing, Hebei, Shandong, Tianjin, and Shanxi, was calculated using ISAM–CMAQ–RAMS; the results are shown in Fig. 6 (NS) and Fig. 7 (VS). The total percentage can be obtained by summing the contributors of NS and VS and is shown in Table 3. The distribution patterns of NS and VS contributions were generally similar to each other. The mass contribution of O3 in Shandong, Hebei, and Shanxi was mainly provided by local anthropogenic sources, and the local contribution could reach 36.6 %, 53.6 %, and 45.0 %. However, the local sources did not provide the primary contributions in Beijing (23.1 %) and Tianjin (14.9 %), and the regional transport contributions from Hebei and Shandong could reach 35.2 % and 37.3 % in these two cities, respectively. This feature clearly indicates that the regional transport of precursors should be an important factor of O3 pollution in Beijing and Tianjin. The contribution from Shanxi to other regions was very small due to the hindrance to pollutant transport caused by the Taihang Mountains, which are located to the east of Shanxi Province. The contribution from other regions to Shanxi was also very low as shown in Table 3. In addition, the contribution from Shandong provided at least more than 65 % to the mass burden of O3 in the Bohai Sea. This feature explains the source of the large value that appears over this area in Fig. 4. Conversely, the contribution of VS was obviously higher than that of NS in Beijing, Tianjin, Hebei, and Shandong (BTHS). Compared with the NS, the percentage of VS was generally double in Beijing and Tianjin and more than 10 % higher in all of Shandong and the southern part of Hebei. In contrast, the contribution of NS was clearly higher than that of VS in Shanxi, which means that the major role of the O3 formation in Shanxi should be different from that in other regions.
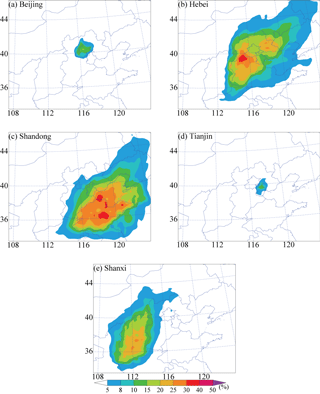
Figure 6The regional contribution of NOx-sensitive O3 from (a) Beijing, (b) Hebei, (c) Shandong, (d) Tianjin, and (e) Shanxi in June 2015.
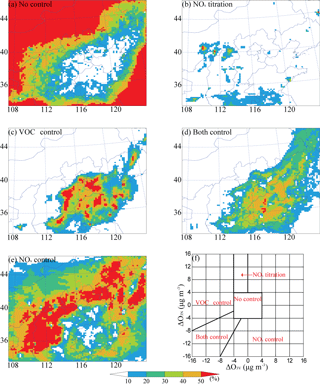
To distinguish the O3–NOx–VOC sensitivity features, a method that is suitable for the results of three-dimensional chemistry transport models was applied to identify the precursor sensitivity regions in the NCP. In addition to the base case, two sensitivity tests, which reduced 30 % of the VOC emissions and 30 % of the NOx emissions within the entire model domain, were conducted. Then the deviation of the maximum daily 8 h-O3 between the base case and these two sensitivity tests could be utilized to determine the precursor control types in each grid. Here, we used ΔO3V and ΔO3N to represent the variation in the mass concentration of O3 due to the reduction in VOC or NOx emissions, respectively (Sillman and He, 2002; Sillman and West, 2009): (1) if the changes in ΔO3V and ΔO3N were both less than 4 µg m−3, this grid was likely controlled by neither NOx nor VOCs; (2) if ΔO3N increased to a value greater than 4 µg m−3 and ΔO3V decreased to a value less than 4 µg m−3, this grid should be regarded as “NOx titration”; (3) if ΔO3V decreased by more than 4 µg m−3, with this reduction being twice as large as the ΔO3N reduction (or ΔO3N increase), this grid was likely controlled by VOCs; (4) if ΔO3N decreased by more than 4 µg m−3, with the reduction being twice as large as the ΔO3V reduction, this grid was likely controlled by NOx; (5) if ΔO3N and ΔO3V both decreased by more than 4 µg m−3 and the ratio between them was less than 2:1 or 1:2, this grid was likely controlled by both NOx and VOCs. Details regarding the identification explained above can be found in Fig. 8f. The frequency of precursor control types in each grid in June was determined and is shown in Fig. 8a–e. The NOx titration scarcely appeared in the model domain. The frequency of the “no control” type entirely exceeded 50 % over the background regions when the O3 mass burden was lower than 120 µg m−3 and gradually decreased as the O3 mass burden increased. Over the O3 pollution areas, a grid with a no-control-type frequency higher than 10 % was seldom found. Specific to the considered regions, the urban areas of Beijing, Tianjin, Tangshan, southern Hebei, and northern and western Shandong were mainly under VOC control, while the outer suburb of Beijing, all of Shanxi, and northern Hebei were mainly under NOx control. The “both control” type generally appeared in the transitional zone between NOx and VOC control. Compared with the results shown in Figs. 6 and 7, the distribution feature of NOx and VOC contributions highly coincided with that of the O3 precursor sensitivity types, which demonstrated that this method is reliable.
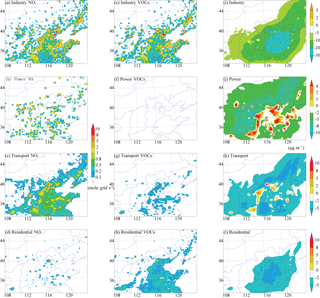
Figure 9Distributions of the emissions flux of NOx and VOCs and the variation in mass concentration of 8 h-O3 associated with the ZI, ZP, ZT, and ZR in June.
In addition to the contribution feature of emissions sources estimated using the ISAM, the effect of reducing anthropogenic emissions on the O3 mass burden was also necessary to learn because the formation of O3 from NOx and VOC emissions is a typical nonlinear process. The brute-force method, which can realistically capture the nonlinear processes of secondary pollutant formation, was applied. Therefore, several sensitivity tests were designed, as shown in Table 4. First, the zero-out (100 % source removal) simulations of four major sectors, i.e., industry, power plants, transport, and residential (sensitivity tests ZI, ZP, ZT, and ZR, respectively), were conducted to evaluate the efficiency of emissions reduction for different sources in the NCP. Figure 9 presents the results of the brute-force sensitivity tests and the NOx and VOC emissions flux of each major sector. The removal of the industry sector is shown to have been the most efficient way to decrease the O3 mass burden, and the variation in 8 h-O3 between 20 and 30 µg m−3 was generally concentrated in the high mass concentration regions. The main reason is likely that the VOC emissions flux of the industry sector was significantly higher than that of the other sectors. Removal of the residential sector could also decrease the O3 mass burden in most of the VOC control regions due to its VOC emissions flux being notably higher than that of NOx. In contrast, removal of the transport and power plant sectors could not effectively reduce the O3 mass burden and even increased the mass burden in high-pollution areas, such as southern Beijing, Tianjin, Tangshan, southern Hebei, Jinan, and other parts of Shandong. The NOx emissions flux of these two kinds of sectors was clearly higher than that of VOCs, especially for the power plant sector. It also caused the 8 h-O3 mass burden to decrease by 5–10 µg m−3 in Shanxi as a result of the removal of the power plant sector. It can be deduced that the ambient NOx mass burden should be plentiful and restrained the O3 formation because of the reaction below:
Therefore, the environmental condition would benefit the O3 formation when the NOx mass burden decreases due to power plant or transport sector removal. In summary, if we focus on the major pollution regions of the NCP, including BTHS, reduction of the industry and residential emissions sectors should be an effective way to control the O3 mass burden during heavy O3 pollution episodes.
In addition, the realistic pollution control strategies are supposed to be applied to a specific sector in the high-emissions regions (HERs) and used to develop a comprehensive reduction scheme; thus, a detailed analysis is necessary to investigate more accurate and practical strategies. Other than applying the simple zero-out sensitivity test over entire objective regions, we selected the regions that include cities and towns with a high anthropogenic emissions flux in the BTHS region to more accurately match real emissions control. Figure 10 presents the selected regions and the emissions flux of NOx and VOCs from the industry sector, residential sector, and multiple combinations. First, the change in 8 h-O3 mass concentration associated with the anthropogenic emissions in selected regions (Fig. 10i and j) was compared with that in the entire BTHS region (sensitivity tests A20 %-HERs and A20 %-BHTS), as shown in Fig. 11a and b. The distribution patterns of the 8 h-O3 mass burden variation were notably similar to each other, and the positive and negative values generally appeared in the same regions. However, the negative value in Fig. 11b was clearly higher than that in Fig. 11a. This disparity indicates that significant overestimation of the O3 mass burden variation might occur when we conduct a brute-force sensitivity test with broad reductions in emissions in the entire objective region.
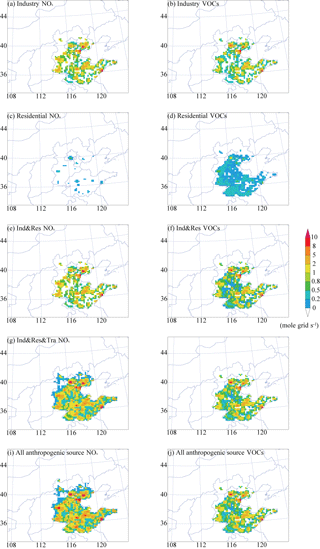
Figure 10Distributions of the NOx and VOC emissions flux from different sectors or combinations in the high-emissions regions of Beijing, Tianjin, Hebei, and Shandong in June.
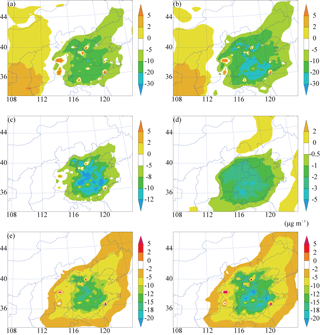
Figure 11Distributions of the variation in 8 h-O3 mass concentration associated with brute-force sensitivity tests: (a) A20 %-HER, (b) A20 %-BHTS, (c) I20 %-HER, (d) R20 %-HER, (e) IR20 %-HER, and (f) ITR20 %-HER.
According to the results of the zero-out sensitivity tests, the industry and residential sectors were the major emissions sources of O3, while the power plant sector did not benefit O3 formation. Thus, the effects of reducing these industry and residential sectors were estimated using the brute-force method with 20 % emissions intensity in the selected regions of BTHS (Fig. 10a and b). Figure 11c and d show the variation in O3 associated with the industry and residential emissions sectors (sensitivity tests I20 %-HER and R20 %-HER), respectively. The 8 h-O3 mass concentration could decrease by 10–12 µg m−3 in most of Shandong, especially in the strong polluted regions shown in Fig. 11c. In contrast, the value slightly increased in the urban areas of Shijiazhuang, Tianjin, and Tangshan. In Fig. 5f, the 8 h-O3 mass burden was relatively lower in these regions. Thus, the O3 mass burden can be decreased rapidly by controlling the industry emissions under a heavy O3 pollution background. Figure 11d shows that the 8 h-O3 mass concentration decreased overall in BTHS, though the range was only 1–5 µg m−3. The likely main reason is that the emissions of VOCs were higher than those of NOx from the residential sector, while the emissions intensity from the residential sector was relatively lower than that from industry. The mass burden of O3 can also be reduced by controlling the residential emissions in the urban areas of Shijiazhuang, Tianjin, and Tangshan.
In addition, the influence of different combinations of emissions sectors in BTHS was discussed. Figure 11e and f present the change in 8 h-O3 mass concentration associated with a 20 % emissions intensity for both the industry and residential sectors (sensitivity test IR20 %-HERs) and the industry, transport, and residential sectors (sensitivity test ITR20 %-HERs). The O3 mass burden generally decreased sharply in BTHS, as shown in Fig. 11e, especially in the region of Shandong with heavy pollution. The range and magnitude of decrease can obviously be enhanced while considering the reduction of the transport sector, as shown in Fig. 11f. Notably, the mass concentration of 8 h-O3 could decrease from 180–200 to 160–180 µg m−3 in the polluted regions of BTHS. Compared with the zero-out sensitivity test in Fig. 9, the decrease in 8 h-O3 mass burden in Fig. 11f was still clearly lower than that of ZI. This deviation indicates that the contribution source from other regions except BTHS should also be important. Even though 80 % of the emissions intensity was removed, the reduction in 8 h-O3 mass concentration still barely exceeded 20 µg m−3 in the NCP, as shown in Fig. 11c, d, and e, which means that it was difficult to keep the O3 mass burden under the Grade II standard by controlling only the industry and residential emissions sectors in HERs.
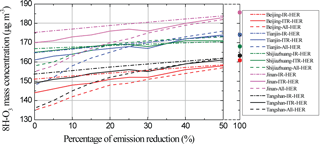
Figure 12The variation in regional average 8 h-O3 mass concentrations in Beijing, Tianjin, Shijiazhuang, Jinan, and Tangshan with reduction of the industry and residential sectors (IR), reduction of the industry, transport, and residential sectors (ITR), and all emissions.
Therefore, more brute-force sensitivity tests with HER emissions varying from 50 % to 0 % were conducted. The regional average 8 h-O3 mass concentrations in Beijing, Tianjin, Shijiazhuang, Jinan, and Tangshan with changes in emissions are shown in Fig. 12. Three series of sensitivity tests were conducted: reduction of the IR (industry and residential), ITR (industry, transport, and residential), and all (industry, transport, power plant, and residential) emissions sectors. As shown, the 8 h-O3 mass concentration was higher than 160 µg m−3 in all five cities, while the emissions percentage was 100 %. When the emissions decreased to 50 %, the 8 h-O3 mass concentrations of these three series slightly decreased for Beijing, Tianjin, Tangshan, and Jinan but increased for Shijiazhuang. The decrease in 8 h-O3 mass concentration as a result of reducing the IR emissions was similar to that of the ITR emissions when the emissions were reduced from 50 % to 40 % for all five cities but was not significant when the reduction was less than 40 %. The lines corresponding to the ITR and all emissions sectors generally decreased coherently for these five cities when the emissions were reduced from 50 % to 30 %. However, the effect of the ITR reduction was obviously weaker than that of the all reduction when the reduction was less than 30 %. The decrease in 8 h-O3 mass burden exceeded 12 µg m−3 when the all emissions reduction was least, and the air quality in all five of these cities could reach the Grade II standard. This phenomenon indicated that the influence of the transport and power plant emissions sectors on the decrease in O3 mainly occurred after removing 60 % of the IR or 70 % of the ITR emissions intensity. Thus, an emissions control sequence for different sectors should be considered when exploring more effective strategies.
In this study, an air quality modeling system referred to as RAMS-CMAQ was applied to simulate the O3 mass concentration, and several sensitivity tests were conducted to investigate the O3 pollution and to discuss the relationship between O3 production and emissions contributions over the NCP in January and June of 2015. First, the modeled daily meteorological factors (temperature, relative humidity, and wind field) and hourly mass concentrations of O3 and its precursor NO2 were compared with ground-based observation data to evaluate the accuracy and reliability. The simulation results were generally good and able to broadly capture the values of and variation trend in the observation data. Focusing on the heavy O3 pollution period in June, an advanced source apportionment tool called ISAM was coupled with RAMS-CMAQ and applied to estimate the regional transport contributions, with individual tracers for nitrogen and VOC species used to represent the O3 chemical formation regime attributed to either NOx or VOC emissions sources in the NCP. Then a unique method that is suitable for three-dimensional chemistry transport models was used to distinguish the O3–NOx–VOC sensitivity features and identify the precursor sensitivity in each grid of the model domain. Therefore, the O3 mass burden sensitivities to NOx and VOC emissions changes and the correlative regional transport contribution features among major anthropogenic source regions in the NCP can be clearly investigated using these methods. In addition, several brute-force sensitivity tests were conducted to discuss the role of the main anthropogenic emissions sectors in reducing the O3 mass burden, and an attempt was made to provide valuable suggestions for exploring more effective strategies for preventing O3 pollution. The results are summarized as follows.
-
The simulation results show that the seasonal variation in O3 was significant and that the heavy mass burden of 8 h-O3, which exceeded the Grade II standard, generally occurred in southern Beijing, Hebei, and almost all of Tianjin and Shandong in June. The mass burden of 8 h-O3 reached 180–200 µg m−3, mainly in the tri-province area of Hebei, Shandong, and Henan. The distribution pattern and seasonal variation in 8 h-O3 were obviously different from those of its precursors, which indicates that the formation and transport processes of O3 should be complex in the NCP.
-
The results of RAMS-CMAQ–ISAM show that the emissions sources in Shandong and Hebei were the major contributors to O3 production in the NCP. In addition to these two provinces, the O3 mass burden in Beijing and Tianjin was also significant. The emissions from Hebei and Shandong contributed 15 %–20 % and 5 %–10 % to Beijing and 10 %–20 % and 15 %–20 % to Tianjin. However, the O3 mass burden in these two provinces was generally contributed by the provinces themselves. The results also show that the contribution of VS was clearly higher than that of NS in BTHS, which indicates that the O3 mainly originated from VOC emissions sources. Conversely, the emissions sources in Shanxi Province almost had no impact on the O3 mass burden in other regions of the NCP due to the hinderance to pollutant transport provided by the Taihang Mountains.
-
The results of identification of the O3–NOx–VOC sensitivity feature show that the VOC control mainly occurred over all of Tianjin and Tangshan and southern Beijing (urban area) and Hebei, where the O3 mass concentration reached 160–180 µg m−3. The north central part of Shandong and the urban area of Jinan were also mainly under VOC control. The frequencies of VOC control and the both control type were generally equal in the region of Hebei and Shandong, where the O3 mass concentration reached 180–200 µg m−3. The NOx control generally appeared in the regions of the NCP where the O3 mass concentration reached 120–160 µg m−3. In the major cities with O3 pollution, including Beijing, Tianjin, Shijiazhuang, and Jinan, the O3–NOx–VOC sensitivity feature was the same: VOC control dominated the urban area, while both control and NOx control dominated the suburban and remote areas.
-
The results of the zero-out sensitivity tests show that the IR emissions sectors were two important contributors to ozone formation, as they were the major sources of VOCs, while the power plant emissions sector did not benefit O3 pollution control in the high-mass-burden regions due to the greater emissions of NOx versus VOCs.
Conversely, the results of the brute-force sensitivity tests show that the effects of IR, ITR, and all emissions control on the decrease in O3 were similar when their reduction percentages were higher than 40 %. Meanwhile, the effects of ITR and all emissions control were similar while the reduction percentages were higher than 30 %. When the reduction percentage dropped below 30 %, the nonlinearity of O3 formation was notable, and the power plant sector could make significant contributions to the decrease in O3. Thus, the control strategies should be promptly adjusted based on the emissions reduction, and the emissions sector combination should be precisely chosen to achieve better efficiency. The modeling system allows us to capture valuable information regarding how to choose the correct sequence and efficient combinations by exploring the key thresholds from the bulk of sensitivity tests regarding crucial parameters.
All data used in this paper are available upon request to the corresponding author Lingyun Zhu (zhlyun@126.com).
XH and LZ designed and performed this study. MZ co-designed the study and provided valuable advice about the model setting and operation. SW, XM, and JH carried out the measurements and provided the observation data for evaluating the simulation results.
The authors declare that they have no conflict of interest.
This study was supported by the Strategic Priority Research Program of the
Chinese Academy of Sciences (XDA19040204), the National Key R&D
Program of China (2017YFB0503901), and the National Natural Science
Foundation of China (41475098).
Edited by: Stefano Galmarini
Reviewed by: two anonymous referees
Benkovitz, C. M., Schultz, M. T., Pacyna, J., Tarrason, L., Dignon, J., Voldner, E. C., Spiro, P. A., Logan, A., and Graedel, T. E.: Global gridded inventories of anthropogenic emissions of sulfur and nitrogen, J. Geophys. Res., 101, 239–253, 1996.
Castell, N., Stein, A., Mantilla, E., Salvador, R., and Millan, M.: Evaluation of the use of photochemical indicators to assess ozone-NOx-VOC sensitivity in the Southwestern Iberian Peninsula, J. Atmos. Chem., 63, 73–91, 2009.
Chen, L., Zhang, M., Zhu. J., Wang, Y., and Skorokhod, A.,: Modeling Impacts of Urbanization and Urban Heat Island Mitigation on Boundary Layer Meteorology and Air Quality in Beijing Under Different Weather Conditions, J. Geophys. Res., 123, 4323–4344, 2018.
China Environmental Status Bulletin: available at: http://www.zhb.gov.cn/hjzl/zghjzkgb/lnzghjzkgb/ (last access: 1 June 2016), 2015.
Cotton, W. R., Pielke, R. A., Walko, R. L., Liston, G. E., Tremback, C. J., Jiang, H., McAnelly, R. L., Harrington, J. Y., Nicholls, M. E., Carrio, G. G., and McFadden, J. P.: RAMS 2001: current status and futures directions, Meteor. Atmos. Phys., 82, 5–29, https://doi.org/10.1007/s00703-001-0584-9, 2003.
Deng, X., Zhou, X., Wu, D., Tie, X., Tan, H., Li, F., Bi, X., Deng, T., and Jiang, D.: Effect of atmospheric aerosol on surface ozone variation over the Pearl River Delta region, Sci. China Earth Sci., 54, 744–752, 2011.
Dufour, G., Eremenko, M., Orphal, J., and Flaud, J.-M.: IASI observations of seasonal and day-to-day variations of tropospheric ozone over three highly populated areas of China: Beijing, Shanghai, and Hong Kong, Atmos. Chem. Phys., 10, 3787–3801, https://doi.org/10.5194/acp-10-3787-2010, 2010.
Gao, W., Tang, G., Ji, D., and Wang, Y.: Implementation effects and countermeasures of China's air pollution prevention and control action plan, Res. Environ. Sci., 29, 1567–1574, 2016 (in Chinese).
Han, X., Ge, C., Tao, J., Zhang, M., and Zhang, R.: Air Quality Modeling for a Strong Dust Event in East Asia in March 2010, Aerosol Air Qual. Res., 12, 615–628, 2012.
Han, X., Zhang, M., Gao, J., Wang, S., and Chai, F.: Modeling analysis of the seasonal characteristics of haze formation in Beijing, Atmos. Chem. Phys., 14, 10231–10248, https://doi.org/10.5194/acp-14-10231-2014, 2014.
Han, X., Zhang, M., Zhu, L., and Skorokhod, A.: Assessment of the impact of emissions reductions on air quality over North China Plain, Atmos. Pollut. Res., 7, 249–259, 2016.
Kleinman, L. I., Daum, P. H., Lee, Y. N., Nunnermacker, L. J., Springston, S. R., Lloyd, J., and Rudolph, J.: Ozone production efficiency in an urban area, J. Geophys. Res., 107, https://doi.org/10.1029/2002JD002529, 2002.
Kurokawa, J., Ohara, T., Morikawa, T., Hanayama, S., Janssens-Maenhout, G., Fukui, T., Kawashima, K., and Akimoto, H.: Emissions of air pollutants and greenhouse gases over Asian regions during 2000–2008: Regional Emission inventory in ASia (REAS) version 2, Atmos. Chem. Phys., 13, 11019–11058, https://doi.org/10.5194/acp-13-11019-2013, 2013.
Kwok, R., Napelenok, S., and Baker, K.: Implementation and evaluation of PM2.5 source contribution analysis in a photochemical model, Atmos. Environ., 80, 398–407, 2013.
Kwok, R. H. F., Baker, K. R., Napelenok, S. L., and Tonnesen, G. S.: Photochemical grid model implementation and application of VOC, NOx, and O3 source apportionment, Geosci. Model Dev., 8, 99–114, https://doi.org/10.5194/gmd-8-99-2015, 2015.
Li, J., Wang, Z., Akimoto, H., Yamaji, K., Takigawa, M., Pochanart, P., Liu, Y., Tanimoto, H., and Kanaya, Y.: Near-ground ozone source attributions and outflow in central eastern China during MTX2006, Atmos. Chem. Phys., 8, 7335–7351, https://doi.org/10.5194/acp-8-7335-2008, 2008.
Li, J., Zhang, M., Wu, F., Sun, Y., and Tang, G.: Assessment of the impacts of aromatic VOC emissions and yields of SOA on SOA concentrations with the air quality model RAMS-CMAQ, Atmos. Environ., 158, 105–115, 2017.
Li, M., Zhang, Q., Kurokawa, J.-I., Woo, J.-H., He, K., Lu, Z., Ohara, T., Song, Y., Streets, D. G., Carmichael, G. R., Cheng, Y., Hong, C., Huo, H., Jiang, X., Kang, S., Liu, F., Su, H., and Zheng, B.: MIX: a mosaic Asian anthropogenic emission inventory under the international collaboration framework of the MICS-Asia and HTAP, Atmos. Chem. Phys., 17, 935–963, https://doi.org/10.5194/acp-17-935-2017, 2017.
Lin, W., Xu, X., Zhang, X., and Tang, J.: Contributions of pollutants from North China Plain to surface ozone at the Shangdianzi GAW Station, Atmos. Chem. Phys., 8, 5889–5898, https://doi.org/10.5194/acp-8-5889-2008, 2008.
Liu, X., Zhang, Y., Xing, J., Zhang, Q., Wang, K., Streets, D., Jang, C., Wang, W., and Hao, J.: Understanding of regional air pollution over China using CMAQ, part II. Process analysis and sensitivity of ozone and particulate matter to precursor emissions, Atmos. Environ., 44, 3719–3727, 2010.
Nenes, A., Pilinis, C., and Pandis, S.N.: Continued development and testing of a new thermodynamic aerosol module for urban and regional air quality models, Atmos. Environ., 33, 1553–1560, 1999.
Nie, T., Li, X., Wang, X., Shao, M., and Zhang, Y.: Characteristics of the Spatial Distributions of Ozone-Precursor Sensitivity Regimes in Summer over Beijing, Acta Scientiarum Naturalium Universitatis Pekinensis, 50, 557–564, 2014 (in Chinese).
Olivier, J., Bouwman, A., Maas, C., and Berdowski, J.: Emission database for global atmospheric research, Environ. Monit. Assess., 31, 93–106, 1994.
Ran, L., Zhao, C. S., Xu, W. Y., Han, M., Lu, X. Q., Han, S. Q., Lin, W. L., Xu, X. B., Gao, W., Yu, Q., Geng, F. H., Ma, N., Deng, Z. Z., and Chen, J.: Ozone production in summer in the megacities of Tianjin and Shanghai, China: a comparative study, Atmos. Chem. Phys., 12, 7531–7542, https://doi.org/10.5194/acp-12-7531-2012, 2012.
Sarwar, G., Luecken, D., Yarwood, G., Whitten, G. Z., and Carter, W. P. L.: Impact of an updated carbon bond mechanism on predictions from the CMAQ modeling system: preliminary assessment, J. Appl. Meteorol. Clim., 47, 3–14, 2008.
Sillman, S. and He, D.: Some theoretical results concerning O3-NOx-VOC chemistry and NOx-VOC indicators, J. Geophys. Res., 107, ACH-1–ACH 26-15, https://doi.org/10.1029/2001JD001123, 2002.
Sillman, S. and West, J. J.: Reactive nitrogen in Mexico City and its relation to ozone-precursor sensitivity: results from photochemical models, Atmos. Chem. Phys., 9, 3477–3489, https://doi.org/10.5194/acp-9-3477-2009, 2009.
Streets, D., Bond, T., Carmichael, G., Fernandes, S., Fu, Q., He, D., Klimont, Z., Nelson, S. M., Tsai, N. Y., and Wang, M.: An inventory of gaseous and primary aerosol emissions in Asia in the year 2000, J. Geophys. Res., 108, https://doi.org/10.1029/2002JD003093, 2003.
Tang, G., Wang, Y., Li, X., Ji, D., Hsu, S., and Gao, X.: Spatial-temporal variations in surface ozone in Northern China as observed during 2009–2010 and possible implications for future air quality control strategies, Atmos. Chem. Phys., 12, 2757–2776, https://doi.org/10.5194/acp-12-2757-2012, 2012.
Tang, G., Zhu, X., Xin, J., Hu, B., Tao, S., Sun, Y., Zhang, J., Wang, L., Cheng, M., Chao, N., Kong, L., Li, X., and Wang, Y.: Modelling study of boundary-layer ozone over northern China – Part I: Ozone budget in summer, Atmos. Res., 187, 128–137, 2017.
Tao, M., Chen, L., Su, L., and Tao, J.: Satellite observation of regional haze pollution over the North China Plain, J. Geophys. Res., 117, D12203, https://doi.org/10.1029/2012JD017915, 2012.
van der Werf, G. R., Randerson, J. T., Giglio, L., Collatz, G. J., Mu, M., Kasibhatla, P. S., Morton, D. C., DeFries, R. S., Jin, Y., and van Leeuwen, T. T.: Global fire emissions and the contribution of deforestation, savanna, forest, agricultural, and peat fires (1997–2009), Atmos. Chem. Phys., 10, 11707–11735, https://doi.org/10.5194/acp-10-11707-2010, 2010.
Wang, X., Sun, M., Yang, T., and Wang, Z.: Interdecadal change in frequency of dust-haze episodes in North China Plain, Clim. Environ. Res., 18, 165–170, 2013 (in Chinese).
Wang, Y., Konopka, P., Liu, Y., Chen, H., Müller, R., Plöger, F., Riese, M., Cai, Z., and Lü, D.: Tropospheric ozone trend over Beijing from 2002–2010: ozonesonde measurements and modeling analysis, Atmos. Chem. Phys., 12, 8389–8399, https://doi.org/10.5194/acp-12-8389-2012, 2012.
Wang, Z. S., Chien, C. J., and Tonnesen, G. S.: Development of a tagged species source apportionment algorithm to characterize three-dimensional transport and transformation of precursors and secondary pollutants, J. Geophys. Res., 114, https://doi.org/10.1029/2008JD010846, 2009.
Xing, J., Wang, S. X., Jang, C., Zhu, Y., and Hao, J. M.: Nonlinear response of ozone to precursor emission changes in China: a modeling study using response surface methodology, Atmos. Chem. Phys., 11, 5027–5044, https://doi.org/10.5194/acp-11-5027-2011, 2011.
Yang, Y., Wilkinson, J., and Russell, A.: Fast, direct sensitivity analysis of multi-dimensional photochemical models, Environ. Sci. Technol., 31, 2859–2868, 1997.
Yu, S., Mathur, R., Sarwar, G., Kang, D., Tong, D., Pouliot, G., and Pleim, J.: Eta-CMAQ air quality forecasts for O3 and related species using three different photochemical mechanisms (CB4, CB05, SAPRC-99): comparisons with measurements during the 2004 ICARTT study, Atmos. Chem. Phys., 10, 3001–3025, https://doi.org/10.5194/acp-10-3001-2010, 2010.
Yu, S. C., Eder, B., Dennis, R., Chu, S. H., and Schwartz, S.: New unbiased symmetric metrics for evaluation of air quality models, Atmos. Sci. Lett., 7, 26–34, 2006.
Zhang, M., Uno, I., Zhang, R., Han, Z., Wang, Z., and Pu, Y.: Evaluation of the Models-3 Community Multi-scale Air Quality (CMAQ) modeling system with observations obtained during the TRACE-P experiment: comparison of ozone and its related species, Atmos. Environ., 40, 4874–4882, 2006.
Zhou, S., Yang, L., Gao, R., Wang, X., Gao, X., Nie, W., Xu, P., Zhang, Q., and Wang, W.: A comparison study of carbonaceous aerosols in a typical North China Plain urban atmosphere: Seasonal variability, sources and implications to haze formation, Atmos. Environ., 149, 95–103, 2017.


