the Creative Commons Attribution 4.0 License.
the Creative Commons Attribution 4.0 License.
Ice cloud microphysical trends observed by the Atmospheric Infrared Sounder
Brian H. Kahn
Hanii Takahashi
Graeme L. Stephens
Julien Delanoë
Gerald Manipon
Evan M. Manning
Andrew J. Heymsfield
We use the Atmospheric Infrared Sounder (AIRS) version 6 ice cloud property and thermodynamic phase retrievals to quantify variability and 14-year trends in ice cloud frequency, ice cloud top temperature (Tci), ice optical thickness (τi) and ice effective radius (rei). The trends in ice cloud properties are shown to be independent of trends in information content and χ2. Statistically significant decreases in ice frequency, τi, and ice water path (IWP) are found in the SH and NH extratropics, but trends are of much smaller magnitude and statistically insignificant in the tropics. However, statistically significant increases in rei are found in all three latitude bands. Perturbation experiments consistent with estimates of AIRS radiometric stability fall significantly short of explaining the observed trends in ice properties, averaging kernels, and χ2 trends. Values of rei are larger at the tops of opaque clouds and exhibit dependence on surface wind speed, column water vapour (CWV) and surface temperature (Tsfc) with changes up to 4–5 µm but are only 1.9 % of all ice clouds. Non-opaque clouds exhibit a much smaller change in rei with respect to CWV and Tsfc. Comparisons between DARDAR and AIRS suggest that rei is smallest for single-layer cirrus, larger for cirrus above weak convection, and largest for cirrus above strong convection at the same cloud top temperature. This behaviour is consistent with enhanced particle growth from radiative cooling above convection or large particle lofting from strong convection.
- Article
(9063 KB) - Full-text XML
- BibTeX
- EndNote
While our understanding of ice cloud microphysics has greatly advanced from targeted in situ campaigns during the past several decades (Baumgardner et al., 2017), global distributions obtained from satellite observing systems remain highly uncertain (e.g. Stubenrauch et al., 2013). Climate GCM simulations of the radiative response of high clouds have a large inter-model spread (e.g. Zelinka et al., 2013). Uncertainty in the ice hydrometeor fall speed is cited as a leading contributor despite dozens of modelling parameters contributing to this spread (e.g. Sanderson et al., 2008). The ice particle size distribution (PSD) is closely correlated to the magnitude of fall speed (Heymsfield et al., 2013; Mitchell et al., 2008). The PSD is frequently summarised as an ice effective radius (rei) (McFarquhar and Heymsfield, 1998) in most publicly available satellite remote sensing data sets.
Global decadal-scale satellite-based estimates of rei are available from two algorithm versions of the Moderate Resolution Imaging Spectroradiometer (MODIS) (Platnick et al., 2017; Minnis et al., 2011) and the Atmospheric Infrared Sounder (AIRS) (Kahn et al., 2014; Teixeira, 2013). Another estimate of rei is derived from a combination of the Cloud-Aerosol Lidar with Orthogonal Polarization (CALIOP) and the Imaging Infrared Radiometer (IIR) instruments (Garnier et al., 2013) on the Cloud-Aerosol Lidar and Infrared Pathfinder Satellite Observation (CALIPSO) satellite (Winker et al., 2010). Additional active–passive algorithms are also available. Deng et al. (2013) describe comparisons of rei between the CloudSat level-2C ice cloud property product (2C-ICE), radar–lidar profiles of rei (DARDAR; Delanoë and Hogan, 2010), and the CloudSat level-2B radar-visible optical depth cloud water content product (2B-CWC-RVOD).
Satellite retrievals of rei have known sources of uncertainty that are traced to the use of 1-D radiative transfer theory (e.g. Fauchez et al., 2015), errors that arise from a lack of precision, accuracy, or incomplete sampling in the atmospheric and surface state (e.g. Kahn et al., 2015), variability in mixtures of ice crystal habits and PSDs within a single satellite pixel (e.g. Kahn et al. 2008; Posselt et al., 2008), systematic uncertainties and approximations taken in the forward model (e.g. Wang et al., 2016; Irion et al., 2018), and instrument calibration drift (e.g. Pagano et al., 2012; Yue et al., 2017a; Manning and Aumann, 2017). The vertical heterogeneity of ice water content (IWC) and rei are known to cause differences in rei derived from shortwave/near-infrared (SWIR) and mid-infrared (MIR) bands for identical clouds and observing geometry (Zhang et al., 2010). Kahn et al. (2015) compared pixel-scale retrievals between MODIS Collection 6 (C6; Platnick et al., 2017) and AIRS Version 6 (V6; Kahn et al., 2014) and confirmed, for a small subset of homogeneous clouds, that rei is typically 5–10 µm larger when derived from MODIS SWIR bands compared to AIRS MIR bands.
Secular trends in water path, cloud amount, and cloud height (e.g. Wylie et al., 2005; Dim et al., 2011; Bender et al., 2012; Marvel et al., 2015; Norris et al., 2016; Manaster et al., 2017) suggest that climate change signals may be observable within the satellite era. There is a notable absence of published studies regarding trends in ice microphysics. Sherwood (2002) inferred regional decreases of rei by ∼ 0.5 µm per decade using offline calculations of the Advanced Very High Resolution Radiometer (AVHRR) radiances and argued for the importance of aerosols on cloud microphysics. Chen et al. (2016) describe experiments with the Nonhydrostatic ICosahedral Atmospheric Model (NICAM) that suggest an increase of rei in a warming climate that may be related to a weaker tropical circulation, and therefore implies changes in the dominant pathways of ice nucleation, growth, and precipitation processes. The rapid intensification of Earth's hydrological cycle is consistent with increased convective aggregation (Mauritsen and Stevens, 2015), the narrowing and intensification of the ITCZ (Su et al., 2017), and a lower end estimate of climate sensitivity; the high cloud response is key to reconcile a strong hydrological response and lower end climate sensitivity (e.g. Lindzen et al., 2001; Mauritsen and Stevens, 2015). The areal extent of cloud anvils are correlated to upper tropospheric lapse rate (Bony et al., 2016) and additionally ice hydrometeor fall speed, with larger (smaller) anvils for smaller (larger) rei (Satoh and Matsuda, 2009). The radiometrically stable AIRS instrument (Pagano et al., 2012) may provide constraints on ice cloud microphysical properties that are highly desired (Kärcher, 2017).
While not the focus of this investigation, aerosols modulate ice clouds through numerous indirect and direct pathways (Liu et al., 2007; Gettelman et al., 2010; Kärcher, 2017). Variable magnitudes of rei at convective tops result from variations in cloud condensation nuclei (CCN) or ice nuclei (IN); these responses are highly nonlinear because of complex liquid and ice phase microphysical processes as a function of updraft velocity, concentration and composition of CCN and IN (Phillips et al., 2007; Van Weverberg et al., 2013). Morrison and Grabowski (2011) used a 2-D cloud resolving model (CRM) to show that convection may subtly weaken, yet cloud top height and anvil IWC may increase in polluted compared to clean conditions, resulting in a reduction of rei by up to a factor of two. Simultaneous observations of rei from MODIS and IWC from the Microwave Limb Sounder (MLS) suggest that more intense convection (defined by positive anomalies of IWC) increases rei while polluted air (defined by positive anomalies of aerosol τ) decreases rei (Jiang et al., 2011). However, whether convection is dynamically invigorated by increased aerosol concentrations is highly debatable (Rosenfeld et al., 2008; Fan et al., 2013; Grabowski, 2015). Improving our understanding of satellite-based ice cloud microphysics will lay the groundwork for future observational constraints of aerosol-ice microphysics interactions.
Stanford et al. (2017) show that the covariability of cloud temperature, vertical velocity, and rei observations within tropical mesoscale convective systems (MCSs) reveal very complex behaviour taken during the High Altitude Ice Crystals-High Ice Water Content (HAIC-HIWC) field campaign near Australia. HAIC-HIWC observations and simulations with the Weather Research and Forecasting (WRF) model using multiple microphysical parameterisations are compared. The observations show that larger (smaller) rei are found in weaker (stronger) updrafts of MCSs, while the reverse is generally true for IWC; however, the opposite behaviour was found for observations taken within a tropical cyclone (Leroy et al., 2017). The covariability of rei with cloud temperature and vertical velocity among the WRF experiments strongly disagree in sign and magnitude compared to HAIC-HIWC observations.
The aforementioned observational, theoretical, and numerical modelling studies motivate the development of additional constraints on rei and its covariability with other ice cloud, thermodynamic, and dynamic fields. This investigation is a first attempt to quantify secular changes in rei from AIRS over its decade and a half observational record with well-characterised radiometric stability (Pagano et al., 2012). We attempt to identify potential algorithmic, information content, calibration, and sampling characteristics that induce nonphysical trends. Collocated AIRS and Advanced Microwave Scanning Radiometer (AMSR) data are used to glean insight among the connections between rei and tropical convection/precipitation processes. Lastly, DARDAR data are used to investigate increases in rei that occur near the tops of deep convection. The collocation of pixel-scale data among AIRS, AMSR, and DARDAR is a first step towards illuminating the potential processes that may be responsible for secular changes in ice cloud properties.
2.1 Atmospheric Infrared Sounder (AIRS)
The AIRS V6 cloud properties are used from 1 September 2002 until 31 August 2016 (Kahn et al., 2014; K14 hereafter). As this investigation addresses ice microphysics, we focus on the 26.5 % of AIRS pixels containing ice thermodynamic phase, and their ice cloud top temperature (Tci), ice optical thickness (τi), and rei retrieval parameters (K14). The identification of cloud thermodynamic phase is described in K14 and is validated against CALIOP phase estimates in Jin and Nasiri (2014). A set of four brightness temperature (Tb) thresholds and Tb differences (ΔTb) in the 8–12 µm atmospheric window region identify ice phase by leveraging the spectral dependence of the refractive index of ice; the ice phase is identified correctly in excess of 90 % of the time using CALIOP as truth. Ice clouds of convective origin typically have larger τi (Krämer et al., 2016) and trigger more of the ice phase tests, while tenuous ice clouds have smaller τi and trigger fewer phase tests.
For each AIRS footprint identified as containing ice, the three-parameter optimal estimation (OE) ice cloud property retrieval is performed (K14) and minimises the following cost function:
where F(x) is the radiance vector that is forward modelled, x is the state vector of retrieved parameters, b is the vector containing fixed state parameters, y is the vector of AIRS radiances (K14), xa is the prior guess of x, is the inverse of the a priori covariance, and is the inverse of the noise covariance of AIRS radiances. The retrieval state vector x is restricted to τi (ice_cld_opt_dpth in L2 Support file; defined at 0.55 µm), rei (ice_cld_eff_diam in L2 Support file; De is converted to rei henceforth), and Tci (ice_cld_temp_eff in L2 Support file). The bulk ice scattering models, and the definition of ice De, follows from Baum et al. (2007, cf. Eq. 4). The surface properties (temperature and emissivity) and atmospheric profiles (temperature and specific humidity) in b, and xa (e.g. upper level cloud top temperature Tcld used as a prior guess for Tci) are taken from the AIRS cloud-clearing product (L2 Standard file AIRX2RET for IR/MW and AIRS2RET for IR only). The averaging kernel matrix A quantifies the sensitivity of the retrieval with respect to changes in the true state:
Scalar averaging kernels (AKs; ice_cld_opt_dpth_ave_kern, ice_cld_eff_diam_ave_kern, and ice_cld_temp_eff_ave_kern in L2 Support file) are reported for each of the three state vector retrieval parameters as off-diagonal terms of A in Eq. (2) are not considered in K14. The scalar AKs quantify the information content of the retrieval with respect to x. The normalised χ2 (ice_cld_fit_reduced_chisq in L2 Support file) is defined as:
where εi is the radiance error in channel i and N= 59. The χ2 from Eq. (3) is calculated for 59 observed and simulated 8–14 µm channels (K14) and is used to determine the robustness of the radiance fits.
We have also tested the fidelity of rei within 6 K of the cold point tropopause. As AIRS observations are derived from IR thermal emission spectra, biases may arise in proximity to the tropopause. Any uncertainty in Tci, the height and magnitude of the cold point tropopause, or temperature lapse rate may lead to increased uncertainty in rei as small spectral changes translate to large geophysical retrieval changes. Therefore, “filtered” sets of AIRS retrievals that remove ice clouds within 6 K of the cold point tropopause are shown throughout the paper, then are compared with “unfiltered” data when contrasted to DARDAR retrievals (see Sect. 6).
The average 14-year climatology of rei, τi, Tci, and ice cloud frequency based on the IR only retrieval (AIRS2RET) is shown in Fig. 1. Retrievals with quality control (QC) flags QC = 0 and QC = 1 (K14; ice_cld_opt_dpth_QC, ice_cld_eff_diam_QC, and ice_cld_temp_eff_QC in L2 Support file) are included and the χ2 is filtered using the QC flag specific to rei. The climatology is restricted to ice free ocean between 54∘ S and 54∘ N as influences of surface heterogeneity including mountainous terrain, low emissivity such as bare mineral soils, and nocturnal and high latitude wintertime inversions on the ice parameter retrieval are not fully understood and warrant further investigation. A strict ad hoc QC may filter questionable data over land but the resulting data sample may skew the geophysical signals toward opaque clouds at the expense of non-opaque clouds that are more likely to be filtered out. The AIRS sensitivity is maximised for optically thinner cirrus with τ≤ 5 (e.g. Huang et al., 2004), while MODIS sensitivity is maximised for optically thicker cirrus (e.g. Kahn et al., 2015; Chang et al., 2017). The AIRS sampling includes nearly all ice clouds with τi > 0.1, while the maximum values of τi asymptote to values near 6–8 (e.g. Kahn et al., 2015). The rei is retrieved for the same sample although retrievals with QC = 2 are not included. Kahn et al. (2015) describe pixel-level comparisons between AIRS and MODIS ice cloud properties and show that overlapping sensitivity for both τi and rei is observed for optically thicker pixels containing four positive ice phase tests with spatial maps resembling those described in King et al. (2013).
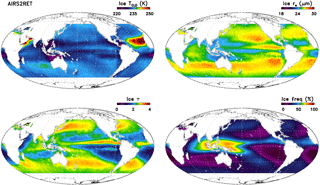
Figure 1The global 14-year averages (1 September 2002–31 August 2016) of Tci, rei, τi, and ice cloud frequency, for the AIRS IR only retrieval (AIRS2RET) between 54∘ S and 54∘ N over the oceans. Note that the maximum Tci value is higher than indicated in the colour bar.
The well-documented (Wylie et al., 2005; King et al., 2013; Stubenrauch et al., 2013) spatial distributions of ice clouds with maxima in the tropics and extratropical storm tracks and minima in the subtropical gyres are shown in Fig. 1. Higher magnitudes of rei are observed along the ITCZ where deep convection is more dominant, while lower magnitudes are observed in the western Pacific Warm Pool region where transparent cirrus is more dominant. These patterns are consistent with previous observational and modelling studies. Yuan and Li (2010) found that MODIS rei is a few µm larger at the tops of tropical deep convection when compared to the extratropics for the same cloud top temperatures and Tb. Barahona et al. (2014) show an increase in rei of a few µm in the Goddard Earth Observing System Model (GEOS-5) with improved comparisons against MODIS. Eidhammer et al. (2017) describe simulations using the Community Atmosphere Model (CAM5) for a consistent single ice species across cloud and precipitating ice hydrometeors without thresholds for autoconversion. A subtle but distinct double ITCZ is observed in the zonal averages, not unlike AIRS rei and τi in Fig. 1.
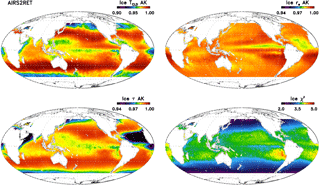
Figure 2Same as Fig. 1 except these are the global 14-year averages of Tci, rei, and τi averaging kernels (AKs) and χ2 fitting parameter. Note that the minimum AK values may be lower than indicated in the colour bar.
The loss of AMSU-A2 on 24 September 2016 led to the termination of the operational AIRS/AMSU combined infrared and microwave (AIRX2RET/AIRX2SUP) cloud clearing retrieval (Yue et al., 2017b). Since that time, the AIRS infrared only (AIRS2RET/AIRS2SUP) cloud clearing retrieval is the current operational version. The impacts of the loss of AMSU on retrieval parameters are assessed in great detail in Yue et al. (2017b). While many subtle changes were documented for vertical profiles of temperature and specific humidity, differences were more substantive for particular cloud properties. Further discussion regarding differences in Fig. 1 for AIRS2RET and AIRX2RET is found in the Appendix and shown in Fig. A1.
Figure 2 details AKs and χ2 using identical QC as Fig. 1. Typically the AKs are much lower and the χ2 fits much larger for QC = 2 (not shown) and indicate lower information content and much poorer radiance fits. The AK and χ2 patterns are spatially coherent and exhibit small variations between tropical convection, thin cirrus, and both extratropical storm tracks. The AKs have maxima on the equatorial side of the storm tracks with a poleward minimum and additional minima within the tropics. Multi-layer clouds are more frequent in the tropics and extratropical storm tracks (Chang and Li, 2005; Mace et al., 2009) and lower values of Tci AKs in these areas is consistent with the single cloud layer assumption in the forward model (Kahn et al., 2015). However, the rei AK distributions strongly suggest that the single layer assumption is providing high information content of ice cloud properties. Interestingly, the spatial patterns of rei AKs are correlated to τi (compare Figs. 1 and 2) in the low latitudes, where large values of τi align with slightly reduced rei AK. An area of reduced rei AK in the subtropical north Atlantic corresponds to the Saharan air layer. Generally χ2 is about 3–4 between ±30∘ latitude with somewhat lower values (better fits) in the ITCZ and extratropics. The spatial pattern of χ2 does not closely track any of the AK patterns; thus for QC = [0, 1] retrievals, spatial variations in information content do not correlate to the quality of the spectral fit. Differences between the IR/MW and IR only retrievals are generally minor but not negligible and are consistent with the loss of MW information. Further discussion regarding differences in Fig. 2 for AIRS2RET and AIRX2RET is found in the Appendix and depicted in Fig. A2.
2.2 AMSR-E/AMSR-2
Coincident satellite observations in the A-train are valuable for gaining physical insight about the AIRS ice cloud properties. The Advanced Microwave Scanning Radiometer–Earth Observing System (AMSR-E) on Aqua and AMSR-2 instrument on GCOM-W1 provide several atmospheric and surface properties that coincide with AIRS. The AMSR-E instrument was operational from 4 May 2002 until 4 October 2011, while AMSR-2 is currently operational since 18 May 2012. We focus on the summer months July and August from 2003 to 2016 in this investigation. The total column water vapour (CWV) cloud liquid water path (LWP), rain rate (RR) (Hilburn and Wentz, 2008), sea surface temperature (Tsfc) (Gentemann et al., 2010), and direction-independent near surface wind speed (u) are obtained from AMSR-E (Wentz et al., 2014a) and AMSR-2 (Wentz et al., 2014b) using Version 7 data.
2.3 DARDAR
We use the CloudSat, CALIPSO, and MODIS radar–lidar (DARDAR) combined ice cloud property retrieval developed by Delanoë and Hogan (2008, 2010) to investigate rei in a variety of ice clouds. This algorithm is based on an OE algorithm that includes CALIOP's lidar backscatter and CloudSat's radar reflectivity to retrieve vertical profiles of IWC, rei, and other cloud variables. The ice cloud property retrievals are available at CloudSat's 1.4 km horizontal resolution and CALIPSO's 60 m vertical resolution and are matched to the nearest AIRS pixel. As the radar and lidar have different sensitivities to a range of cloud characteristics, the retrieval is functional when one of the instruments is unable to detect clouds either because of small ice particles or strong attenuation. Deng et al. (2013) showed that there is very good agreement in rei between DARDAR, 2C-ICE, and in situ obtained observations from the Small Particles in Ice (SPARTICUS) field campaign; therefore only DARDAR data are used in this study.
DARDAR contains two products: DARDAR-MASK (Delanoë and Hogan, 2010; Ceccaldi et al., 2013) and DARDAR-CLOUD (Delanoë and Hogan, 2008, 2010), which are both available through the ICARE Thematic Center (http://www.icare.univ-lille1.fr/archive, last access: 1 July 2017). DARDAR-MASK provides the vertical cloud classification and a range of additional categorisations (e.g. clear, aerosols, rain, supercooled and warm liquid, mixed phase, and ice). DARDAR-CLOUD provides ice cloud properties such as extinction, rei, and IWC by a variational radar–lidar ice-cloud retrieval algorithm called VarCloud (Delanoë and Hogan, 2008). In this product, normalised ice particle size distributions are used and non-spherical particles leverage in situ measurements (Delanoë et al., 2014).
3.1 Pixel matching
A pixel scale nearest neighbour matching approach (Fetzer et al., 2013) is applied to AIRS/AMSU, AMSR-E and AMSR-2 from 1 September 2002 until 31 August 2016. By retaining the native spatial and temporal covariances in the matched data, smaller scale and faster temporal processes are captured that are otherwise lost to spatial gridding and temporal averaging (e.g. Kahn et al., 2017). The same methodology is applied between AIRS/AMSU and DARDAR from 1 July 2006 until 31 December 2008 within the subset of AIRS/AMSU pixels along the CloudSat-CALIPSO ground track.
3.2 Secular trends
Trends and their statistical significance are calculated following Santer et al. (2000) using a two-sided t-test and confidence intervals at the 95 % significance level. The 95 % confidence intervals are also calculated for a lag-1 autocorrelation in order to assess the sensitivity to highly correlated time series (Cressie, 1980; Santer et al., 2000). Trends are calculated for two different spatial averages. First, global monthly anomalies at 1∘ × 1∘ resolution over the 14-year observing period are calculated, then trends are reported at the same spatial resolution. Second, monthly anomalies averaged between 54 and 18∘ S, 18∘ S and 18∘ N, and 18∘ S and 54∘ N are calculated then trends with 95 % confidence intervals with and without lag-1 autocorrelation are determined and displayed as box and whisker diagrams. Three sets of AIRS properties are described: combined IR/MW, IR only, and IR only for the third of pixels in the swath nearest to nadir view. The purpose of contrasting results between IR only and combined IR/MW is to highlight differences between the two algorithms with further detail found in the Appendix. The purpose of showing near nadir IR only is to demonstrate the overall lack of sensitivity in the results to scan angle.
3.3 Joint histograms
Instantaneous pixel matches of AMSR-E and AMSR-2 variables vs. AIRS ice cloud properties are used to construct joint histograms following the approach described in Kahn et al. (2017). The joint histograms contain the natural log of counts with rei and τi contours superimposed. The histograms each contain one of several AMSR variables on the x-axis and the AIRS upper layer Tcld on the y-axis. The intent of these diagrams is to reveal the physical response of cloud top rei and τi (if any) to precipitating and non-precipitating cloud types and meteorological variability inferred from AMSR. The emphasis is on rei vs. Tcld to facilitate comparisons with previous works that describe temperature dependence of rei. Convective and non-convective cloud types are shown separately in order to highlight the much larger responses of rei to thermodynamic and dynamical variability in tropical convection.
As discussed in Kahn et al. (2014), the Tci variable is included in the retrieval state vector to improve the χ2 radiance fits and the success rate of retrieval convergence. While there are strong similarities between Tci and the upper level Tcld, some differences arise within multi-layer clouds as expected, as Tci is based on the assumption of a single-layer cloud (Kahn et al., 2014). Further discussion on the reconciliation of the two cloud top temperatures is in progress and will be presented in a separate paper.
3.4 Comparing DARDAR and AIRS rei
The retrievals of rei from AIRS and DARDAR are separately compared for single-layer cirrus and convective clouds over ocean. We use the CloudSat reflectivity, DARDAR-MASK, and DARDAR-CLOUD products to define cirrus only (Ci), cirrus above weak convection (Weak conv), and cirrus above strong convection (Strong conv). We begin with identifying the number of cloud layers in each profile and the cloud top height (CTH) and cloud bottom height (CBH) of each layer. Profiles with more than three layers of clouds are not included in the statistics. Cirrus is defined as CBH > 12 km (e.g. Keckhut et al., 2006) and deep convection is defined as CTH > 10 km and CBH < 2 km (Takahashi and Luo, 2014). Among deep convective clouds, weak and strong convection are defined by the echo top height (ETH) of the 10 dBZ contour: the ETH of 10 dBZ > 10 km (Luo et al, 2008; Takahashi and Luo, 2012, 2017) for strong deep convection, while the ETH at 10 dBZ < 5 km for weak deep convection. For the statistics described later, the upper layer cirrus is chosen to have (1) CTH < tropopause height, (2) cloud base temperature < 200 K, and (3) cirrus geometrical thickness < 1 km. As mentioned in Sect. 3.3, the coarse classification of convective intensity is useful for quantifying differences in cloud top rei for non-convective, weakly, and strongly convective scenes.
4.1 Global trends
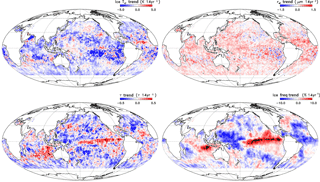
The 14-year temporal trends in the cloud properties depicted in Fig. 1 are shown in Fig. 3. The Tci decreases about 1–2 K in most areas, but a few regions are found to increase. The trend in rei is increasing most everywhere, from a few tenths to 1 to 2 µm, with the largest values in proximity to tropical convection. While the upward trend in rei is somewhat noisy at 1∘ × 1∘, the increase is notably consistent across the global oceans. In contrast, τi is decreasing in most regions except for convectively active regions in the ITCZ, parts of the tropical western Pacific Warm Pool, and southern Indian Ocean. The trend in ice frequency is similar to τi but is spatially smoother and the magnitude is much larger in the tropics. We reiterate that the AIRS sensitivity to ice clouds is limited between 0.1 < τi < ∼ 6–8, thus the τi trends do not include contributions from clouds outside of this sensitivity range.
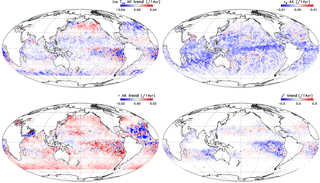
Figure 4The global 14-year trends for the fields in Fig. 2. Note that the minimum and maximum trends may exceed those indicated in the colour bar.
Trends in the AKs and χ2 are shown in Fig. 4. Generally speaking, the trends in the retrieval parameters do not resemble the spatial patterns of trends in their respective AKs. The trends for rei AKs in Fig. 4 resemble τi trends in Fig. 3. This shows that changes in the information content of rei are related to trends in τi. However, the trends for rei do not resemble trends in either τi or τi AKs. We conclude that the upward trend in rei is independent of the gain or loss of information in rei. The trends in χ2 are quite subtle and are smallest when the ice frequency is largest. There is an increased zonal symmetry in the Tci AK trend than the Tci trend in Fig. 3 and no obvious correspondence is apparent between the sign of the Tci trend in Fig. 3 and the Tci AK trend in Fig. 4. The τi AK trend is generally upwards except in a few tropical locations including the Saharan air layer. The spatial patterns in τi AK trends do not appear to be related to other fields. In conclusion, the observed trends in the ice cloud properties in Fig. 3 do not appear to be caused by the gain or loss of information content, or the fidelity of the radiance fitting in the retrieval.
4.2 Latitude bands
The anomaly time series of rei for three latitude bands and the IR/MW, IR only, and IR nadir retrievals are shown in Fig. 5. While the anomaly time series for most of the 1∘ × 1∘ grid boxes are not statistically significant (not shown), a statistically significant signal is obtained for the broad oceanic latitude bands. The strong similarity in the anomaly time series for IR/MW, IR only, and IR nadir is apparent for rei and is also true for the other variables (not shown). Despite some of the regional spatial differences in IR/MW and IR only retrievals described in the Appendix, the algorithm differences are minuscule with regard to the latitude band anomaly time series.
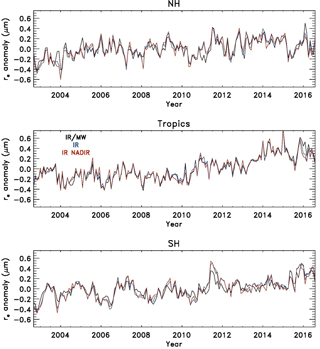
Figure 5Monthly anomaly time series for rei for the IR/MW, IR only, and IR nadir retrievals organised into three latitude bands: SH extratropics (54–18∘ S), tropics 18∘ S–18∘ N, and NH extratropics (18–54∘ N).
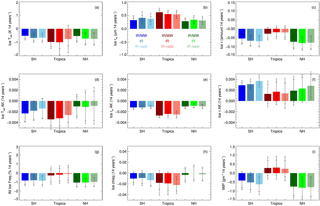
Figure 6The 14-year trends for the tropics, SH and NH extratropics, and IR/MW, IR only, and IR nadir retrievals. (a) Tci, (b) rei, (c) τi, (d) Tci AK, (e) rei AK, (f) τi AK, (g) ice cloud frequency, (h) χ2, and (i) IWP. The confidence for 95 % statistical significance is shown as black lines with narrow tick marks and the confidence for 95 % statistical significance with a lag-1 autocorrelation correction is shown as wider tick marks (see Santer et al., 2000).
Figure 6 summarises the results for three latitudinal bands and IR/MW, IR only, and IR nadir including 95 % confidence intervals with and without lag-1 autocorrelation. The results in Fig. 6 have clouds within 6 K of the tropopause filtered out; very similar results are obtained with no filtering, and no material changes in sign, magnitude, and statistical significance are found. The extratropical SH and NH upward trends in rei (Fig. 6b) are steadier with time than the tropics, which appears initially flat but then jumps upwards since 2013 (Fig. 5); however, all three regions and retrievals exhibit statistically significant trends (Fig. 6). The Tci trends (Fig. 6a) show about 0.5–1.0 K of cooling for the three latitude bands and three data sets, with IR nadir exhibiting 95 % confidence except for the lag-1 autocorrelation. The τi trends (Fig. 6c) are downward by 0.025–0.075 (significant at 95 % in the SH and NH, but not in the tropics). The AKs are slightly downwards for Tci (Fig. 6d) and rei (Fig. 6e) and upwards for τi (Fig. 6f); there is a mix of statistical significance that depends on the retrieval algorithm and latitude band. The χ2 trends (Fig. 6h) are essentially not statistically significant except for IR nadir in the tropics, although the trend is slightly downwards. This is consistent with an increasing thermal contrast with time as SSTs increase and ice clouds slightly cool. Ice frequency (Fig. 6g) decreases by about 1 % relative to the sum of all AIRS pixels in the SH and NH extratropics (significant at 95 %) and much less so in the tropics (not significant at 95 %). Lastly, the ice water path (IWP) (Fig. 6i), which is calculated from (2∕3)ρireiτi, where ρi is the density of ice (assumed to be 0.92 g cm−3), decreased about 0.4–0.8 g m−2 in the SH (marginal significance at 95 %) and NH (significant at 95 %), and increased about 0.25 g m−2 in the tropics (not significant at 95 %). This latitudinal pattern is similar to the CMIP5 zonal average ensemble mean (Ceppi et al., 2016; cf. Fig. 1c) although the decrease of AIRS IWP appears larger in magnitude than CMIP5 IWP at first glance. However, the statistical significance of IWP is reduced compared to τi because of the compensating increases in rei at all latitudes.
4.3 Potential impacts from radiometric drift
While the radiometric stability of AIRS is established to be approximately 4 ± 1 mK yr−1 (Pagano et al., 2012), the impacts of radiometric drift on secular cloud property trends has, to date, not been assessed. Manning and Aumann (2017) raise the possibility of channel-dependent drift that could cause a systematic change in slope in the 8–14 µm region especially for cold scenes with Tb < 200 K. However these effects are subtle and are undetermined (but likely much smaller) for warmer Tb that dominate the vast majority of AIRS pixels.
Six different tests have been designed to estimate the potential effects of calibration drift on the cloud products: (1) add +50 mK to all 59 cloud retrieval channels in K14 after cloud clearing but before the ice cloud property retrieval; (3) add +50 mK to cloud clearing channels and K14 channels but before cloud clearing is performed; (3) increase the slope across the 59 channels by reducing the longest wavelength channel by −50 mK, increasing the shortest wavelength channel by +50 mK, and apply a linearly interpolated correction to channels in between; (4) the same as (3) except decrease the slope by reversing the radiometric perturbations; (5) different ice cloud properties between v6 and a new version (v7j) of AIRS radiances that is updated with new calibration estimates (Steve Broberg and Thomas Pagano, personal communication, 2018); and (6) the same as (5) except restricted to the new polarisation corrections only. Experiment (1) isolates radiometric drift on ice cloud properties only, while (2) accounts for impacts from the full geophysical retrieval. Experiments (3) and (4) are an approximate way to estimate channel dependent drift but ignores the effects of individual detector modules. Experiments (1) to (4) are performed for the focus day 6 September 2002. Experiment (5) assesses the differences in ice cloud properties solely due to the updated radiance calibration (v7j) and experiment (6) isolates the contributions from updates in the polarisation corrections only. Experiments (5) and (6) are performed for the focus days 6 September 2002, 3 March 2007, 6 June 2007, 9 December 2007, 1 September 2012, and 12 September 2017. Further investigation into radiometric drift scenarios on the AIRS Level 2 retrieval system that take into account individual characteristics of each relevant detector module is warranted.
Table 1The two radiance perturbation tests after cloud clearing (+50 mK) and before cloud clearing (+50 mK before CC); see text for description), with reported mean difference and median absolute deviations of cloud properties, AKs, and χ2 for 54∘ S–54∘ N, over ocean, for 6 September 2002.
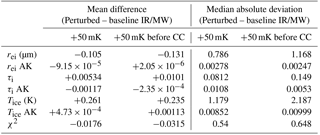
Table 2T4he trends depicted in Fig. 6 for the IR only retrieval, and the radiance perturbation sensitivity tests that adjust the slope in the retrieval channels. The “steep” category indicates a steeper slope with retrieval channel 1 at 692.76 cm−1 perturbed 50 mK cooler, retrieval channel 59 at 1133.91 cm−1 perturbed 50 mK warmer, and a linear interpolation in between (see K14 for a list of the 59 retrieval channels). The “shallow” category is reversed from the “steep” category.
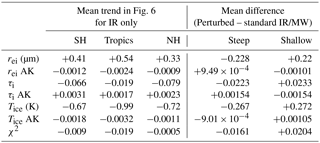
The results of experiments (1) and (2) are summarised in Table 1 for one day of retrievals on 6 September 2002 for ±54∘ latitude over the oceans and for QC = [0, 1]. Both experiments indicate that differences with respect to the IR/MW retrieval are substantially smaller than the trends reported in Fig. 6. For the experiments before and after cloud clearing, Δrei is −0.13 and −0.1 µm, Δτi is +0.01 and +0.005, and ΔTci is +0.24 and +0.26 K, respectively. The AK trends for cloud variables for the perturbation experiments are much less than depicted in Fig. 6. Furthermore, the sign changes of the perturbations are not consistent with Fig. 6. (A similar test with −50 mK that is not shown was performed and is nearly symmetric but with the opposite result.) The results of the slope perturbation experiments (3) and (4) are summarised in Table 2. The Δrei and Δτi trends are somewhat larger than for experiments (1) and (2) including a few of the AK trends, but still fall short of the magnitudes reported in Fig. 6 (also listed in Table 2 for IR only). As with experiments (1) and (2), the signs of the trends are not in agreement between the observed trends and the slope perturbation experiments, suggesting that the slope adjustment does not explain observed trends. While the four highly simplified radiance perturbation experiments fall short of explaining the sign and magnitude of the observed ice property trends, some fractional contribution to observed trends cannot be ruled out.
Experiment (5) shows that the differences between the standard v6 retrieval and that using v7j radiances are somewhat larger than the differences obtained from experiments (1) to (4) and depicted in Tables 1 and 2, and are closer to magnitudes obtained in the 14-year trends depicted in Fig. 6 (not shown). However, the differences are nearly identical for all focus days listed above that are dispersed throughout the length of the AIRS mission. Therefore, the new v7j radiance calibration estimates indicate that the update will not cause meaningful changes in the sign and magnitude of ice cloud property trends. Rather, some small shifts in the magnitude of the mean properties may occur that are similar in magnitude to the absolute value of the trends themselves. This behaviour holds for the left, centre, and right third of the AIRS swath, although a very slight scan dependence on the mean difference between v6 and v7j is observed. Lastly, experiment (6) shows that the polarisation effects are about an order of magnitude smaller than experiment (5) (not shown). In summary, an eventual implementation of v7j (or similar) radiances should have no material impact on the secular trends derived in Fig. 6. However, this does not eliminate the possibility of a partial contribution from radiometric drift itself as described in experiments (1)–(4).
Using ground-based retrievals at Darwin, Protat et al. (2011) found that rei is ∼ 1–3 µm larger during active deep convection compared to suppressed conditions. Using a simultaneous retrieval of ice cloud properties from the MODIS and POLDER instruments, van Diedenhoven et al. (2014) found that rei is larger in stronger convective events compared to others at a given cloud top pressure. Van Diedenhoven et al. (2016) used airborne remote sensing observations to show that rei decreases with height, reaches a minimum around 14 km, and may subsequently increase at higher altitudes. Barahona et al. (2014) obtained an increase of a few µm for clouds colder than 195 K with GEOS-5, and Hong and Liu (2015) show similar results with DARDAR data for the thickest convective clouds above 10 km. Convective overshoots into the lower stratosphere are 0.3–4.0 µm larger than non-overshooting deep convection observed with DARDAR data (Rysman et al., 2017). Lawson et al. (2010) use in situ aircraft probe data of ice particles in aged cirrus in proximity to convection to show that particle size is more weakly dependent on temperature below 215 K. Collectively, the aforementioned investigations suggest that rei varies significantly at the tops of convective ice clouds and motivates the synergistic use of AMSR and AIRS at the pixel scale to capture convective-scale processes.
5.1 Differences in rei between opaque, non-opaque, and multi-layer clouds
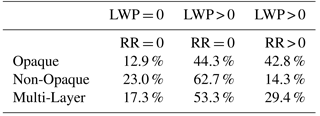
We show separate vertical profiles of AIRS rei with ice Tcld for opaque, non-opaque, and multi-layer clouds in Fig. 7 with definitions listed in Table 3. The two-layer effective cloud fraction (ECF) product is used to categorise the three cloud types and the threshold of 0.98 used by Protopapadaki et al. (2017) is applied to the upper layer to categorise opaque clouds. The ECF is a cloud product that represents the convolution of cloud fraction and cloud emissivity. Nasiri et al. (2011) showed that ECF from AIRS and effective emissivity from MODIS is in excellent agreement for both single and multi-layered cloud configurations. Only 1.9 % of cloud tops are identified as opaque, and 98.1 % are classified as non-opaque or multi-layer. The three categories of clouds are further subdivided into three additional categories using AMSR-E/AMSR-2 LWP and RR (Fig. 7): no liquid cloud or rain (LWP = 0 and RR = 0), liquid cloud but no rain (LWP > 0 and RR = 0), and liquid cloud with rain (LWP > 0 and RR > 0). Symbols show mean rei over 10 K bins derived from IWC and extinction observations for three tropical in situ field campaigns: the Cirrus Regional Study of Tropical Anvils and Cirrus Layers–Florida Measurements for Area Cirrus Experiment (CRYSTAL-FACE, diamonds), the Tropical Composition, Cloud, and Climate Coupling Experiment (TC4, triangles), and the NASA African Monsoon Multidisciplinary Analysis (NAMMA, squares) campaigns (e.g. Heymsfield et al., 2014).
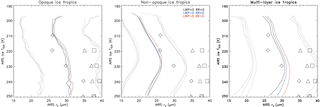
Figure 7The mean (solid) and ±1σ values of AIRS IR only rei vs. Tci for opaque, non-opaque and multi-layer ice clouds over the tropical oceans during the months of July and August within the 14-year time period of investigation. Refer to Table 3 for definitions of the three categories. The AMSR-E/AMSR-2 estimates of LWP and RR are used to divide categories into clear (LWP = 0) and no rain (RR = 0), according to the passive microwave; cloudy (LWP > 0) and no rain (RR = 0); and cloudy (LWP > 0) and rain (RR > 0). The results in both panels have all AIRS ice clouds filtered within 6 K of the cold point tropopause; otherwise a much larger and potentially unphysical increase in rei would be observed in the figures at the coldest temperatures. The symbols are average rei from in situ field campaign data for the CRYSTAL-FACE (diamonds), TC4 (triangles), and NAMMA (squares) campaigns; please see Heymsfield et al. (2014) for more details.
A maximum rei occurs near 230 K and decreases at warmer and colder Tcld for non-opaque and multi-layer clouds in the tropics (Fig. 7). About 23.0 % (17.3 %) of cases are clear for non-opaque (multi-layer) according to AMSR but cloudy according to AIRS (Table 4). About 62.7 % (53.3 %) have LWP > 0 and RR = 0 for non-opaque (multi-layer) clouds. Both of these categories have nearly identical Tcld dependence but multi-layer is several µm larger than non-opaque. The remaining 14.3 % (29.4 %) have LWP > 0 and RR > 0, and rei is 0.5–2.5 µm larger than no rain, with the largest differences for Tcld < 210 K. For opaque clouds in the tropics, rei is substantially larger for all Tcld than non-opaque clouds. There is three times the relative frequency of occurrence with raining opaque clouds compared to raining non-opaque clouds. An increase in rei is found for increasing Tcld unlike non-opaque and multi-layer clouds. A weaker vertical dependence in rei for Tcld < 210 K occurs and is similar to the results of van Diedenhoven et al. (2016). While this region is sensitive to the 6 K cut-off used to filter questionable retrievals near the tropopause, the profile in Fig. 7a is fairly robust for ∼ 4 K and larger. While the in situ rei estimates are somewhat larger for Tcld > 220 K, this is expected as these observations may be obtained well below cloud top in which the infrared signal is not sensitive. Furthermore, the standard deviation of the in situ observations (not shown) has a magnitude that is approximately as large as the AIRS estimates of standard deviation, providing significant overlap between satellite and in situ observations.
5.2 Dependence of rei on near surface wind speed
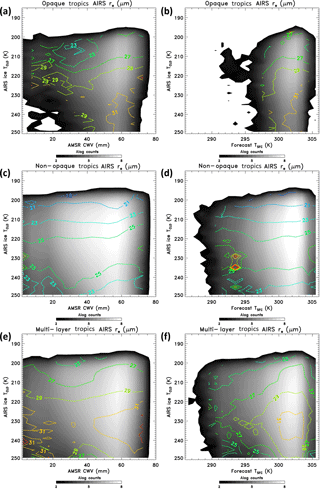
Correlations between rain rate and near surface wind speed in passive MW observations have suggested a tropical precipitation–convergence feedback (Back and Bretherton, 2005). The AMSR low frequency (LF) wind is used to quantify the response of rei to variability in near surface wind speeds in the presence of convection. Figure 8 shows that opaque clouds exhibit dependence on wind speed; the weakest (strongest) winds are associated with the largest (smallest) rei. The change in rei is ∼ 2 µm for Tcld < 210 K but can be as large as 3–5 µm for Tcld > 230 K. The dependence for non-opaque clouds is of opposite sign and lower magnitude when compared to opaque clouds. Figure 8 was also calculated with NWP model winds and is nearly identical with < 1 µm difference (not shown). The consistency between NWP and AMSR winds provided confidence to partition the NWP winds into the individual u- and v-components, and the u-component is shown in the left column of Fig. 8. The largest values of rei are found for light easterly winds around 5–10 m s−1 for opaque, consistent with convectively active regimes generating larger rei (e.g. Protat et al., 2011). Smaller values of a few µm are associated with westerly winds during suppressed convection. Changes in rei due to wind direction changes are largest for Tcld > 230 K and are lowest for the coldest convective cloud tops. Very weak dependence is found for non-opaque clouds.
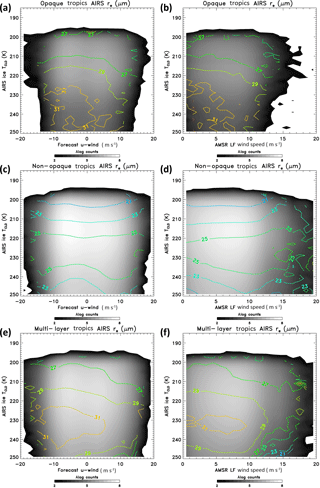
Figure 8AMSR-E/AMSR-2 low frequency (LF) wind speeds (m s−1) (b, d, f) or NWP model u-component wind speeds (a, c, e) vs. Tcld histograms. The log counts are shown as greyscale, the AIRS IR only rei (µm) overlaid as coloured contours, with opaque (a, b), non-opaque (c, d), and multi-layered (e, f) clouds shown separately.
Multi-layer clouds exhibit the largest changes with wind speed (Fig. 8). However, the reduced values of rei at higher wind speeds have low occurrence frequencies (i.e. noted by the greyscale shading). The contribution of retrieval biases that arise from an additional lower layer(s) not accounted for in the forward model (Kahn et al., 2014) has not been quantified. A firm conclusion on the realism of changes in multi-layer cloud top rei to wind speed variability thus remains elusive and warrants further investigation.
The response of τi to near surface wind speed is shown in Fig. 9 for the same cloud categories in Fig. 8. There is little, if any, dependence of τi on wind speed except for slightly larger values during light easterly winds. The values of τi are lowest for non-opaque and confirm that these clouds are typically thin cirrus. The values of τi are a few factors larger for multi-layer and increase for stronger winds.
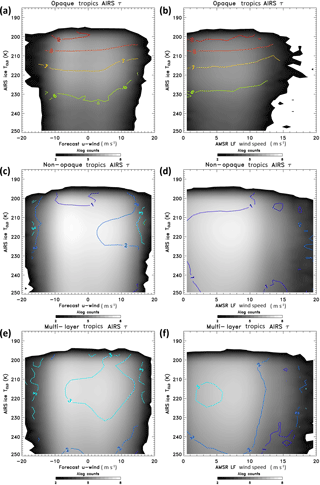
Figure 9AMSR-E/AMSR-2 low frequency (LF) wind speeds (m s−1) (b, d, f) or NWP model u-component wind speeds (a, c, e) vs. Tcld histograms. The log counts are shown as greyscale, the AIRS IR only τi overlaid as colored contours, with opaque (a, b), non-opaque (c, d), and multi-layered (e, f) clouds shown separately.
5.3 Dependence of rei on CWV and Tsfc
The Tsfc and CWV also exhibit correlations with rei (Fig. 10). Opaque clouds exhibit a 2–4 µm jump as CWV increases from 45 to 65 mm, with the largest values for Tcld > 230 K; a similar pattern is observed for Tsfc (Fig. 10). Little dependence of rei is observed for non-opaque clouds. There is an increase in rei with increasing CWV and Tsfc for multi-layer clouds. Overall the rei is lower in non-opaque clouds compared to opaque clouds for all combinations of Tci, CWV, and Tsfc. There is a subtle dependence of τi on CWV for opaque clouds, although this dependence is absent in Tsfc (Fig. 11). Both non-opaque and multi-layer clouds show increases in τi with CWV, but this only holds true for multi-layer clouds for increasing Tsfc.
In the previous section, we showed that AIRS observes larger rei at the tops of convection, and variations that depend on surface wind speed, Tsfc, CWV, and precipitation rate. In this section, the rei at the base of single-layer cirrus clouds, cirrus clouds above weak deep convection, and cirrus clouds above strong deep convection will be shown separately using the classification defined in Sect. 3.4. Stephens (1983) argued for a radiative mechanism that leads to rei growth in cirrus overlying lower-layer clouds from enhanced radiative cooling; particle growth (decay) occurs in a radiatively cooled (heated) environment. DARDAR data are used to test whether the mechanism of Stephens (1983) is operating in observations, and also to determine the behaviour of AIRS in the same clouds. As opacity increases, or the higher (colder) the lower layer cloud occurs, the cooling from the cirrus layer is enhanced and larger rei should therefore be observed. Systematic changes in the global circulation and changes in convective clustering and cloud overlap may lead to a higher frequency of overlapping cirrus on top of convection, and a reduced frequency of thin cirrus with climate change evidenced by trends in the Multi-angle Imaging SpectroRadiometer (MISR) derived cloud texture (Zhao et al., 2016). Thus, we will assess if this mechanism is a viable contributor to upward trends in rei.
Figure 12 shows the median (centre lines), mean (asterisks), and interquartile range (bottom and top edges of boxes) for DARDAR, IR/MW, and IR only AIRS retrievals, with filtered (non-filtered) versions of IR/MW and IR only that have retrievals within 6 K of the cold point tropopause removed (retained). For single-layer cirrus (Ci), AIRS is typically 2–3 µm larger than DARDAR, with about 1 µm difference between IR/MW and IR only. For cirrus above weak convection (Weak conv), AIRS remains about 2–3 µm larger than DARDAR, as all AIRS retrievals increase about 2–3 µm in the mean compared to single-layer cirrus. For cirrus above strong convection (Strong conv), the differences between DARDAR and AIRS are reduced, with IR only about 1–1.5 µm larger than IR/MW. The width of the DARDAR quantiles increases from single-layer cirrus to cirrus over strong convection indicating increased variability in rei; AIRS and DARDAR have nearly identical variability for cirrus above strong convection. AIRS and DARDAR exhibit an increase in rei as convective cloud appears below cirrus layers suggesting that the mechanism described in Stephens (1983) may be operating in these differences. Partitioning contributions to the increase in rei from the Stephens (1983) radiative cooling mechanism for particle growth, and lofting of large ice particles from adjacent convection, however, cannot be easily differentiated; further investigation is warranted in the context of rei trends shown in this work.
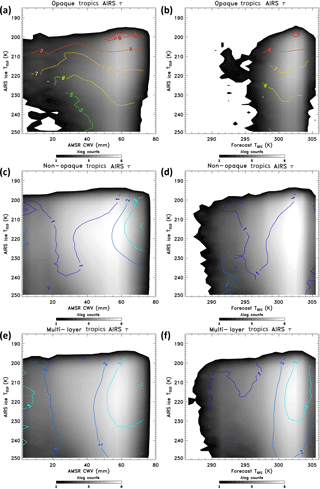
Figure 11AMSR-E/AMSR-2 total CWV (mm) (a, c, e) or Tsfc (K) (b, d, f) vs. Tcld histograms. The log counts are shown as a greyscale, the AIRS IR only τi overlaid as colored contours, with opaque (a, b), non-opaque (c, d), and multi-layered (e, f) clouds shown separately.
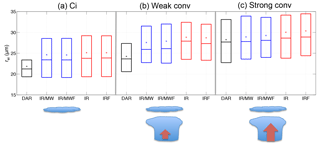
Figure 12DARDAR (black), IR/MW (blue), and IR only (red) retrievals of rei in single-layered cirrus (a), cirrus on top of weak convection (b), and cirrus on top of strong convection (c); see Sect. 3.4 for a description of the definition of convective intensity. The AIRS retrievals are also shown for a filtered version that removes retrievals within 6 K of the tropopause. The central line is the median, the asterisk is the mean, and the bottom and top edges of the boxes are the 25th and 75th percentiles.
While high-level ice clouds are a key component of the changing climate system, there remains an absence of well-characterised observational constraints of ice cloud microphysics that are desired for climate model evaluation (Kärcher, 2017). The Atmospheric Infrared Sounder (AIRS) instrument, launched in May of 2002, is radiometrically stable within ±3–4 mK yr−1 (Pagano et al., 2012). We use the AIRS version 6 ice cloud property and thermodynamic phase retrievals (Kahn et al., 2014) to quantify variability and trends in ice cloud frequency, ice cloud top temperature (Tci), ice optical thickness (τi) and ice effective radius (rei) from 1 September 2002 until 31 August 2016. We also investigate the scalar averaging kernels (AKs) associated with each retrieval quantity to determine changes in information content; and the χ2 fitting parameter, which quantifies the fidelity of the observed and simulated radiance fits across cloud types. Differences are described between the ice cloud properties using the AIRS/AMSU combined cloud-clearing retrieval (IR/MW), the AIRS only cloud-clearing retrieval (IR only), and a subset of IR only for the third of pixels nearest to nadir view (IR nadir).
Spatial patterns in rei reflect differences in proximity to deep convection, thin cirrus, and extratropical storm tracks. The averaging kernels and χ2 patterns are spatially coherent and exhibit variations between different cloud regimes with slight variations observed. The spatial patterns of χ2 and averaging kernels do not resemble each other. For the highest quality retrievals, we can conclude that the spatial variations in information content do not correlate to the spectral radiance fit in the retrievals of Kahn et al. (2014). The trends are nominally 1–2 K of cooling in Tci, an increase of a few tenths to ∼ 1 µm in rei, with the largest values in proximity to tropical convection. In contrast, τi is decreasing except for regions with high frequencies of convection (ITCZ, W. Pacific Warm Pool, and S. Indian Ocean). The trend in ice frequency is similar to τi but is spatially smoother and the magnitude is much larger.
The statistical significance of three wide latitude bands in the tropics, SH, and NH extratropics are calculated following the methodology of Santer et al. (2000). Ice frequency decreases by about 1 % with respect to the total frequency of all AIRS pixels in the SH and NH extratropics (significant at 95 %), and much smaller in the tropics (not significant at 95 %). The ice water path (IWP) decreases by 0.4–0.8 g m−2 in the SH (marginal significance at 95 %) and NH (significant at 95 %), and increases about 0.25 g m−2 in the tropics (not significant at 95 %). The statistical significance of IWP is lower than τi because of compensating increases in rei at all latitudes (significant at 95 %). Impacts of assumed radiometric drift on cloud property trends were determined for a few perturbation experiments. The perturbation experiments fall significantly short of explaining the magnitude of the observed ice property, AKs, and χ2 trends, although some fractional contribution to trends cannot be ruled out.
Surface based and aircraft in situ observations have demonstrated that active periods of deep convection are associated with larger rei at cloud top (e.g. Protat et al., 2011; van Diedenhoven et al., 2014). Values of AIRS rei are plotted against Tcld for opaque, non-opaque, and multi-layer clouds separately; only 1.9 % of ice cloud tops are identified as opaque. Values of rei are 3–9 µm larger (depending on cloud top temperature) for opaque clouds that are treated as a proxy for deep convection. A weaker dependence of rei with Tcld < 210 K occurs and shows similarity to van Diedenhoven et al. (2016). Opaque clouds exhibit some dependence of rei on wind speed. Opaque clouds also exhibit a 2–4 µm jump as CWV increases from 45 to 65 mm, and a similar pattern is observed for Tsfc. Non-opaque clouds do not exhibit much of a dependence on CWV and Tsfc.
The differences in rei at the tops of opaque, non-opaque and multi-layer ice clouds due to thermodynamic and dynamic variability suggest distinct cloud regime behaviour. The low frequency of occurrence of opaque ice clouds (1.9 %) implies that temporal changes in deep convective behaviour are likely overwhelmed by non-opaque and multi-layer behaviour. Secular changes in the joint histograms themselves, and, furthermore, changes in the frequency of occurrence within the joint histogram bins, must be quantified to deduce if trends or variability in CWV, rain occurrence, surface wind speed, and other relevant geophysical parameters such as low-level convergence (e.g. Stephens et al., 2018) could explain in part or whole secular trends in rei.
Comparisons between DARDAR and AIRS rei are made for single-layer cirrus, cirrus above weak convection, and cirrus above strong convection. AIRS is typically 1–3 µm larger than DARDAR with about 1 µm difference between IR/MW and IR only. AIRS and DARDAR exhibit an increase in rei as convective cloud appears below cirrus layers suggesting that the mechanism described in Stephens (1983) may be operating in these differences. However, secular trends in convective aggregation, convective mode, the probability distribution of vertical velocity, and ice nucleation and growth mechanisms that may change within the changing character of convection (e.g. Chen et al., 2016), are highly complex and uncertain in observations. The pixel-level collocations of AIRS, AMSR, and DARDAR are a first attempt at identifying atmospheric processes that could be responsible for secular trends in ice cloud properties. Further research is necessary to quantify the links between trends in ice cloud microphysics shown in this work with cloud responses in climate model simulations.
Current and future work will require the full AIRS and AMSR observational record to be collocated at the pixel scale to derive secular trends within the joint histograms. This will enable the assessment of whether there are preferred cloud, thermodynamic, or dynamical regimes that exhibit either strong or weak trends, or perhaps whether opposing trends among regimes exist. Further research is necessary to determine if retrieval biases may explain in part the variability exhibited in the multi-layer cloud category. The results presented herein were restricted to the July–August time period and ±18∘ latitude oceans. Cursory inspection of other latitudes and months (not shown) can exhibit different behaviour and may indicate fundamental differences in time changes of ice cloud properties between tropical and extratropical cloud processes. Lastly, this investigation does not include the analysis on cloud thermodynamic phase differences (liquid vs. ice), cloud top temperature, and ECF, as those results will be reported elsewhere.
The AIRS version 6 data sets were processed by and obtained from the Goddard Earth Services Data and Information Services Center (http://daac.gsfc.nasa.gov/, last access: 1 July 2017) (Teixeira, 2013). The AMSR-E/AMSR-2 Version 7 data sets were processed by and obtained from Remote Sensing Systems (http://www.remss.com, 17 July 2017; Wentz et al., 2014a, b). The AIRS and AMSR data were collocated together using the data sets provided by Fetzer et al. (2013). The DARDAR data sets were processed by and obtained from the ICARE Thematic Center (http://www.icare.univ-lille1.fr/archive/). The data and code used in this investigation are available upon request from the lead author (brian.h.kahn@jpl.nasa.gov).
Figure A1 shows that the AIRS algorithm differences in IR only (AIRS2RET) minus IR/MW (AIRX2RET) on the frequency of ice phase clouds over the global oceans are less than 1 %. This implies that virtually the same sets of pixels are identified as ice in the two retrievals. The impacts on Tci are on the order of 1–2 K difference with IR only slightly cooler especially in the tropics. Some subtle and spatially coherent changes in τi of ∼ 0.1 are observed with IR only thinner. The rei is larger by 0.5–1.0 µm in IR only compared to IR/MW but a few of the extratropical storm track regions exhibit an opposite sign. To summarise, for the IR only retrieval, τi is lower by 0.1, rei is larger by 0.5–1.0 µm in most areas, and Tci is lower by 1–2 K depending on the latitude.
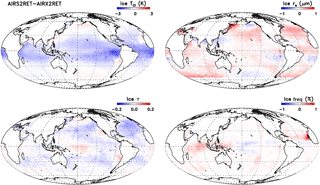
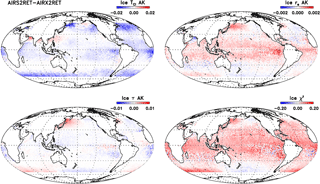
Figure A1The differences in IR only (AIRS2RET) minus IR/MW (AIRX2RET) for the same time period as described in Fig. 1 for Tci, rei, τi, and ice cloud frequency. Note that the minimum and maximum differences may exceed those indicated in the colour bar.
Figure A2 shows the same differences as Fig. A1, except for the Tci, rei, and τi AKs, and the χ2 fitting parameter. The differences in AKs and χ2 are generally small but some notable regional differences are observed. The Tci AK is mostly lower for the IR only compared to IR/MW and is consistent with added information provided by the microwave channels in the AMSU instrument. The rei AK is larger for the IR only compared to IR/MW but the difference is an order of magnitude smaller than the Tci AK difference. The τi AK difference is small and does not exhibit coherent cloud-regime dependence except for the Saharan air layer. The difference in χ2 shows slightly worse fitting for the IR only; this is also consistent with added information provided by microwave channels in the AMSU instrument. Most of the globe is 0.1–0.2 higher for IR only, which is about 5 % of the mean value of χ2= 3–4 for retrievals restricted to QC = [0, 1].
BHK led the design of the research, performed data analysis, and wrote the manuscript. HT led the DARDAR data analysis and helped write the manuscript. GLS helped design the research with regard to investigating cloud top microphysical responses to convection. QY helped design the data analysis. JD provided DARDAR data and expertise on its use in this investigation. GM provided collocated data sets used in the data analysis. EMM performed offline retrievals of AIRS data using adjusted radiance calibration and helped design the assessment of calibration drift on cloud property trends. AJH provided in situ data and helped write the manuscript.
The authors declare that they have no conflict of interest.
AMSR-E and AMSR-2 data products are produced by Remote Sensing
Systems and were sponsored by the NASA AMSR-E Science Team. The collocation methodology
matching AIRS/AMSU with AMSR-E/AMSR-2 and DARDAR used index files generated
through the NASA Earth Science Program NASA's Making Earth Science Data
Records for Use in Research Environments (MEaSUREs) program. Brian H. Kahn
was partially supported by the AIRS project at JPL and by the NASA Science of
Terra and Aqua program under grant NNN13D455T. We thank two anonymous
reviewers for very constructive comments on the manuscript, George Aumann,
Steve Broberg, and Tom Pagano for detailed discussions about AIRS
calibration, and Noel Cressie for guidance about testing for statistical
significance. Part of this research was carried out at the Jet Propulsion
Laboratory (JPL), California Institute of Technology, under a contract with
the National Aeronautics and Space Administration.
Edited by: Qiang Fu
Reviewed by: two
anonymous referees
Back, L. E. and Bretherton, C. S.: The relationship between wind speed and precipitation in the Pacific ITCZ, J. Climate, 18, 4317–4328, 2005.
Barahona, D., Molod, A., Bacmeister, J., Nenes, A., Gettelman, A., Morrison, H., Phillips, V., and Eichmann, A.: Development of two-moment cloud microphysics for liquid and ice within the NASA Goddard Earth Observing System Model (GEOS-5), Geosci. Model Dev., 7, 1733–1766, https://doi.org/10.5194/gmd-7-1733-2014, 2014.
Baum, B. A., Yang, P, Nasiri, S. L., Heidinger, A. K., Heymsfield, A. J., and Li, J.: Bulk scattering properties for the remote sensing of ice clouds. Part III: High-resolution spectral models from 100 to 3250 cm−1, J. Appl. Meteorol. Clim., 46, 423–434, 2007.
Baumgardner, D., Abel, S. J., Axisa, D., Cotton, R., Crosier, J., Field, P., Gurganus, C., Heymsfield, A., Korolev, A., Krämer, M., Lawson, P., McFarquhar, G., Ulanowski, Z., and Um, J.: Cloud ice properties: In situ measurement challenges. Ice Formation and Evolution in Clouds and Precipitation: Measurement and Modeling Challenges, Meteor. Monogr., 58, Amer. Meteor. Soc., https://doi.org/10.1175/AMSMONOGRAPHS-D-16-0011.1, 2017.
Bender, F. A. M., Ramanathan, V., and Tselioudis, G.: Changes in extratropical storm track cloudiness 1983–2008: Observational support for a poleward shift, Clim. Dynam., 38, 2037–2053, 2012.
Bony, S., Stevens, B., Coppin, D., Becker, T., Reed, K. A., Voigt, A., and Medeiros, B.: Thermodynamic control of anvil cloud amount, P. Natl. Acad. Sci. USA, 113, 8927–8932, https://doi.org/10.1073/pnas.1601472113, 2016.
Ceccaldi, M., Delanoë, J., Hogan, R. J., Pounder, N. L., Protat, A., and Pelon, J.: From CloudSat-CALIPSO to EarthCare: Evolution of the DARDAR cloud classification and its comparison to airborne radar-lidar observations, J. Geophys. Res.-Atmos., 118, 7962–7981, https://doi.org/10.1002/jgrd.50579, 2013.
Ceppi, P., Hartmann, D. L., and Webb, M. J.: Mechanisms of the negative shortwave cloud feedback in middle to high latitudes, J. Climate, 29, 139–157, 2016.
Chang, F. L. and Li, Z.: A near global climatology of single-layer and overlapped clouds and their optical properties retrieved from TERRA/MODIS data using a new algorithm, J. Climate, 18, 4752–4771, 2005.
Chang, K.-W., L'Ecuyer, T. S., Kahn, B. H., and Natraj, V.: Information content of visible and midinfrared radiances for retrieving tropical ice cloud properties, J. Geophys. Res.-Atmos., 122, 4944–4966, https://doi.org/10.1002/2016JD026357, 2017.
Chen, Y.-W., Seiki, T., Kodama, C., Satoh, M., Noda, A. T., and Yamada, Y.: High cloud responses to global warming simulated by two different cloud microphysics schemes implemented in the Nonhydrostatic Icosahedral Atmospheric Model (NICAM), J. Climate, 29, 5949–5964, 2016.
Cressie, N.: Relaxing assumptions in the one sample t-test, Australian J. Stat., 22, 143–153, 1980.
Delanoë, J. and Hogan, R. J.: A variational scheme for retrieving ice cloud properties from combined radar, lidar, and infrared radiometer, J. Geophys. Res., 113, D07204, https://doi.org/10.1029/2007JD009000, 2008.
Delanoë, J. and Hogan, R. J.: Combined CloudSat-CALIPSO-MODIS retrievals of the properties of ice clouds, J. Geophys. Res., 115, D00H29, https://doi.org/10.1029/2009JD012346, 2010.
Delanoë, J., Heymsfield, A. J., Protat, A., Bansemer, A., and Hogan, R. J.: Normalized particle size distribution for remote sensing application, J. Geophys. Res.-Atmos., 119, 4204–4227, https://doi.org/10.1002/2013JD020700, 2014.
Deng, M., Mace, G. G., Wang, Z., and Lawson, R. P.: Evaluation of several A-train ice cloud retrieval products with in situ measurements collected during the SPARTICUS campaign, J. Appl. Meteorol. Clim., 52, 1014–1030, 2013.
Dim, J. R., Murakami, H., Nakajima, T. Y., Nordell, B., Heidinger, A. K., and Takamura, T.: The recent state of the climate: Driving components of cloud-type variability, J. Geophys. Res., 116, D11117, https://doi.org/10.1029/2010JD014559, 2011.
Eidhammer, T., Morrison, H., Mitchell, D., Gettelman, A., and Erfani, E.: Improvements in global climate model microphysics using a consistent representation of ice particle properties, J. Climate, 30, 609–629, 2017.
Fan, J., Leung, L. R., Rosenfeld, D., Chen, Q., Li, Z., Zhang, J., and Yan, H.: Microphysical effects determine macrophysical response for aerosol impacts on deep convective clouds, P. Natl. Acad. Sci. USA, 110, E4581–E4590, 2013.
Fauchez, T., Dubuisson, P., Cornet, C., Szczap, F., Garnier, A., Pelon, J., and Meyer, K.: Impacts of cloud heterogeneities on cirrus optical properties retrieved from space-based thermal infrared radiometry, Atmos. Meas. Tech., 8, 633–647, https://doi.org/10.5194/amt-8-633-2015, 2015.
Fetzer, E., Wilson, B., and Manipon, G.: AIRS-AMSU variables-CloudSat cloud mask, radar reflectivities, and cloud classification matchups V3.2, Greenbelt, MD, USA, Goddard Earth Sciences Data and Information Services Center (GES DISC), https://doi.org/10.5067/MEASURES/WVCC/DATA201, 2013.
Garnier, A., Pelon, J., Dubuisson, P.,Yang, P., Faivre, M., Chomette, O., Pascal, N., Lucker, P., and Murray, T.: Retrieval of cloud properties using CALIPSO Imaging Infrared Radiometer, Part II: effective diameter and ice water path, J. Appl. Meteorol. Clim., 52, 2582–2599, https://doi.org/10.1175/JAMC-D-12-0328.1, 2013.
Gentemann, C. L., Meissner, T., and Wentz, F. J.: Accuracy of Satellite Sea Surface Temperatures at 7 and 11 GHz, IEEE T. Geosci. Remote, 48, 1009–1018, 2010.
Gettelman, A., Liu, X., Ghan, S. J., Morrison, H., Park, S., Conley, A. J., Klein, S. A., Boyle, J., Mitchell, D. L., and Li, J.-L. F.: Global simulations of ice nucleation and ice supersaturation with an improved cloud scheme in the Community Atmosphere Model, J. Geophys. Res., 115, D18216, https://doi.org/10.1029/2009JD013797, 2010.
Grabowski, W. W.: Untangling Microphysical Impacts on Deep Convection Applying a Novel Modeling Methodology, J. Atmos. Sci., 72, 2446–2464, 2015.
Heymsfield, A., Winker, D., Avery, M., Vaughan, M., Diskin, G., Deng, M., Mitev, V., and Matthey, R.: Relationships between Ice Water Content and Volume Extinction Coefficient from In Situ Observations for Temperatures from 0∘ to −86 ∘C: Implications for Spaceborne Lidar Retrievals, J. Appl. Meteorol. Clim., 53, 479–505, 2014.
Heymsfield, A. J., Schmitt, C., and Bansemer, A.: Ice cloud particle size distributions and pressure-dependent terminal velocities from in situ observations at temperatures from 0∘ to −86 ∘C, J. Atmos. Sci., 70, 4123–4154, 2013.
Hilburn, K. A. and Wentz, F. J.: Intercalibrated Passive Microwave Rain Products from the Unified Microwave Ocean Retrieval Algorithm (UMORA), J. Appl. Meteorol. Clim., 47, 778–794, 2008.
Hong, Y. and Liu, G.: The characteristics of ice cloud properties derived from CloudSat and CALIPSO measurements, J. Climate, 28, 3880–3901, 2015.
Huang, H.-L., Yang, P., Wei, H., Baum, B. A., Hu, Y., Antonelli, P., and Ackerman, S. A.: Inference of ice cloud properties from high spectral resolution infrared observations, IEEE T. Geosci. Remote, 42, 842–853, 2004.
Irion, F. W., Kahn, B. H., Schreier, M. M., Fetzer, E. J., Fishbein, E., Fu, D., Kalmus, P., Wilson, R. C., Wong, S., and Yue, Q.: Single-footprint retrievals of temperature, water vapor and cloud properties from AIRS, Atmos. Meas. Tech., 11, 971–995, https://doi.org/10.5194/amt-11-971-2018, 2018.
Jiang, J. H., Su, H., Zhai, C., Massie, S. T., Schoeberl, M. R., Colarco, P. R., Platnick, S., Gu, Y., and Liou, K.-N.: Influence of convection and aerosol pollution on ice cloud particle effective radius, Atmos. Chem. Phys., 11, 457–463, https://doi.org/10.5194/acp-11-457-2011, 2011.
Jin, H. and Nasiri, S. L.: Evaluation of AIRS cloud-thermodynamic phase determination with CALIPSO, J. Appl. Meteorol. Clim., 53, 1012–1027, 2014.
Kahn, B. H., Liang, C. K., Eldering, A., Gettelman, A., Yue, Q., and Liou, K. N.: Tropical thin cirrus and relative humidity observed by the Atmospheric Infrared Sounder, Atmos. Chem. Phys., 8, 1501–1518, https://doi.org/10.5194/acp-8-1501-2008, 2008.
Kahn, B. H., Irion, F. W., Dang, V. T., Manning, E. M., Nasiri, S. L., Naud, C. M., Blaisdell, J. M., Schreier, M. M., Yue, Q., Bowman, K. W., Fetzer, E. J., Hulley, G. C., Liou, K. N., Lubin, D., Ou, S. C., Susskind, J., Takano, Y., Tian, B., and Worden, J. R.: The Atmospheric Infrared Sounder version 6 cloud products, Atmos. Chem. Phys., 14, 399–426, https://doi.org/10.5194/acp-14-399-2014, 2014.
Kahn, B. H., Schreier, M. M., Yue, Q., Fetzer, E. J., Irion, F. W., Platnick, S., Wang, C., Nasiri, S. L., and L'Ecuyer, T. S.: Pixel-scale assessment and uncertainty analysis of AIRS and MODIS ice cloud optical thickness and effective radius, J. Geophys. Res.-Atmos., 120, 11669–11689, 2015.
Kahn, B. H., Matheou, G., Yue, Q., Fauchez, T., Fetzer, E. J., Lebsock, M., Martins, J., Schreier, M. M., Suzuki, K., and Teixeira, J.: An A-train and MERRA view of cloud, thermodynamic, and dynamic variability within the subtropical marine boundary layer, Atmos. Chem. Phys., 17, 9451–9468, https://doi.org/10.5194/acp-17-9451-2017, 2017.
Kärcher, B.: Cirrus clouds and their response to anthropogenic activities, Curr. Clim. Change Rep., 3, 45–57, https://doi.org/10.1007/s40641-017-0060-3, 2017.
King, M. D., Platnick, S., Menzel, W. P., Ackerman, S. A., and Hubanks, P. A.: Spatial and temporal distributions of clouds observed by MODIS onboard the Terra and Aqua satellites, IEEE T. Geosci. Remote, 51, 3826–3852, 2013.
Krämer, M., Rolf, C., Luebke, A., Afchine, A., Spelten, N., Costa, A., Meyer, J., Zöger, M., Smith, J., Herman, R. L., Buchholz, B., Ebert, V., Baumgardner, D., Borrmann, S., Klingebiel, M., and Avallone, L.: A microphysics guide to cirrus clouds – Part 1: Cirrus types, Atmos. Chem. Phys., 16, 3463–3483, https://doi.org/10.5194/acp-16-3463-2016, 2016.
Keckhut, P., Borchi, F., Bekki, S., Hauchecorne, A., and Silaouina, M.: Cirrus classification at midlatitude from systematic lidar observations, J. Appl. Meteorol. Clim., 45, 249–258, 2006.
Lawson, R. P., Jensen, E., Mitchell, D. L., Baker, B., Mo, Q., and Pilson, B.: Microphysical and radiative properties of tropical clouds investigated in TC4 and NAMMA, J. Geophys. Res., 115, D00J08, https://doi.org/10.1029/2009JD013017, 2010.
Leroy, D., Fontaine, E., Schwarzenboeck, A., Strapp, J. W., Korolev, A., Mcfarquhar, G., Dupuy, R., Gourbeyre, C., Lilie, L., Protat, A., Delanoe, J., Dezitter, F., and Grandin, A.: Ice crystal sizes in High Ice Water Content clouds. Part II: Statistics of mass diameter percentiles in tropical convection observed in the HAIC/HIWC project, J. Atmos. Ocean. Tech., 34, 117–136, 2017.
Lindzen, R. S., Chou, M.-D., and Hou, A. U.: Does the Earth have an adaptive infrared iris?, B. Am. Meteorol. Soc., 82, 417–432, 2001.
Liu, X., Penner, J. E., Ghan, S. J., and Wang, M.: Inclusion of ice microphysics in the NCAR Community Atmospheric Model Version 3 (CAM3), J. Climate, 20, 4526–4547, 2007.
Luo, Z., Liu, G. Y., and Stephens, G. L: CloudSat adding new insight into tropical penetrating convection, Geophys. Res. Lett., 35, L19819, https://doi.org/10.1029/2008GL035330, 2008.
Mace, G. G., Zhang, Q., Vaughan, M., Marchand, R., Stephens, G., Trepte, C., and Winker, D.: A description of hydrometeor layer occurrence statistics derived from the first year of merged Cloudsat and CALIPSO data, J. Geophys. Res., 114, D00A26, https://doi.org/10.1029/2007JD009755, 2009.
Manaster, A., O'Dell, C., and Elsaesser, G.: Evaluation of Cloud Liquid Water Path Trends Using a Multidecadal Record of Passive Microwave Observations, J. Climate, 30, 5871–5884, https://doi.org/10.1175/JCLI-D-16-0399.1, 2017.
Manning, E. M. and Aumann, H. H.: Hyperspectral sounder performance for cold scenes, Proc. SPIE 10402, Earth Observing Systems XXII, 1040225, https://doi.org/10.1117/12.2273398, 2017.
Marvel, K., Zelinka, M., Klein, S. A., Bonfils, C., Caldwell, P., Doutriaux, C., Santer, B. D., and Taylor, K. E.: External influences on modeled and observed cloud trends, J. Climate, 28, 4820–4840, 2015.
Mauritsen, T. and Stevens, B.: Missing iris effect as a possible cause of muted hydrological change and high climate sensitivity in models, Nat. Geosci., 8, 346–351, https://doi.org/10.1038/ngeo2414, 2015.
McFarquhar, G. M. and Heymsfield, A. J.: The definition and significance of an effective radius for ice clouds. J. Atmos. Sci., 55, 2039–2052, https://doi.org/10.1175/1520-0469(1998)055<2039:TDASOA>2.0.CO;2, 1998.
Minnis, P., Sun-Mack, S., Young, D. F., Heck, P. W., Garber, D. P., Chen, Y., Spangenberg, D. A., Arduini, R. F., Trepte, Q. Z., Smith, W. L., Ayers, J. K., Gibson, S. C., Miller, W. F., Hong, G., Chakrapani, V., Takano, Y., Liou, K.-N., Xie, Y., and Yang, P.: CERES edition-2 cloud property retrievals using TRMM VIRS and Terra and Aqua MODIS data, Part I: Algorithms. IEEE T. Geosci. Remote, 49, 4374–4400, 2011.
Mitchell, D. L., Rasch, P., Ivanova, D., McFarquhar, G., and Nousiainen, T.: Impact of small ice crystal assumptions on ice sedimentation rates in cirrus clouds and GCM simulations, Geophys. Res. Lett., 35, L09806, https://doi.org/10.1029/2008GL033552, 2008.
Morrison, H. and Grabowski, W. W.: Cloud-system resolving model simulations of aerosol indirect effects on tropical deep convection and its thermodynamic environment, Atmos. Chem. Phys., 11, 10503–10523, https://doi.org/10.5194/acp-11-10503-2011, 2011.
Nasiri, S. L., Dang, V. T., Kahn, B. H., Fetzer, E. J., Manning, E. M., Schreier, M. M., and Frey, R. A.: Comparing MODIS and AIRS infrared-based cloud retrievals, J. Appl. Meteorol. Clim., 50, 1057–1072, https://doi.org/10.1175/2010JAMC2603.1, 2011.
Norris, J. R., Allen, R. J., Evan, A. T., Zelinka, M. D., O'Dell, C. W., and Klein, S. A.: Evidence for climate change in the satellite cloud record, Nature, 536, 72–75, https://doi.org/10.1038/nature18273, 2016.
Pagano, T. S., Broberg, S., Aumann, H. H., Elliott, D., Manning, E., and Strow, L.: Performance status of the Atmospheric Infrared Sounder ten years after launch, Proc. SPIE 8527, Multispectral, Hyperspectral, and Ultraspectral Remote Sensing Technology, Techniques and Applications IV, 852703, https://doi.org/10.1117/12.977309, 2012.
Phillips, V. T. J., Donner, L. J., and Garner, S. T.: Nucleation processes in deep convection simulated by a cloud-system-resolving model with double-moment bulk microphysics, J. Atmos. Sci., 64, 738–761, 2007.
Platnick, S., Meyer, K. G., King, M. D., Wind, G., Amarasinghe, N., Marchant, B., Arnold, G. T., Zhang, Z., Hubanks, P. A., Holz, R. E., Yang, P., Ridgway, W. L., and Riedi, J.: The MODIS cloud optical and microphysical products: Collection 6 updates and examples from Terra and Aqua, IEEE T. Geosci. Remote, 55, 502–525, https://doi.org/10.1109/TGRS.2016.2610522, 2017.
Posselt, D., L'Ecuyer, T. S., and Stephens, G. L.: Exploring the error characteristics of thin ice cloud property retrievals using a Markov chain Monte Carlo algorithm, J. Geophys. Res., 113, D24206, https://doi.org/10.1029/2008JD010832, 2008.
Protat, A., Delanoë, J., May, P. T., Haynes, J., Jakob, C., O'Connor, E., Pope, M., and Wheeler, M. C.: The variability of tropical ice cloud properties as a function of the large-scale context from ground-based radar-lidar observations over Darwin, Australia, Atmos. Chem. Phys., 11, 8363–8384, https://doi.org/10.5194/acp-11-8363-2011, 2011.
Protopapadaki, S. E., Stubenrauch, C. J., and Feofilov, A. G.: Upper tropospheric cloud systems derived from IR sounders: properties of cirrus anvils in the tropics, Atmos. Chem. Phys., 17, 3845–3859, https://doi.org/10.5194/acp-17-3845-2017, 2017.
Rosenfeld, D., Lohmann, U., Raga, G. B., and Coauthors: Flood or drought: How do aerosols affect precipitation?, Science, 321, 1309–1313, https://doi.org/10.1126/science.1160606, 2008.
Rysman, J.-F., Claud, C., and Delanoë, J: Monitoring deep convection and convective overshooting from 60∘ S to 60∘ N using MHS: A CloudSat/CALIPSO-based assessment, IEEE Geosci. Remote Sens., 14, 159–163, 2017.
Sanderson, B. M., Piani, C., Ingram, W. J., Stone, D. A., and Allen, M. R.: Towards constraining climate sensitivity by linear analysis of feedback patterns in thousands of perturbed-physics GCM simulations, Clim. Dynam., 30, 175–190, 2008.
Santer, B. D., Wigley, T. M. L., Boyle, J. S., Gaffen, D. J., Hnilo, J. J., Nychka, D., Parker, D. E., and Taylor, K. E.: Statistical significance of trends and trend differences in layer-average atmospheric temperature time series, J. Geophys. Res., 105, 7337–7356, 2000.
Satoh, M. and Matsuda, Y.: Statistics on high-cloud areas and their sensitivities to cloud microphysics using single-cloud experiments, J. Atmos. Sci., 66, 2659–2677, 2009.
Sherwood, S. C.: Aerosols and ice particle size in tropical cumulonimbus, J. Climate, 15, 1051–1063, 2002.
Stanford, M. W., Varble, A., Zipser, E., Strapp, J. W., Leroy, D., Schwarzenboeck, A., Potts, R., and Protat, A.: A ubiquitous ice size bias in simulations of tropical deep convection, Atmos. Chem. Phys., 17, 9599–9621, https://doi.org/10.5194/acp-17-9599-2017, 2017.
Stephens, G. L.: The influence of radiative transfer on the mass and heat budgets of ice crystals falling in the atmosphere, J. Atmos. Sci., 40, 1729–1739, 1983.
Stephens, G. L., Hakuba, M. Z., Webb, M., Lebsock, M., Yue, Q., Kahn, B. H., Hristova-Veleva, S., Rapp, A., Stubenrauch, C., Elsasser, G., and Slingo, J.: Regional intensification of the tropical hydrological cycle during ENSO, Geophys. Res. Lett., 45, 4361–4370, https://doi.org/10.1029/2018GL077598, 2018.
Stubenrauch, C., Rossow, W. B., Kinne, S., and Coauthors: Assessment of global cloud datasets from satellites: Project and database initiated by the GEWEX Radiation Panel, B. Am. Meteorol. Soc., 94, 1031–1049, https://doi.org/10.1175/BAMS-D-12-00117.1, 2013.
Su, H., Jiang, J. H., Neelin, J. D., and Coauthors: Tightening of tropical ascent and high clouds key to precipitation change in a warmer climate, Nat. Commun., 8, 15771, https://doi.org/10.1038/ncomms15771, 2017.
Takahashi, H. and Luo, Z.: Where is the level of neutral buoyancy for deep convection?, Geophys. Res. Lett., 39, L15809, https://doi.org/10.1029/2012GL052638, 2012.
Takahashi, H. and Luo, Z. J.: Characterizing tropical overshooting deep convection from joint analysis of CloudSat and geostationary satellite observations, J. Geophys. Res.-Atmos., 119, 112–121, 2014.
Takahashi, H., Luo, Z. J., and Stephens, G. L.: Level of neutral buoyancy, deep convective outflow, and convective core: New perspectives based on 5 years of CloudSat data, J. Geophys. Res.-Atmos, 122, 2958–2969, https://doi.org/10.1002/2016JD025969, 2017.
Teixeira, J.: AIRS/Aqua L2 Standard Physical Retrieval (AIRS+AMSU) V006, Greenbelt, MD, USA, Goddard Earth Sciences Data and Information Services Center (GES DISC), https://doi.org/10.5067/AQUA/AIRS/DATA201, 2013.
van Diedenhoven, B., Fridlind, A. M., Cairns, B., and Ackerman, A. S.: Variation of ice crystal size, shape, and asymmetry parameter in tops of tropical deep convective clouds, J. Geophys. Res.-Atmos., 119, 11809–11825, 2014.
van Diedenhoven, B., Fridlind, A. M., Cairns, B., Ackerman, A. S., and Yorks, J. E.: Vertical variation of ice particle size in convective cloud tops, Geophys. Res. Lett., 43, 4586–4593, 2016.
Van Weverberg, K., Vogelmann, A. M., Lin, W., Luke, E. P., Cialella, A., Minnis, P., Khaiyer, M., Boer, E. R., and Jensen, M. P.: The role of cloud microphysics parameterization in the simulation of mesoscale convective system clouds and precipitation in the tropical western Pacific, J. Atmos. Sci., 70, 1104–1128, 2013.
Wang, C., Platnick, S., Zhang, Z., Meyer, K., and Yang, P: Retrieval of ice cloud properties using an optimal estimation algorithm and MODIS infrared observations: 1. Forward model, error analysis, and information content, J. Geophys. Res.-Atmos., 121, 5809–5826, https://doi.org/10.1002/2015JD024526, 2016.
Wentz, F. J., Meissner, T., Gentemann, C., and Brewer, M.: Remote Sensing Systems AQUA AMSR-E Daily Environmental Suite on 0.25 deg grid, Version V7, Remote Sensing Systems, Santa Rosa, CA, available at: http://remss.com/missions/amsr (last access: 16 May 2017), 2014a.
Wentz, F. J., Meissner, T., Gentemann, C., Hilburn, K. A., and Scott, J.: Remote Sensing Systems GCOM-W1 AMSR2 Daily Environmental Suite on 0.25 deg grid, Version V7.2, Remote Sensing Systems, Santa Rosa, CA, available at: http://remss.com/missions/amsr, 2014b.
Winker, D. M., Pelon, J., Coakley, J. A., Ackerman, S. A., Charlson, R. J., Colarco, P. R., Flamant, P., Fu, Q., Hoff, R. M., Kittaka, C., Kubar, T. L., Le Treut, H., McCormick, M. P., Megie, E., Poole, L., Powell, K., Trepte, C., Vaughan, M. A., and Wielicki, B. A.: The CALIPSO mission. A global 3D view of aerosols and clouds, B. Am. Meteorol. Soc., 91, 1211–1229, 2010.
Wylie, D., Jackson, D. L., Menzel, W. P., and Bates, J. J.: Trends in global cloud cover in two decades of HIRS observations, J. Climate, 18, 3021–3031, 2005.
Yuan, T. and Li, Z.: General macro- and microphysical properties of deep convective clouds as observed by MODIS, J. Climate, 23, 3457–3473, 2010.
Yue, Q., Kahn, B. H., Fetzer, E. J., Wong, S., Frey, R., and Meyer, K. G.: On the response of MODIS cloud coverage to global mean surface air temperature, J. Geophys. Res.-Atmos., 122, 966–979, https://doi.org/10.1002/2016JD025174, 2017a.
Yue, Q., Lambrigtsen, B., Behrangi, A., and Coauthors: AIRS V6 Test Report Supplement: Performance of AIRS+AMSU vs. AIRS-only retrievals: Analysis of the impact of the loss of AMSU-A2, 104 pp., 2017b.
Zelinka, M. D., Klein, S. A., Taylor, K. E., Andrews, T., Webb, M. J., Gregory, J. M., and Forster, P.: Contributions of different cloud types to feedbacks and rapid adjustments in CMIP5, J. Climate, 26, 5007–5027, https://doi.org/10.1175/JCLI-D-12-00555.1, 2013.
Zhang, Z., Platnick, S., Yang, P., Heidinger, A. K., and Comstock, J. M.: Effects of ice particle size vertical inhomogeneity on the passive remote sensing of ice clouds, J. Geophys. Res., 115, D17203, https://doi.org/10.1029/2010JD013835, 2010.
Zhao, G., Di Girolamo, L., Diner, D. J., Bruegge, C. J., Mueller, K. J., and Wu, D. L.: Regional changes in Earth's color and texture as observed from space over a 15-year period, IEEE T. Geosci. Remote, 54, 4240–4249, 2016.


